Application of the discrete element method for modeling of rock crack propagation
and coalescence in the step-path failure mechanism
Luis Arnaldo Mejía Camones
a, Eurípedes do Amaral Vargas Jr.
a,⁎,
Rodrigo Peluci de Figueiredo
b, Raquel Quadros Velloso
aaDepartament of Civil Engineering, Catholic University of Rio de Janeiro, Rio de Janeiro, RJ, Brazil bDepartment of Mining Engineering, Federal University of Ouro Preto, Ouro Preto, MG, Brazil
a b s t r a c t
a r t i c l e
i n f o
Article history: Received 14 May 2012
Received in revised form 30 October 2012 Accepted 17 November 2012
Available online 14 December 2012
Keywords:
Discrete element method Rock crack propagation Step path
Rock slope stability Failure mechanisms Crack coalescence
The present study evaluates the discrete element method (DEM) as a tool for understanding the step-path failure mechanism in fractured rock masses. Initially, the study simulates crack propagation and coalescence in biaxial and triaxial laboratory tests. The results of this analysis show that the DEM accurately represents these processes in comparison to other studies in the technical literature. The crack propagation and coalescence processes are important in the step-path failure mechanism for slopes. Simple examples of this mechanism were modeled, and their results were compared with those of the analytical model proposed byJennings (1970). Among the possibilities suggested by Jennings, modeling with DEM did not provide a good approximation for the case of co-planar cracks, for which failures in the intact rock bridges should only be caused by shear forces. In modeling with DEM, tensile failures occur within the sliding block, generating forces that are not considered in the Jennings model. The non-coplanar crack condition provided a better approximation, since the Jennings model formulation for this case includes the tensile failure of the rock. The main advantage of the DEM over other computational tools is its micromechanical representation of discontinuous media, which permits a better understanding of the step-path failure mechanism. However, good calibration of the macroscopic parameters of the rock and its discontinuities is necessary to obtain good results.
© 2012 Elsevier B.V. All rights reserved.
1. Introduction
The stability of a rock slope is highly dependent on the configuration and spatial distribution of its discontinuities and the maximum height of the slope (Read and Stacey, 2009). The stability of small slopes is controlled by discontinuities, and the most common failure modes are planar, in wedge, and toppling, which can be evaluated using limit equi-librium methods (Hoek and Bray, 1981). However, when the height of a slope becomes much larger than the persistence of its discontinuities, ruptures also involve intact rock in failure mechanisms that are gener-ally little understood (Hustrulid et al., 2000). The relative motion on the discontinuities leads to their propagation through the intact rocks, creating new fractures in the rock matrix.
Of the different failure mechanisms described bySjöberg (1996), the step-path type is probably the most important for evaluation in high slopes. In this mechanism, the overall rupture surface is formed by the union of several pre-existing discontinuities that propagate by a process called coalescence. These processes are also observed on the microscale. Griffith (1924) (inWhittaker et al., 1992) noted that crack
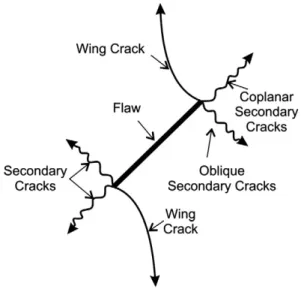
propagation under compressive conditions is caused by tensile stresses that act near the tips of pre-existing cracks. Under these conditions, prop-agation is initiated, forming primary tensile cracks that propagate in the direction of the applied load (wing cracks -Horii and Nemat-Nasser (1985); Ashby and Hallam (1986); Einstein and Dershowitz (1990) amongst others). In studies performed byPark and Bobet (2009) on gypsite specimens subjected to uniaxial compression, up to three types of fractures propagated as a result of the applied load (Fig. 1): primary cracks generated by tension (Mode I), which initiated at the edges of the crack and contained no pulverized material, and two types of secondary cracks (coplanar and oblique), which are generated by shear (Mode II) and feature pulverized material on the failure surface.
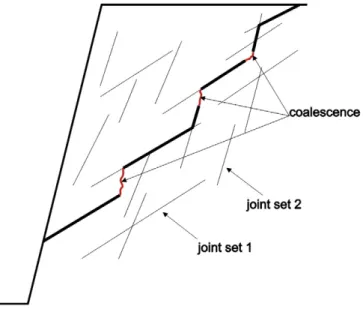
Coalescence is defined as the connection of pre-existing cracks and discontinuities in a rock material via propagation. The connection type depends on the position of the cracks and the type of propagation involved. Several authors have studied this mechanism. For example, Ghazvinian et al. (2012)analyzed the influence of the distance between two co-planar cracks in the coalescence between them using shear test results and numerical simulation using the discrete element method. Kemeny (2003, 2005)considers the time-dependent degradation of rock bridges in the same case, with analytical solutions and distinct element models.Park and Bobet (2009) reported various types of coalescence observed in a gypsite sample subjected to compression (Fig. 2).Wong and Einstein (2008)used a marble sample and studied ⁎ Corresponding author at: Departament of Civil Engineering, Catholic University of
Rio de Janeiro, Rua Marquês de São Vicente, 225, Gávea, Cep 22451-900, Rio de Janeiro, Brazil. Tel.: +55 21 3527 1188; fax: +55 21 3527 1195.
E-mail address:[email protected](E.A. Vargas).
0013-7952/$–see front matter © 2012 Elsevier B.V. All rights reserved.
http://dx.doi.org/10.1016/j.enggeo.2012.11.013
Contents lists available atSciVerse ScienceDirect
Engineering Geology
the propagation and coalescence of two parallel cracks on the macro-scopic and micromacro-scopic scales, noting that the micromacro-scopic cracks advanced by propagation through crystals in the material.Mughieda and Karasneh (2006)used a synthetic sample composed of silica, sand and cement to observe the variation of the coalescence mechanism as a function of the separation of the cracks, and they concluded that the type of coalescence depends on this separation.Vásárhelyi and Bobet (2000)used the code FROCK to study the propagation of cracks and coalescence from experimental analyses.Mughieda and Omar (2008) used thefinite element method (FEM) to determine the stress distribu-tion in a sample with two non-collinear cracks under uniaxial compres-sion. These results were compared to the results of compression tests on synthetic samples made in the laboratory. The result of this analysis shows that tensile stresses acting on the rock bridge between the two cracks causes coalescence.
on the limit equilibrium. Two main scenarios are considered in his work: coplanar and non-coplanar discontinuities (Fig. 4). In the case of coplanar fractures, their propagation would occur by shear of the rock matrix. The stability of the slope would depend on the shear strength of the discontinuities and the rock matrix that would form a planar failure surface. When the discontinuities are not coplanar, the stability of the resulting stepped surface is evaluated by an “equivalent”critical planar surface. On this“equivalent”surface, the strength of the pre-existing discontinuities and intact rock to tensile and shear stresses are considered. Other methods for evaluating the stability of step-path failures are statistical, such as the technique proposed byBaczynski (2000), which also determines the SF of a critical surface, and those ofEinstein et al. (1983)andMiller et al. (2004), which determine the probability of slope failure.
In the present study, the step-path failure mechanism is evaluated by analyzing the propagation and coalescence of cracks with the discrete element method (DEM). This method allows a rock sample or a rock mass to be represented as a set of disk-shaped particles (in the two-dimensional case) or spheres (in the three-dimensional case), which can be joined at their points of contact. Thus, a crack can be represented as the surface where there are no bonds between particles, and its propagation can be represented by the points at which bonds are broken. These analyses will be performed by sequential modeling. Initially, small-scale models (simulations of biaxial and triaxial laboratory tests) will be used to verify the types of propagation and coalescence shown byPark and Bobet (2009). After this verification, Fig. 1.Propagation of a crack subjected to compression (Park and Bobet, 2009).
large-scale models of rock slopes will be evaluated for the formation of step-path failure surfaces in two (2D) and three dimensions (3D).
In this study, the application of the DEM to this type of analysis will be evaluated by 2D modeling, in which the values of the SF obtained computationally will be compared with those provided by Jennings (1970)for the step-path scenarios illustrated inFig. 4.
The discontinuous medium representation adopted in the DEM is an important characteristic for the modeling of failure processes in rocks, but has some limitations that will be described later in this work. All models were generated with 2D and 3D PFC (particleflow code) programs (Itasca, 1999).
2. Modeling of crack propagation and coalescence with the DEM
2.1. The discrete element method
The DEM was introduced by Cundall (1979) (in Potyondy and Cundall, 2004) for analysis of rock mechanics problems, and it was later applied to soils byCundall and Strack (1979). In this method, the discrete elements can havefinite displacements and rotations, and new contacts are automatically recognized as the calculation progresses. Newton's sec-ond law is used to describe the individual motion of each element, and the interaction between elements is defined by a force-displacement law applied to each contact.
In the present study, the DEM was used to represent the behavior of rocks, as shown byPotyondy and Cundall (2004). In the bonded-particle model (BPM), a set of rigid circular (2D) or spherical (3D) particles (elements) can be bonded at their contacts. The rigid parti-cles interact only through their soft contacts, which possessfinite normal and shear stiffnesses. Bonds offinite stiffness may exist in the contacts, and they may break due to loading. The BPM simulates the behavior of a set of grains (particles) connected by a cement (bond), and their fractures are represented explicitly as broken bonds, which form and coalesce into macroscopic fractures when a load is applied.
2.2. Generation of rock samples
In the DEM, the behavior of a material is characterized by the properties of the contacts between its particles (micromechanical parameters) rather than the macroscopic properties of the rock, which are the mechanical parameters obtained from laboratory tests. Therefore, the micromechanical properties of the model should be determined by a calibration process. In this process, triaxial compres-sion tests are simulated with different confinement values for a given set of micromechanical parameters. If the results of these simulated tests do not accurately represent the macroscopic properties of the material, the micromechanical parameters are adjusted until satisfactory results are obtained.
2.3. Generation of cracks
A discontinuity can be treated as a plane offinite dimensions, which can be represented as a set of unbounded contacts located at a distance “d”from the plane. The distance of the contacts that are not bonded to the plane depends mainly on two factors: the shear strength properties of the discontinuity (a greater distance corresponds to lower strength) and the type of discontinuity to be represented (fault zones, faults with infilling material, etc.). Determining the shear strength of a fracture is problematic when discontinuities are modeled with this criterion. Be-cause the particle is considered to be rigid, the fracture cannot pass through it; consequently, the shape of the discontinuity is defined by the contour of the particles where there is no connection (bond). This restriction gives rise to an irregular surface (Fig. 5), which increases the surface roughness and leads to an increase in the shear strength parameters of the discontinuity. Increasing the unconnected contact area in the vicinity of the discontinuity plane can reduce this effect, but this solution is impractical when representing systems of disconti-nuities. Increasing the size of this region can affect the representation quality of the unitary block considered in modeling. Varying the Fig. 3.Step-path failure mechanism.
stiffness parameters of the particles whose contacts are part of the dis-continuity provides an appropriate solution (Wang et al., 2003).
The correct procedure to model a discontinuity is to determine the microscopic mechanical parameters of the particles and contacts that form the discontinuity by simulating direct shear tests. The distance used to determine the contacts that comprise the discontinuity and the stiffness of its constituent contacts and particles are modified manually until shear strength values similar to those provided by the laboratory are obtained.
2.4. Modeling of crack propagation and coalescence in the DEM
Potyondy and Cundall (2004)demonstrated the calibration proce-dure for the microscopic properties of a Lac du Bonnet granite sample. Some of the microscopic properties from these data were modified to obtain rupture of the contact by tensile forces (Table 1). These micro-scopic properties generated the set of macromicro-scopic properties shown inTable 2.
In both cases (2D and 3D), the generated sample measured 31.7×63.4 mm. For three-dimensional analysis, the depth of the sample was 31.7 mm. An open crack with an angle of 45° was inserted in the two-dimensional model, and an uniaxial compression test was simulated until 80% of the deviatoric stress at failure was reached. The result of this simulation is shown inFig. 6. The black lines correspond to contacts at which the bond remains active. Thus, zones without bonds correspond to new fractures formed by the propagation of the initially inserted crack.Fig. 6shows the development of primary wing cracks and second-ary oblique cracks, but secondsecond-ary coplanar cracks (by shear) do not appear in the model. It is possible that these cracks would appear with the progress of the simulation (i.e., for greater axial displacements).
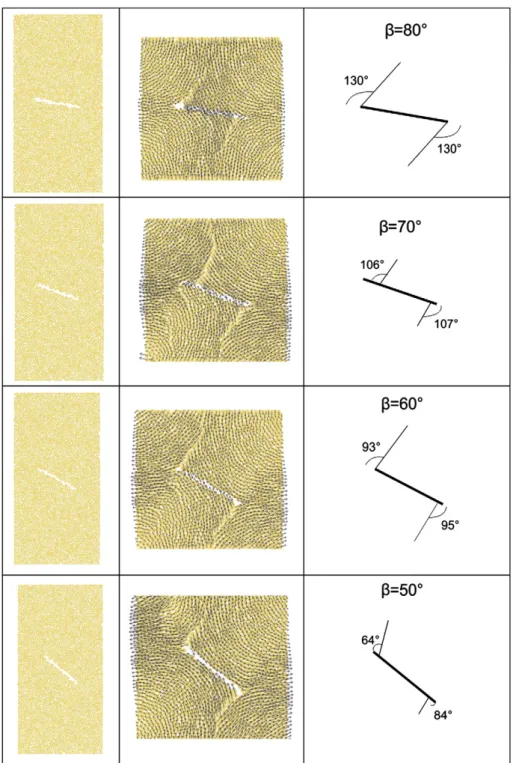
Fig. 7 shows simulation results of uniaxial compression tests (unconfined) with discontinuities inserted at different angles of inclina-tion,β. The results of these simulations showed that the initial angle of propagation varies slightly for discontinuity angles (β) between 20° and
45° and varies sharply for values greater than 45°. In general, the ends are not symmetric with respect to the initial angle of propagation. The variation of the initial angle of propagation,θm, shown inFig. 8, exhibits a trend similar to that described in the literature (Whittaker et al., 1992).
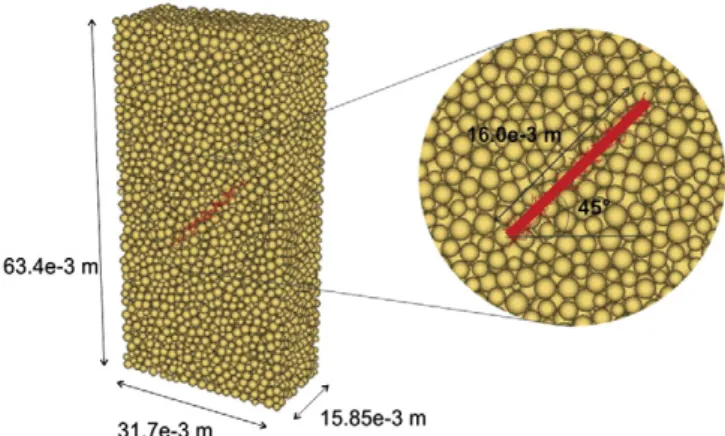
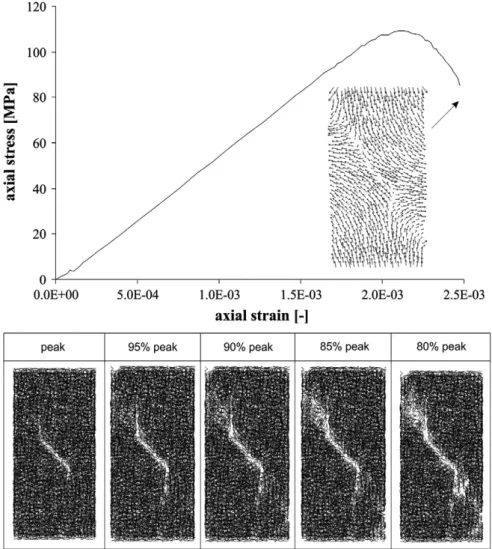
In the three-dimensional analysis, a closed crack inclined by 45° (Fig. 9) was modeled, and the sample was submitted to a triaxial test with a confining stress of 0.1 MPa. This test shows the evolution of the propagation when the axial load is increased. As shown in Fig. 10, the discontinuity propagates by tension (Mode I) until the stress applied is reduced by 10% after the peak. A coplanar secondary fracture (Mode II) develops after this point. Because of the proximity of the two propagations, the contact bonds contained in this region are broken by the high concentration of contact forces, which is a product of the high mobility of the particles. The development of secondary oblique fractures was not observed in this simulation. A visualization of the displacement vectors at thefinal instant shows that the movement of the particles was not symmetrical at that time. At the upper end of the crack, the movement of particles was largely controlled by the coplanar secondary crack, and particle movement at the bottom was mostly controlled by the primary wing crack. Thus, not all types of propagation mentioned byPark and Bobet (2009) were generated. Propagation is defined by the breakage of contact bonds, which depends on the size and distribu-tion of the particles. Smaller particles induce a better response from the model. As stated previously, the connection of two or more cracks by its propagation is called coalescence. Multiple types of coalescence are possible, and their occurrence is mainly dependent on the distance and position of the cracks and the type of propagation involved in the connection. In computational simulations, seven of the eight types of coalescence described byPark and Bobet (2009)were obtained; these possible types are illustrated inFig. 2, whileFig. 11shows the results obtained. In the type I cases, the connection between two coplanar cracks occurs by the propagation of a shear corresponding to the Fig. 5.Criterion for generating a discontinuity. a) Introduction of a line representing the discontinuity and distance“d”that determines the region where the contacts are canceled. b) Final shape of the discontinuity generated.
Table 1
Microscopic properties utilized in the samples.
PFC2D PFC3D
Radius (mm) 0.3–0.5 0.6–1.0
Dimension sample (mm) 31.7 × 63.4 31.7× 31.7 ×63.4
Density (kg/m3) 2630 2630
Ec(Pa) 62.0e9 72.0e9
kn/ks 3.5 3.5
λ 1 1
Ēc(Pa) 62.0e9 72.0e9
k−n/k−s 3.5 3.5
σc(Pa) 120.0e6 120.0e6
τc(Pa) 175.0e6 175.0e6
Table 2
Macroscopic properties obtained for the model in simulating biaxial and triaxial tests.
PFC2D PFC3D
σ3 σ1 E σ1 E
0.1 MPa 170.7 MPa 60.6 GPa 152.6 MPa 56.6 GPa 10.1 MPa 216.3 MPa 64.3 GPa 183.3 MPa 60.2 GPa 50.0 MPa 320.7 MPa 69.4 GPa 293.6 MPa 71.2 GPa
To 40.0 MPa 38.8 MPa
C 51.7 MPa 45.8 MPa
coplanar secondary crack. Starting with type II, all other cracks are not coplanar, and the connection occurs at the rock bridge between them. This connection can exhibit different combinations of primary tensile cracks and coplanar secondary cracks (from type II to type VIIb), which mainly depend on the separation between the tips of the closest cracks and the angle between the line joining these two points and the crack. Smaller values of this angle correspond to the increased tendency for the coalescence be formed by two parallel cracks. The appearance of an oblique secondary crack in type V coalescence was observed, as well as the combination of this crack with type VI primary tensile cracks. These types of oblique propagation, which were not observed in the prior models, were verified in these models by visualization of the particle displacement vectors. Type VIIb coalescence, which is formed by oblique secondary cracks, constitutes the opposite of type II, in which coalescence is formed by primary tensile cracks.
3. Modeling of the step-path failure mechanism
The mechanisms of crack propagation and coalescence observed in rock samples are also found in the development of the step-path failure mechanism. The failure surface of a slope is generated by the connection of pre-existing discontinuities in the rock mass. The shape of this failure surface depends on the persistence of the discon-tinuities, with a smaller persistence of discontinuities corresponding to greater irregularity of thefinal failure surface.Wang et al. (2003) showed this dependence using the DEM, and that the shape of the failure surface generally varies with persistence, but the different types of coalescence involved are not observed. The step-path failure mechanism has also been modeled by a combination of the DEM and thefinite element method (FEM-DEM—Stead et al., 2006), in which the material is represented by afinite element mesh and degrades in the direction of the greatest principal stress after reaching the tensile strength (Munjiza, 2004; Elmo, 2006). To model the step-path failure mechanism with the DEM, the microscopic properties indicated byWang et al. (2003), shown inTable 3, were used as input data. This set of microscopic properties gives the macroscopic properties shown inTable 4.
The geometry of the model has a rectangular shape with a length of 110 m and height of 80 m, and it is composed of 58,336 particles.
Initially, the arrangement of particles reached an equilibrium based only on the action of their own weight. The bond between the contacts was activated after this process. In a real rock mass, assuming a rock density of 2500 kg/m3, the vertical stress corresponding to a depth of 75 m would be 1.8 MPa. In an arrangement of particles, the porosity decreases the local stress. To correct this effect, the particle density is increased until vertical stress values similar to the actual or desired values are achieved. After the particle arrangement is generated, the excavation procedure is performed in steps (Fig. 12) to match the actual process in thefield.
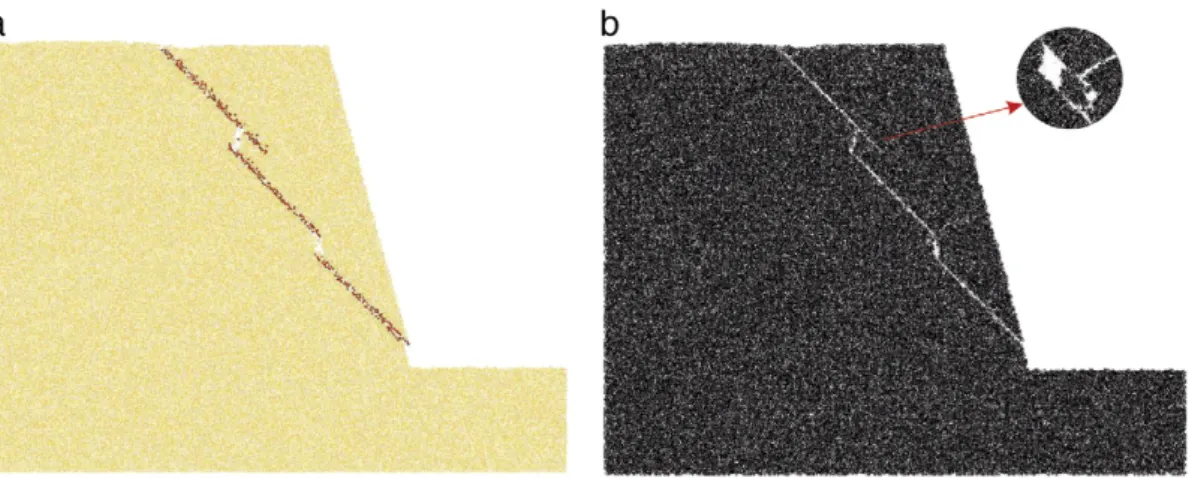
Several simulations were performed for different distributions of discontinuities, and failure was achieved in all cases, allowing obser-vation of the degree to which the DEM adequately represented the step-path failure mechanism. In the case shown inFig. 13, only one discontinuity was introduced which does not outcrop at the top of the slope. The movement of the block on the discontinuity leads to a propagation by Mode I. As the propagation evolved, the forming fracture exhibited a tendency to become vertical near the surface, as can be verified in the tension cracks on the rock slopes. In other models, the verticality of the generated crack was observed to depend on the shear strength of the discontinuity. When strength was lower, the crack tended to be vertical. For low values of the friction coeffi -cient (which led to lower shear strength), the initial angle of propaga-tion relative to the load direcpropaga-tion (vertical) was reduced.
parallel type (III). The particle size in the rock bridge influenced the differentiation of these coalescences.
The formation of a tension crack was also observed in the upper coalescence. The irregularity of the failure surface (which was depen-dent on the particle size) may have facilitated the displacement of some particles and impeded others. This differential movement of particles at the discontinuity surface generated greater contact forces at some points, leading to bond failure and subsequent propagation. The more irregular the sliding surfaces are, there is a greater chance of forming tension cracks within the sliding block.
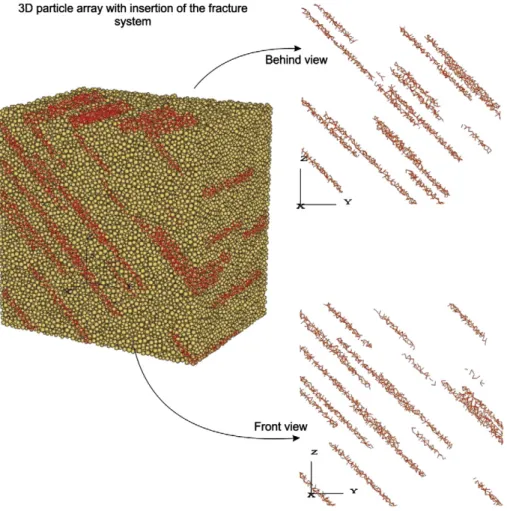
To visualize the three dimensional effect in the mechanical model of the step-path failure, an arrangement of particles measuring 30×40×
three-dimensional model shows that there are different configurations in the spatial distribution of the discontinuities within the model.
The model results, which are shown inFig. 16, contain an irregular surface that shows different combinations of associated discontinuities when viewed in sections (Fig. 17), as well as different types of propaga-tion and coalescence. These secpropaga-tions show the initial andfinal steps of the rupture process. Section No. 1 shows the step-path failure surface. The fact that the upper discontinuity does not emerge on the surface affects its propagation and leads to the formation of a tension crack. This same trend is shown in section No. 2. The difference relative to section No. 1 is that the development of a secondary coplanar crack is observed at the upper discontinuity, in combination with propagation by tension. In the middle part, the influence of another discontinuity in the section modifies the shape of the coalescence.
In section No. 3, the configuration of the structures involved in the failure is different. Coalescence occurs primarily in the middle part of the model, and the upper tension crack is not clearly visible. Section No. 4 does not exhibit tensile cracking at the top, but it continues to exhibit a step-path failure surface. The coalescence of discontinuities mainly occurs in the middle part of the model. Section No. 5 exhibits the same tendency as the previous section, however, with reduced influence of the upper discontinuity being visible, which would outcrop on the top of the model only by its own propagation in the form of primary tensile cracks and secondary coplanar cracks.
4. Evaluation of the model for the step-path failure mechanism
To compare the model with the results presented by Jennings (1970), it is necessary to determine the safety factor (SF). Because the macroscopic parameters of the DEM model are dependent on the microscopic parameters, the application of the strength reduction technique, often used in the FEM, is difficult to implement. Another method that could be used is based on increasing the acceleration of gravity, which is successively incremented until failure of the slope. By defining g0as the acceleration of gravity in the initial state and g0trialas the acceleration of gravity at failure, the safety factor can be defined as follows, according toLi et al. (2009):
SFtrial¼g
trial 0
g0 ð1Þ
Comparison with other programs, such as FlacSlope v6.0 (Itasca, 2009) and Slide v5.0 (Rocscience, 2006), shows that they produce safety factor values that are very close to those obtained by DEM for slope angles less than 75° (Mejia, 2010). Based on these comparisons, the method of increasing gravity was used to determine a safety factor
in the two-dimensional model, thereby permitting a comparison with the limit equilibrium model proposed byJennings (1970).
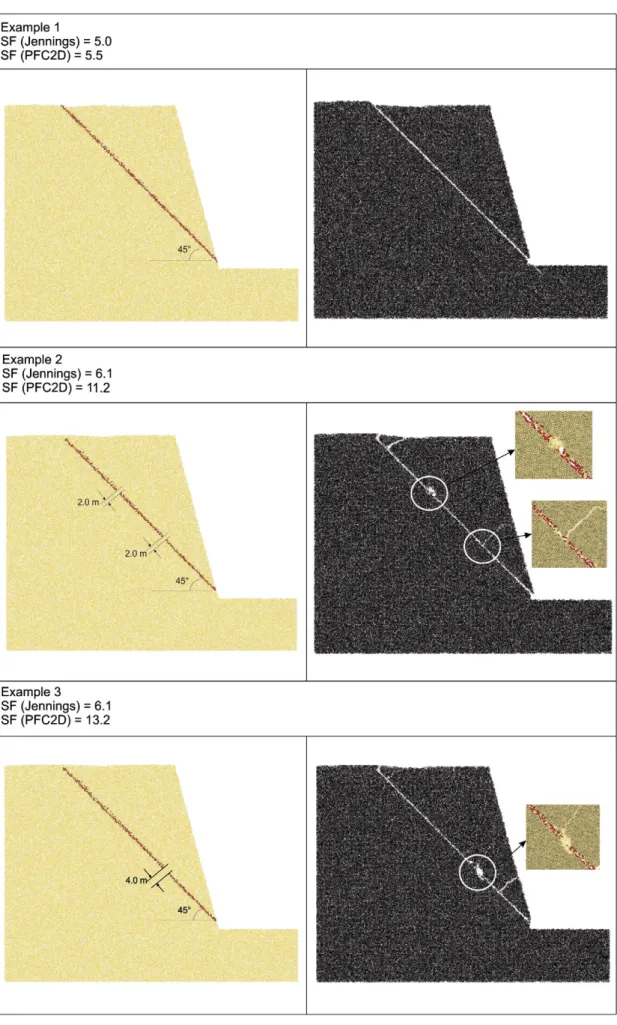
Fig. 18shows three initial examples for discussion. Example No. 1 shows a typical planar failure. In this particular case, the SF obtained by the DEM is very close to that obtained from theJennings model (1970). Thefirst step-path type, which is shown inFig. 4, for the case of coplanar discontinuities, is modeled in examples 2, 3, and 4. All of these examples produced poor approximations to the result of the limit equilibrium model. According toJennings (1970), the propagation of discontinuities through rock bridges occurs by shear, which was not observed in the model with the DEM. Tensile cracks within the sliding block were observed which could influence the computational SF value.Einstein (1993)studied this mechanism and found that, at low normal stresses, the application of a shear stress in the slide direction initially generates tensile cracks that develop at high angles relative to this direction. Simultaneously, the maximum shear strength is reached in this direction. Coalescence occurs by the union of coplanar secondary cracks. When the normal stress is high, tensile cracks are not observed, and rupture occurred by shearing the intact rock. The results obtained from the model agree with these observations.
The failure mechanism shown in these examples, proposed by Jennings (1970), occurs by the propagation and coalescence of coplanar discontinuities by shearing, and it is rarely encountered in nature. Generally, coalescence occurs because of coplanar secondary propaga-tion that develops after the primary cracks have propagated by tension. Thefirst condition proposed byJennings (1970)is present only in the case of high normal stress on the shear plane, which could occur in deep underground excavations. This could explain the differences between the results of the two methods of analysis.
The second condition considered in theJennings model (1970), also shown inFig. 4, for the case of non-coplanar discontinuities, is given in the Example No. 5 (Fig. 19). In this case, the Jennings model (1970)considers the influence of the tensile strength of the intact rock. Here, the SF values obtained from theJennings model (1970)and the DEM are closer, but the formation of a tensile crack in the upper part of the slope may be influencing the result. Example No. 6, which is essentially a variation of the previous case, also con-siders the influence of the tensile strength of the rock; consequently, the SF values are more similar.
Table 5shows the safety factor values obtained for each example. In summary, the SF given by the Jennings model is only similar to that obtained in the DEM model when the Jennings model considers the tensile strength of the intact rock. In the case of coplanar cracks (examples 2, 3, and 4), the SF values differ significantly, and disconti-nuity propagation mechanisms other than shearing are observed in the DEM model.
Fig. 8.Variation of the initial angle of propagation,θm, with the angle of inclination of
the discontinuity,β, in two-dimensional analysis.
In cases with coplanar cracks, the Jennings method appears to be quite conservative, always providing SF values that are much lower than those produced by the computational model. However, the opposite is observed in cases with non-coplanar cracks: the Jennings method is not conservative, and it provides slightly higher SF values than the computational model.
5. Conclusions
Modeling with the DEM permits the representation of cracks or discontinuities, as well as observation of their propagation when the model is subjected to external loading, allowing the processes of crack generation and coalescence to be understood.
Simulations of laboratory tests for the initial assessment of the DEM produced satisfactory results. The propagation of preexisting cracks is modeled by the failure of the contact bonds between particles; thus, the onset and evolution of propagation during the test can be observed. In general, all types of coalescence and propagation mentioned in the study byPark and Bobet (2009)were accurately reproduced.
For modeling of the step-path failure mechanism, the DEM appears to be a useful and convenient computational option for analyzing and understanding the problem. In two-dimensional modeling, the DEM produced results that agreed reasonably with the stability analysis developed from the Jennings limit equilibrium. The differences in the safety factors of examples 2, 3, and 4, which involve coplanar disconti-nuities, are caused by the formation of primary tensile cracks at the tips of these discontinuities. In these cases, coalescence is produced by
the union of secondary coplanar cracks, in contrast to the results of the Jennings model, which considers the union of coplanar discontinu-ities only by shear of the intact rock.
Modeling with the DEM confirmed the observations made by Einstein (1993), in which shear failure in portions of intact rock only occurs under conditions of high normal stress. The types of propagation and coalescence obtained in the discrete model are much more commonly observed in nature. The best approximations of the safety factor results obtained in examples No. 5 and 6 (with non-coplanar discontinuities) are related to the introduction of the tensile strength of the intact rock in the Jennings model.
It was determined that the Jennings limit equilibrium method was very conservative (favoring safety) in the case of coplanar discontinu-ities and slightly non-conservative (not favoring safety) in the case of non-coplanar discontinuities.
The lack of studies performing three-dimensional analysis of this type of failure prevented the comparison of the discrete model with other results. Three-dimensional modeling allows a more realistic study of the evaluated failure mechanism because only the three-dimensional model permits consideration of the persistence of discontinuities orthog-onal to the cross sections of the slope.
Finally, the potential of using the discrete element method to model and understand the failure mechanisms of a fractured rock slope depend on the proper calibration of the macroscopic properties of the rock mass and its discontinuities, as well as the use of a particle size that permits reproduction of all propagation and coalescence phenom-ena of its discontinuities in a reasonable computation time.
Fig. 11.Types of coalescence obtained in the computational simulations using discrete elements. The smooth lines represent tensile failure, and the rough lines represent shear failure.
Table 3
Microscopic properties of the slope arrangement.
Radius (m) 0.15–0.25
Density (kg/m3) 3100
Ec(GPa) 25.0
kn/ks 0.25
Friction 0.7
λ 1.0
Ēc(GPa) 10.0
kn/ks 0.25
σc(MPa) 40
τc(MPa) 40
Table 4
Macroscopic properties obtained from the data inTable 3.
UCS (MPa) T0(MPa) E(GPa) Friction angle Cohesion (MPa)
Fig. 12.Geometry of the slope and excavation in steps.
Fig. 13.Generation of a tension crack associated with a planar failure on the slope: a) particle arrangement; b) visualization of the contact bonds.
References
Ashby, M.F., Hallam, D., 1986. The failure of brittle solids containing small cracks under compressive stress states. Acta Metallurgica 34 (3), 497–510.
Baczynski, N.R.P., 2000. Stepsim4:“step-path”method for slope risks. International Conference on Geotechnical and Geological Engineering–Australia, 2, pp. 86–92. Cundall, P.A., Strack, O.D.L., 1979. A discrete numerical model for granular assemblies.
Geotechnique 29 (1), 47–65.
Einstein, H.H., 1993. Modern Developments in Discontinuity Analysis–The Persistence– Connectivity Problem. In: Hudson, John A. (Ed.), Comprehensive Rock Engineering: Principles, Practice & Projects. Pergamon Press, England.
Einstein, H.H., Dershowitz, W.S., 1990. Tensile and shear fracturing in predominantly compressive stressfields—a review. Engineering Geology 29, 149–172. Einstein, H.H., Veneziano, D., Baecher, G.B., O'Reilly, K.J., 1983. The effect of discontinuity
persistence on rock slope stability. Journal of Rock Mechanics and Mining Science and Geomechanics Abstracts 20 (5), 227–236.
Elmo, D., 2006. Evaluation of a hybrid FEM/DEM approach for determination of rock mass strength using a combination of discontinuity mapping and fracture mechanics modelling, with particular emphasis on modelling of jointed pillars. PhD These -University of Exeter, Exeter, Devon UK.
Ghazvinian, A., Sarfarazi, V., Schubert, W., Blumel, M., 2012. A study of the failure mechanism of planar non-persistent open joints using PFC2D. Rock Mechanics and Rock Engineeringhttp://dx.doi.org/10.1007/s00603-012-0233-2 Published online: 17 March 2012.
Hoek, E., Bray, J., 1981. Rock Slope Engineering, Revised third edition. E and FN Spon, London, UK.
Horii, H., Nemat-Nasser, S., 1985. Compression-induced microcrack growth in brittle solids: axial splitting and shear failure. Journal of Geophysical Research 90 (10), 3105–3125.
Hustrulid, W.A., McCarter, M.K., Van Zyl, D.J.A., 2000. Slope Stability in Surface Mining. Society for Mining, Metallurgy, and Exploration, Inc. (SME), Colorado, USA. ITASCA, 1999. PFC2D Theory and Background. Itasca Consulting Group, Minneapolis,
Minnesota, USA.
ITASCA, 2009. Flac/Slope User's Manual. Itasca Consulting Group, Minneapolis, Minnesota, USA.
Jennings, J., 1970. A mathematical theory for the calculation of the stability of slopes in open cast mine. Open Pit Mining Symposium, Planning Open Pit Mines. Kemeny, J., 2003. The time-dependent reduction of sliding cohesion due to rock bridges
along discontinuities: a fracture mechanics approach. Rock Mechanics and Rock Engineering 36 (1), 27–38.
Fig. 15.Three dimensional model. Particle arrangement with an inserted system of discontinuities.
Kemeny, J., 2005. Time-dependent drift degradation due to the progressive failure of rock bridges along discontinuities. Journal of Rock Mechanics and Mining Science and Geomechanics Abstracts 42, 35–46.
Li, L., Tang, C., Zhu, W., Liang, Z., 2009. Numerical analysis of slope stability based on the gravity increase method. Computers and Geotechnics 36, 1246–1258.
Mejia, L.A., 2010. Modeling Failure Mechanisms of the Step-Path Type in Fractured Rock Slopes using the Discrete Element Method. MSc dissertation (in Portuguese). Department of Civil Engineering, Catholic University, Rio de Janeiro, Brazil. Miller, S., Whyatt, J., Mchugh, E., 2004. Applications of the point estimation method for
Across Borders and Disciplines, 6th North American Rock Mechanics Conference, Houston, Texas. ARMA/NARMS (04-517).
Mughieda, O., Karasneh, I., 2006. Coalescence of offset rock joints under biaxial loading. Geotechnical and Geological Engineering 24, 985–999.
Mughieda, O., Omar, M.T., 2008. Stress analysis for rock mass failure with offset joint. Geotechnical and Geological Engineering 26, 543–552.
Munjiza, A., 2004. The Combined Finite-Discrete Element Method. John Wiley & Sons Ltd., Chichester, England.
Park, C.H., Bobet, A., 2009. Crack coalescence in specimens with open and closedflaws: a comparison. International Journal of Rock Mechanics & Mining Sciences 46, 819–829.
Potyondy, D.O., Cundall, P.A., 2004. A bonded particle model for rock. International Journal of Rock Mechanics & Mining Sciences 41, 1329–1364.
Read, J., Stacey, P., 2009. Guidelines for Open Pit Slope Design. CSIRO Publishing, Australia. Rocscience, 2006. Slide Quick Start Tutorial. Rocscience Inc., Ontario.
Sjöberg, J., 1996. Large Scale Slope Stability in Open Pit Mining—A Review. Tekniska, Sweden.
Stead, D., Eberhardt, E., Coggan, J.S., 2006. Developments in the characterization of complex rock slope deformation and failure using numerical modeling techniques. Engineering Geology 83, 217–235.
Telles, I., Vargas Jr., E., Lira, W., Martha, L., 2005. Uma Ferramenta Computacional para a Geração de Sistemas de Fraturas em Meios Rochosos. Available online:
http://www.tecgraf.puc-rio/lfm/papers/TellesINFOGEO2005.
Vásárhelyi, B., Bobet, A., 2000. Modeling of crack initiation, propagation and coalescense in uniaxial compression. Rock Mechanics and Rock Engineering 33, 119–139. Wang, C., Tannant, D., Lilly, P., 2003. Numerical analysis of the stability of heavily jointed
rock slope using PFC2D. International Journal of Rock Mechanics & Mining Sciences. 40, 415–424.
Whittaker, B., Singh, R., Sun, G., 1992. Rock Fracture Mechanics—Principles, Design and Applications. Elsevier Science Publishers, Amsterdam, The Netherlands. Wong, L., Einstein, H., 2008. Crack coalescence in molded gypsum and carrara marble:
part 1. macroscopic observations and interpretation. Rock Mechanics and Rock Engineering 42 (3), 475–511.
Table 5
Comparative table of the safety factors obtained for each example.
Example Type cfrat(Pa) ϕfrat SF(PFC2D) SF(Jennings)
1 Planar 1.1e6 33° 5.5 5.0
2 Step-path 0.5e1 35° 11.2 6.1
3 Step-path 0.5e1 35° 13.2 6.1
4 Step-path 0.5e1 35° 19.9 12.6
5 Step-path 0.5e1 35° 20.9 24.8