Evaluation of Motorcyclist’s Discomfort during Prolonged Riding Process with and without Lumbar Support
KARMEGAM KARUPPIAH1, MOHD S. SALIT2, MOHD Y. ISMAIL3, NAPSIAH ISMAIL2 and SHAMSUL B.M. TAMRIN1
1Department of Environmental and Occupational Health, Faculty of Medicine and Health Sciences, Universiti Putra Malaysia, 43400 UPM, Serdang, Selangor, Malaysia
2Department of Mechanical and Manufacturing Engineering, Universiti Putra Malaysia, 43400 UPM Serdang, Selangor, Malaysia
3School of Manufacturing Engineering, Universiti Malaysia Perlis, Kampus Kubang Gajah, 02600 Arau, Perlis, Malaysia
Manuscript received on May 9, 2011, accepted for publication on May 10, 2012
ABSTRACT
Objective: The primary aim of this study is to examine the effects of a backrest: using a prototype of a lumbar support presented in author’s earlier study on the discomfort rating of the body parts of motorcyclist. Methods: One hundred motorcyclists participated in this study, all in good physical condition and with no immediate complaint of musculoskeletal disorders. Each participant was asked to sit for 2 hours on a motorcycle in two different sessions (with and without the lumbar support) in a controlled room environment. At every 15 minutes interval the participants were required to rate their discomfort level on the Borg’s CR-10 questionnaire.
Results: The rate of discomfort level (in all body parts) decreased over time during the testing period with the prototype. In terms of the discomfort ‘break point’, participants identified low back and upper back as the most affected body parts prior to comfort changes during the testing period with the use of the prototype. Conclusions: The use of this prototype provides a protective mechanism for the motorcyclist’s musculoskeletal system, particularly the spinal column. Therefore, this prototype is capable of providing ideal posture while simultaneously enhancing the comfortability of the motorcyclist during the riding process (by reducing discomfort).
Key words: Ergonomic, Lumbar Support, Motorcyclists, Borg’s CR-10 Scale, Discomfort.
Correspondence to: Karmegam Karuppiah
E-mail: karmegam@medic.upm.edu.my INTRODUCTION
Motorcycles are recognized as an important form of transport both locally and internationally. In Malaysia, motorcycles and cars are rated as two important transportations for people’s daily activities. However, motorcycles are preferred as they are compact, agile,
consume less fuel, pass easily through congested areas (towns or cities), cheaper to buy and require less maintenance (Mclnally 2003) compared to cars. Despite these advantages, motorcycle riding is a relatively complex and risky process. Motorcyclists are exposed and vulnerable to a variety of hazards in their surroundings. Furthermore, the motorcycle itself has constraints in terms of space and poses a (Annals of the Brazilian Academy of Sciences)
complicated challenge for any motorcycle design adjustments by automobile engineers (whether comfort or safety aspects).
Motavalli and Ahmad (1993) stated that humans are mechanically designed for walking and not for sitting. This can be related to the biomechanical phenomenon (reaction of load and stresses) in the human body (Gdoutos et al. 1982). In a seated position (static), the pelvis rotates posteriorly and the lumbar lordosis flattens out, increasing pressure in the posterior aspect of the spine's disc as well as strain in the posterior passive elements of the spine (Carvalho, 2008; Callaghan and McGill 2001, Andersson et. al. 1974, Nachemson and Elfstrom 1970, Keegan and Nebraska 1953). Therefore, the intradiscal pressure in the lumbar region of the spine are greater when seated than standing (Stevens 2004, Callaghan and McGill 2001, Nachemson and Elfstrom 1970). Furthermore, sitting (static working position) and poor posture are both associated with the development of musculoskeletal disorders and discomfort in the human body (Mehta and Tewari 2000, Hartvigsen et al. 2000, Graf et al. 1995).
However, Harrison et al. (1999) stated that an ideal sitting posture can be obtained by providing a backrest, as it would reduce the stress on the lower body. The backrest provides support, which allows a seated person to transfer part of their upper-body load (even the gravity forces due to the head, arms and upper trunk) onto the lower part of the body (even to the backrest support itself), which reduces the intradiscal pressure and enhances the relaxation of the supporting back muscles (Stevens 2004, Mehta and Tewari 2000, Corlett 1989, Corlett and Eklund 1984).
In terms of ergonomic, the motorcyclists riding comfort sitting is seen as one of the important elements to be considered. Relatively to car drivers, motorcyclists are more exposed to sitting hazards during the riding process. In addition, the majority of the motorcycles seat design is not equipped with a backrest support. Therefore, the motorcyclists tend to adopt a variety of postures during their
riding process in order to balance the equilibrium of stresses in their body. Therefore, there is a need to explore motorcyclists’ fatigue (discomfort). However, a review of the literature reveals that there is very little direct research evidence or information concerning motorcyclists’ fatigue (discomfort) (Horberry et al. 2008, Haworth and Rowden 2006).
STUDY OBJECTIVES
The primary aim of this study is to examine the effects of the backrest (a prototype of the lumbar support by the author’s earlier study; Karmegam et al. 2008 in terms of the discomfort rating on the motorcyclist’s body parts. Among the objectives of this study are: 1) to determine and to verify the data distribution (mean of discomforts rating) over time periods (every 15 minutes for a total of 120 minutes); 2) to determine and to verify the discomfort ‘break point’ (Borg Scale Rating ≥ 5) and comparison between testing with and without the prototype; and 3) to compare the discomfort T- test output for the paired samples (with and without the prototype) discomfort and the classification of effect size (Cohen's, d) at the end of session (minutes).
METHODOLOGY
THE MODEL OF THE STUDY
This is a cross-sectional study with the objective of evaluating the severity of the motorcyclist’s discomfort (on their body parts) during a prolonged riding process with and without a lumbar support.
Study Location / Experimental environment
This study was conducted in a controlled room, in the Department of Mechanical Engineering, Polytechnic of Sultan Azlan Shah, Perak, Malaysia.
Study Population
i) Sampling Frame
A list of names (database) was obtained from the Students Affairs Department of Polytechnic Sultan Azlan Shah students who fulfil the inclusive criteria. ii) Sampling Unit
Students who fulfil the inclusive criteria, both male and female with age range of 18 to 24 years, participated in this study. All students voluntarily participated in this study and signed an informed consent prior to participation. Students were selected by the following criteria:
i. Respondents are motorcyclists for a motorcycle of 150cc and below.
ii. Respondents have more than one years riding experience.
iii. Normal Body Mass Index (BMI) of 18.5 – 24.5.
iv. Respondents have no history of accident or injury in the past one year.
v. Respondents have no immediate complaint of musculoskeletal disorders at the neck, head, shoulder, upper back, arms, hands, low back, buttocks, thighs, knees, calf, ankles or feet. vi. Respondents are non-smokers.
iii) Sampling Size
The sample size calculator (Naing et al. 2006) was used in this study to estimate the adequate sample size. The following formula (Daniel 1999) is used in the calculator for the sample size determination process:
n = Z
2P (1–P)
d2 (1)
where, n = sample size
Z = statistic for a level of confidence P = expected prevalence or proportion
d = precision
Thus, the following required values are used in the sample size calculator:
Level of confidence = 95% (Z=1.96)
Expected prevalence or proportion = 0.5 (Karmegam et al. 2009)
Population size (N) = 1,273 (total of registered motorcycles in PSAS in 2009).
The following information was produced by the sample size calculator based on the provided values: Sample size, n = 90 (with a finite population correction and normal approximation assumption) Precision, d = ± 0.10 (due to the limitation of resources (Naing et al. 2006))
Therefore, a total of 100 (rounded up from 90) motorcyclists were selected in this study.
iv) Sampling Method
This is a probabilistic method, that used the purposive sampling method with an inclusive criteria population. A total of 50 male and 50 female students from the polytechnic were recruited to participate in this study. The participants were all in good physical condition and with no history of musculoskeletal disorder disease or lower back pain at the time of the experiment process. The participants were also asked to refrain from heavy exercise for three days prior to the data collection process.
INSTRUMENTATION AND DATA COLLECTION TECHNIQUES
Study variables
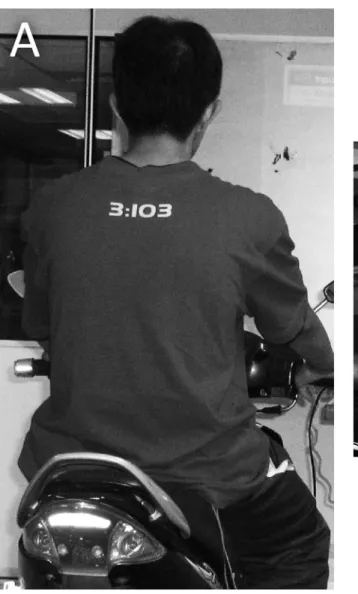
A motorcycle (less than 150cc) was used in this study. The independent variables in this study were are motorcycle with and without the lumbar support (Figure 1) and the dependent variables were the motorcyclists discomfort in body parts (neck, head, shoulder, upper back, arms, hands, low back, buttocks, thighs, knees, calf, ankles and feet).
WORKSTATION SETTING
attend experimental sessions on two different days (with a minimum three day interval between them). Each session lasted for 2 hours (Carvalho 2008, Aota et al. 2007, Gyi and Porter 1999). Meanwhile, as a means of distraction and entertainment, a movie was played during each session (Baba et al. 2009).
PREPARATION OF THE PARTICIPANTS
All participants answered a pre-survey ques tionnaire before they decided to voluntarily participate in the study. The participants also needed to undergo a physical examination (to measure height and weight). These were done in order to ensure that
the participants met the required criteria of the study. Finally, the procedure was explained and the informed consent letter was distributed.
DATA COLLECTION INSTRUMENT: QUESTIONNAIRE DESIGN (BORG SCALE MEASUREMENTS)
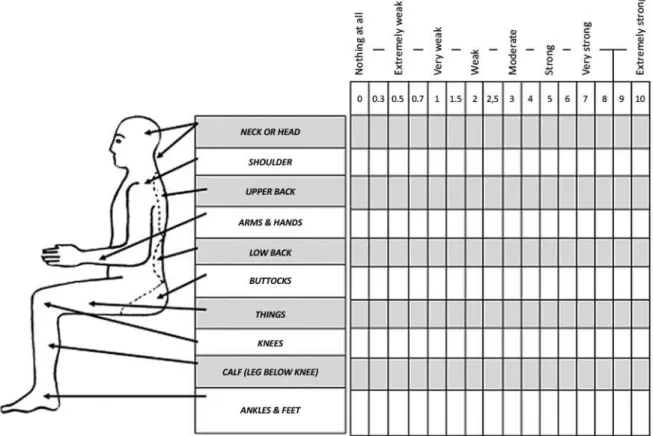
and Feizhou 2001, Motavalli and Ahmad 1993, Bishu et al. 1991). Therefore, a questionnaire was used to collect data within the scope of this study, which was adapted from the previous research by Lusted et al. (1994), Koleini et al. (2008), Falou et al. (2003) and Borg (1998). There were two parts in the questionnaire. The first part was to determine the personal information of the motorcyclists participating the study. In the second part, a body chart of discomfort using the Borg’s CR-10 scale (with numbers supported by written expression) was used to assess the degree of subjective discomfort on the body parts (Table I and Figure 2).
DATA COLLECTION TECHNIQUES
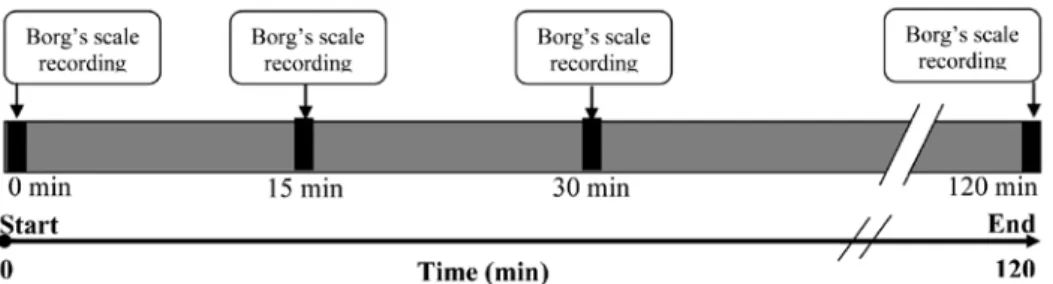
The participants were required to sit on the static motorcycle in a controlled room environment. The duration of the testing was 2 hours. At 15 minute intervals, participants were required to evaluate
their discomfort level on the Borg’s CR-10 questionnaire (Figure 3). There were two sessions for the testing, the first without the lumbar support and the second with the lumbar support.
DATA ANALYSIS
The collected data was analysed by using the univariate and bivariate analyses. All the variables were analysed using the statistical computer software (Statistical Package Service and Solution – SPSS). This study was conducted using 95% confidence level and a standard deviation of α≤0.05, in which the results of p≤0.05 were considered significant.
Determination of data distribution
The normality test (Shapiro-Wilk One Sample Test) was used to determine the normality distributions of
each variable in this study before carrying out further statistical analysis. The results showed that although there was no normality significant (p>0.05), the respective variable’s skewness distribution was at ±2. Therefore, the data are in normal distribution skewness with either a shift to the right or to the left side of the distribution curve. Thus, the data distributions are assumed to be in normal distribution and the parametric test was conducted.
RESULTS
CHARACTERISTICS OF PARTICIPANTS
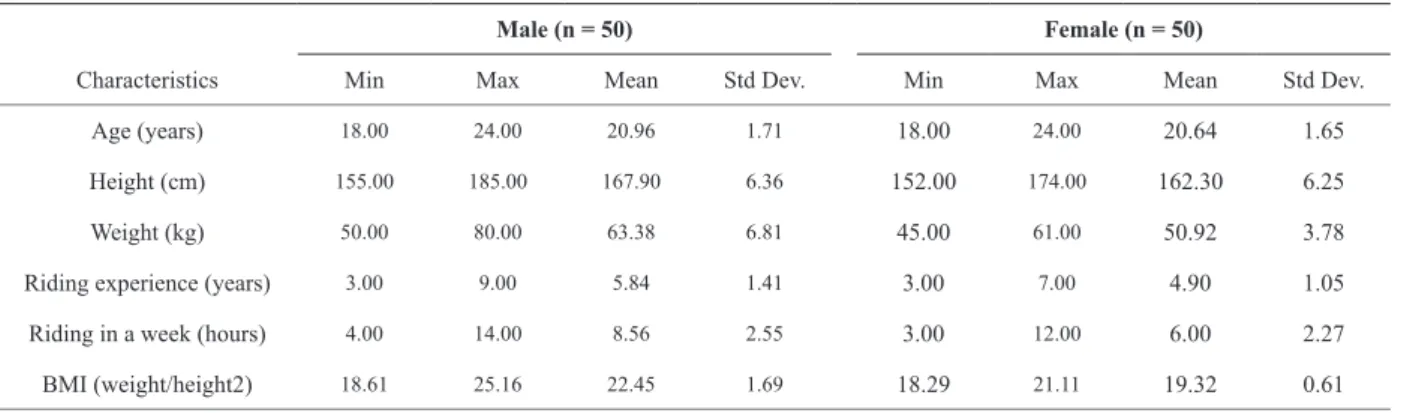
The characteristics of the participants are presented in Table II. A total of 50 males and 50 females participated in this study. Their age ranged from 18 to 24 years. The means for height were 167.90 cm and 162.30 cm, respectively, for males and females. The riding experience for male motorcyclists Figure 3 - Schematic schedule of measurement including: 1) The total period of time; 2) Borg’s scale
recording at every 15 min time period.
Scale Scale Rating Perceived exertion Note
0 Nothing at all Subjects don’t feel any exertion whatsoever, e.g. no muscle
fatigue, no breathlessness or difficulties breathing
0.3
0.5 Extremely weak Just noticeable 0.7
1 Very weak Very light. As taking a short walk at your own pace. 1.5
2 Weak Light
2.5
3 Moderate Is somewhat but not especially hard. It feels good and not
difficult to go on.
4
5 Strong Heavy
The work is hard and tiring, but continuing not terribly difficult. The effort and exertion is about half as intense as ‘Maximal’
6
7 Very Strong Is quite strenuous. Subject can go on, but really have to push himself/herself and are very tired.
8
9
10 Extreme strong Maximal An extremely strenuous level. For most subjects this is the most strenuous exertion they have ever experienced. TABLE I
ranged from 3 to 9 years with a mean of 5.84 and standard deviation of 1.41 years, while, the riding experience for female motorcyclists ranged from 3 to 7 years with a mean of 4.90 years and standard deviation of 1.05 years.
DISCOMFORT RATING SYMPTOMS EXPERIENCED BY THE
MOTORCYCLISTS
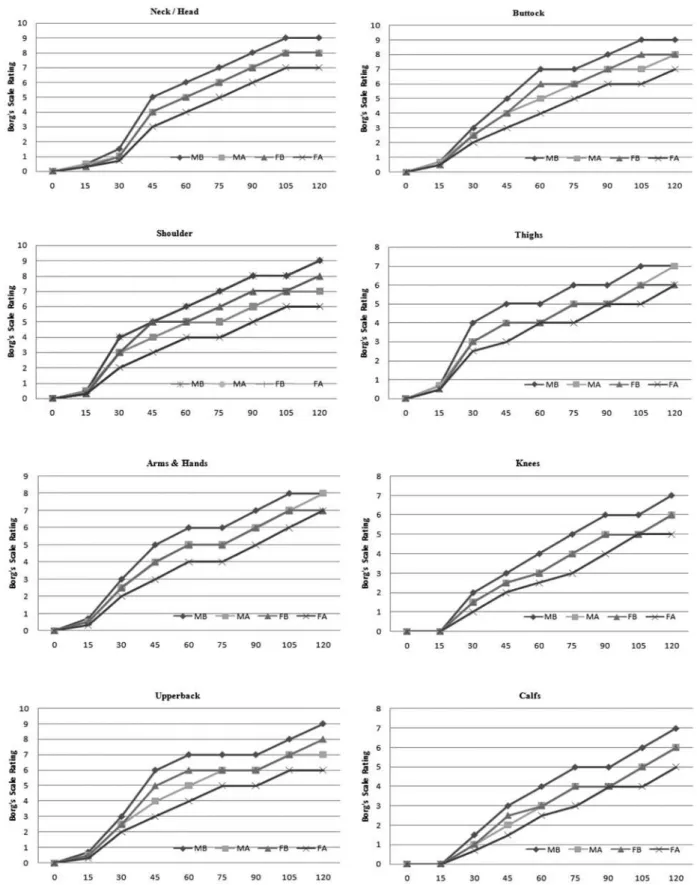
The results of the Borg’s scale on discomfort rating by the motorcyclists (participants) are presented in Appendix A and Appendix B. Meanwhile, Figure 4 represents the data in graph form. It represents the rating of discomfort level on each of their body parts during the 2 hours testing with and without the prototype (lumbar support). The results indicate that the male and female motorcyclists do experience discomfort symptoms on their body parts during the testing process. The results also highlight that the motorcyclist’s discomfort rating on their body parts reduced when tested with the lumbar support prototype (based on the comparison of the graph line with and without support on each body part in Figure 4). This indicates that providing support to the low back, could reduce the discomfort on the body parts of motorcyclists during the riding process, or, in other words, there is a prolonged (delay) in the onset time of discomfort when using the prototype. Generally, the whole body discomfort levels increase
as the riding period increases. However, the rate of increase is higher during the experimental period without the use of the prototype (lumbar support).
DISCOMFORT ‘BREAK POINT’ DATA DISTRIBUTION (BORG
SCALE RATING ≥ 5)
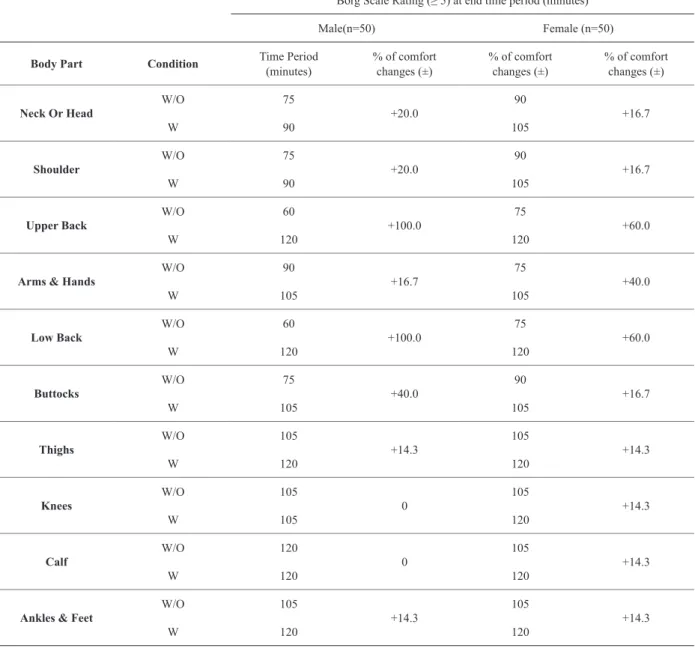
The Borg Scale Rating (≥ 5) is considered as the ‘break point’ or, in other words, as the point where the participants rated their discomfort as strong. Thus, in this study, this point was considered as the point where the participants started to feel the discomfort in their relevant body parts. The results of this discomfort ‘break point’ with and without the lumbar support prototype are shown in Table III.
The results indicated that there is a positive effect on the body part’s comfort with the usage of the lumbar support prototype. The highest comfort changes in male participants were seen in the low back and upper back, both recorded +100% changes with the usage of the lumbar support prototype. Similarly, the female participants also recorded the highest comfort changes in low back and upper back with +60.0% changes, respectively.
Meanwhile, the results also highlight that there was no (0%) change in the knees and calves among the male participants. However, there was a +14.3% change for the similar body parts in the female participants.
Male (n = 50) Female (n = 50)
Characteristics Min Max Mean Std Dev. Min Max Mean Std Dev.
Age (years) 18.00 24.00 20.96 1.71 18.00 24.00 20.64 1.65
Height (cm) 155.00 185.00 167.90 6.36 152.00 174.00 162.30 6.25
Weight (kg) 50.00 80.00 63.38 6.81 45.00 61.00 50.92 3.78
Riding experience (years) 3.00 9.00 5.84 1.41 3.00 7.00 4.90 1.05
Riding in a week (hours) 4.00 14.00 8.56 2.55 3.00 12.00 6.00 2.27
BMI (weight/height2) 18.61 25.16 22.45 1.69 18.29 21.11 19.32 0.61 TABLE II
Figure 4 - Borg’s Scale Discomfort Rating (on body parts) for male and female
The results also show that by using the lumbar support, there was a higher comfort change in the upper back, low back and buttock (+40.0% to +100%) of male participants compared to the female participants. In the similar context, the female participants indicated higher comfort changes in their arms and hands, knees and calf (+14.3% to 40.0%) when compared to their counterparts.
COMPARISON OF DISCOMFORT BETWEEN (WITH AND WITHOUT
LUMBAR SUPPORT) CLASSIFICATION OF EFFECT SIZE
The paired t-test was conducted in order to determine whether there is a statistically significant difference between male and female motorcyclists regarding their reported discomfort symptoms when tested with and without the prototype (lumbar support)
Borg Scale Rating (≥ 5) at end time period (minutes)
Male(n=50) Female (n=50)
Body Part Condition Time Period (minutes)
% of comfort changes (±)
% of comfort changes (±)
% of comfort changes (±)
Neck Or Head W/O 75 +20.0
90
+16.7
W 90 105
Shoulder W/O 75 +20.0
90
+16.7
W 90 105
Upper Back W/O 60 +100.0
75
+60.0
W 120 120
Arms & Hands W/O 90 +16.7
75
+40.0
W 105 105
Low Back W/O 60 +100.0
75
+60.0
W 120 120
Buttocks W/O 75 +40.0
90
+16.7
W 105 105
Thighs W/O 105 +14.3
105
+14.3
W 120 120
Knees W/O 105 0
105
+14.3
W 105 120
Calf
W/O 120
0
105
+14.3
W 120 120
Ankles & Feet W/O 105 +14.3
105
+14.3
W 120 120
TABLE III
Discomfort ‘Break Point’ data distribution (Borg Scale Rating ≥ 5).
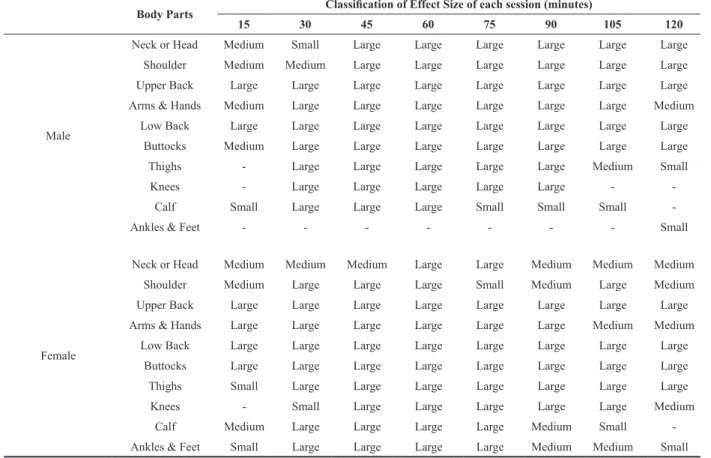
(Appendix C and Appendix D). Based on the significant results, the effect size (Cohen’s, D) was calculated (Table IV). The Cohen’s (D) is defined as the difference between the means divided by standard deviation (Cohen 1988, Kinnear and Colin 2006) and represents the strength of the relationship between two variables (small: 0-0.2, medium: 0.5-0.7 and large: 0.8-2.0).
The results of the paired t-test indicate that there was a higher of significant on male and female body part’s with the usage of the lumbar support prototype. However, the results also indicate that there was less significance of the lumbar support on ankles and feet of the male participants.
The observed pattern of the Cohen’s effect size (based on the paired t-test significant results) during the testing period are categorized into 4 groups
Group 1: Large effect size;
Group 2: Small/Medium to Large effect size; Group 3: Large to Small/Medium effect size; Group 4: Irregular effect size (small/medium/ large to small/medium/large);
The Cohen effect size results indicate that the majority of the large effect (Group 1) was seen on the upper back, low back and buttocks of males and females during the testing period. The large effect size indicates that the lumbar support did provide comfort during the 2 hours testing period on the relevant body parts. The Group 2 (small/medium to large effect size) pattern was observed in the neck/head and shoulders of the males and thighs of the females. This (small/ medium to large effect size) indicates that the rate (significant) of comfort on these body parts increased during the testing process. However, in contrast to this group, Group 3 indicates that the rate (significant) of comfort decreasesed during the testing process. This was observed on the male’s thighs and female’s arms & hands. Meanwhile, Group 4 (irregular effect size) was observed on males (arms & hands and calf) and females (neck or head, shoulder, knees, calf and ankles & feet) body parts.
DISCUSSION
Previous studies have shown the importance of a back rest and its effects (biomechanical) on the human spine during sitting (Carcone and Keir 2007, Lehman, 2004, Goonetilleke and Feizhou 2001, Roy et al. 1989). It is also considered as one of the important elements for car drivers’ comfort in terms of safety and comfortable driving in the automotive industry (Na et al. 2005, Yamazaki 1992). However, there is little literature that has documented the development of research based on motorcyclist’s discomfort during the riding process. Therefore, this is one of the first studies to examine the effects of a backrest (lumbar support) on motorcyclists discomfort (on body parts) during the process of prolonged riding (2 hours).
Generally, the results show that the rate of discomfort level (on all body parts) decreases over time during the testing period with the prototype (lumbar support) when compared with testing without the support. This indicates that the lumbar support (prototype) does have a positive effect on all the motorcyclist’s body parts. Previous studies have also shown that there is some relationship between the low back and other body parts discomfort (Daraiseh et al. 2010, Joubert and London 2007, Na et al. 2005, Gyi and Porter 1998). Thus, similar to the role of a chair backrest, it is capable of easing the stresses exerted on the vertebral column by relaxing the erector spine musculature, while maintaining lumbar lordosis as well as increasing comfortability (Carcone and Keir 2007, Corlett 2006, Corlett and Eklund 1984). Reducing the energy required to maintain an upright riding position is important for motorcyclists as this will help maximize riding comfort, duration and safety.
Body Parts Classification of Effect Size of each session (minutes)
15 30 45 60 75 90 105 120
Male
Neck or Head Medium Small Large Large Large Large Large Large
Shoulder Medium Medium Large Large Large Large Large Large
Upper Back Large Large Large Large Large Large Large Large
Arms & Hands Medium Large Large Large Large Large Large Medium
Low Back Large Large Large Large Large Large Large Large
Buttocks Medium Large Large Large Large Large Large Large
Thighs - Large Large Large Large Large Medium Small
Knees - Large Large Large Large Large -
-Calf Small Large Large Large Small Small Small
-Ankles & Feet - - - Small
Female
Neck or Head Medium Medium Medium Large Large Medium Medium Medium
Shoulder Medium Large Large Large Small Medium Large Medium
Upper Back Large Large Large Large Large Large Large Large
Arms & Hands Large Large Large Large Large Large Medium Medium
Low Back Large Large Large Large Large Large Large Large
Buttocks Large Large Large Large Large Large Large Large
Thighs Small Large Large Large Large Large Large Large
Knees - Small Large Large Large Large Large Medium
Calf Medium Large Large Large Large Medium Small
-Ankles & Feet Small Large Large Large Large Medium Medium Small TABLE IV
Classification of Effect Size, Cohen's, d at end of session (minutes) based on paired t-test results.
Note: Effect size (d) classification; Small (0.20 to 0.50), Medium (0.50 to 0.80) and Large (0.80 and higher).
to the lumbar support (prototype) functions. Motorcyclists sitting with the lumbar support were able to tilt their mid and upper back posteriorly. This action will reduce the backward rotation of the pelvis and minimizing the kyphosis of the lumbar spine (Carvalho 2008, Dolan et al. 1988). Meanwhile, from the biomechanical perspective, the lumbar support is capable of providing support to a portion of the motorcyclists’ weight during the riding process and enhances the centre of gravity (Bridger 1991) of the upper back over the lumbar spine. This allows the gravity force (from upper back) to be transferred to the lumbar support via the low back and, therefore minimizes the counteraction (localized muscle fatigue) by the back muscles (Tanaka et al. 2002, Gdoutos
et al. 1982). These sustained muscle contractions are externally associated with not being able to maintain a certain force, and lead to physiological fatigue, tremor or pain, localized in the specific muscle (Balasubramanian and Jayaraman 2009).
Zhang 1997), especially on relevant body parts (upper back, low back and buttocks). However, the results also indicate that there was some irregular (opposite) Cohen’s effect size on other body parts on male and female participants. These findings are similar with previous studies, which reported that there is a gender difference in the human body discomfort symptoms (or pain) (Fillingim et al. 1998, 2009, Carvalho 2008, Aloisi 1997). Meanwhile, Berkley et al. (2002) stated that factors that are likely to contribute to gender differences in discomfort (pain) include differences in genetics, organ physiology, body structure, neuroactive agents, sex steroid hormones, central nervous system function, stress, lifestyle, sociocultural roles, and changes across the life span.
CONCLUSION
This study was carried out with the intention of examining the effects of the backrest (using a prototype of the lumbar support from the author’s earlier study (Karmegam et. al. 2008)) in terms of the discomfort rating on the motorcyclist’s body parts. The main conclusions based on the statistically significant findings are as follows:
The rate of discomfort level (in all body parts) decreases over time during the testing period with the prototype (lumbar support).
In terms of the discomfort ‘break point’, both male and female participants recorded low back and upper back as the body parts that had the highest comfort changes during testing with the prototype (lumbar support).
The large effect size (Cohen’s effect size based on the paired t-test) for both males and females was reported on upper back, low back and buttocks.
In general, this study has provided new insights into the effects of lumbar support on motorcyclists during the process of prolonged
riding. The use of lumbar support (prototype) has provided a protective mechanism (provides postural stability and integrity) for the motorcyclist’s musculoskeletal system, particularly the spinal column. Motorcyclists’ riding posture is also related to both comfort and discomfort during the riding process. Therefore, this prototype (lumbar support) is capable of providing an ideal posture and enhances the comfortability of motorcyclists during the riding process.
RESUMO
Objetivo: O objetivo principal deste estudo é analisar
os efeitos de um encosto, usando um protótipo de um
apoio lombar apresentado em estudo anterior do autor sobre a avaliação de desconforto das partes do corpo
do motociclista.
Métodos: Cem motociclistas participaram neste estudo,
todos em boas condições físicas e sem queixa imediata de lesões músculo-esqueléticas. Cada participante foi
convidado a se sentar por 2 horas em uma moto em duas
sessões diferentes (com e sem o apoio lombar) em uma sala com ambiente controlado. A cada intervalo de 15 minutos, os participantes foram solicitados a classificar o seu nível de desconforto no questionário de Borg CR-10. Resultados: A taxa de nível de desconforto (em todas as
partes do corpo) diminuiu ao longo do tempo durante o
período de testes com o protótipo. Em termos de "ponto de ruptura" do desconforto, os participantes identificaram as partes lombar e superior das costas como as mais
afetadas do corpo, antes das alterações de conforto
durante o período de teste, com o uso do protótipo. Conclusões: O uso deste protótipo fornece um
mecanismo de proteção para o sistema
músculo-esquelético do motociclista, principalmente a coluna
vertebral. Portanto, este protótipo é capaz de proporcionar
a postura ideal, simultaneamente melhorando o conforto do motociclista, enquanto está pilotando a moto
(reduzindo o desconforto) durante o seu uso.
Palavras-chave: ergonomia lombar, apoio,
REFERENCES
ALOISI AM.1997. Sex differences in pain-induced effects on the septo-hippocampal system. Brain Res 25: 397-406. ANDERSSON BJG, ORTENGREN R, NACHEMSON A AND
ELFSTROM G.1974. Lumbar disc pressure and myolectric
back muscle activity during sitting. IV studies on a car driver’s seat. Scan J Rehabil Med 6(3): 128-133.
AOTA Y, IIZUKA H, ISHIGE Y, MOCHIDA T, YOSHIHISA T, UESUGI M AND SITO T.2007. Effectiveness of a lumbat support continuous passive motion device in the
prevention of low back pain during prolonged sitting.
Spine 32(23): E647-E677.
BABA MD,DIAN DID AND JAILAINI MMR.2009. Evaluation
of car seat using reliable and valid vehicle seat discomfort survey. IEMS 8(2): 121-130.
BALASUBRAMANIAN V AND JAYARAMAN S. 2009. Surface
EMG based muscle activity analysis for aerobic cyclist. J Bodyw Mov Ther13: 34-42.
BERKLEY KJ,HOFFMAN GE,MURPHY AZ AND HOLDCROFT A. 2002. Pain: Sex/Gender differences. Hormon Behav 5: 409-422.
BISHU RR, HALLBECK MS, RILEY MW AND STENTZ TL.
1991. Seating comfort and its relationship to spinal profile:
A pilot study. Int J Ind Ergonom 8(1): 89-101.
BORG G.1998. Borg’s perceived exertion and pain scales,
Illinois: Human Kinetics Publishers, Champaign, 49 p.
BRIDGER RS. 1991. Some fundamental aspects of posture
related to ergonomics. Int J Ind Ergonom 8: 3-15.
CALLAGHAN JP AND MCGILL SM. 2001. Low back joint loading and kinematics during standing and unsupported
sitting. Ergonomics 44(3): 280-294.
CARCONE SM AND KEIR PJ.2007. Effects of backrest design
on biomechanics and comfort during seated work. Appl Ergon 38: 755-764.
CARVALHO DED.2008. Time varying gender and passive tissue responses to prolong driving. MSc Thesis, University
of Waterloo, Canada.
COHEN J.1988. Statistical power analysis for the behavioral sciences. 2nd ed.,. Hillsdale, NJ: Lawrence Earlbaum Associates.
CORLETT EN.1989. Aspects of the evaluation of industrial seating. The Ergonomic Society lecture presented to the Annual Conference at the University of Reading, 3-7
April 1988. Ergonomics 2: 257-269.
CORLETT EN.2006. Background to sitting at work:
Research-based requirements for the design of work seats. Ergonomics 49(14): 1538-1546.
CORLETT EN AND EKLUND JAE.1984. How does a backrest
work? Appl Ergon 15: 111-114.
DANIEL WW.(1999). Biostatistics: A Foundation for Analysis
in the Health Sciences. 7th ed., New York: J Wiley & Sons. DARAISEH NM, CRONIN SN, DAVIS LS, SHELL RL AND KARWOWSKI W. 2010. Low back symptoms among hospital nurses, associations to individual factors and pain
in multiple body regions. Int J Ind Ergonom 40: 19-24.
DOLAN P,ADAMS MA AND HUTTON WC.1988. Commonly
adopted postures and their effect on the lumbar spine.
Spine 13: 197-201.
FALOU WE,DUCHENE J,GRABISCH M,HEWSON D, LANGERON
Y AND LINO F. 2003. Evaluation of driver discomfort during long-duration car driving. Appl Ergon 34: 249-255.
FILLINGIM RB,KING CD,DASILVA MCR,WILLIAMS BR AND
RILEY JL.2009. Sex, Gender, and Pain: A Review of
Recent Clinical and Experimental Findings. The J of Pain 10(5): 447-485.
FILLINGIM RB,MAIXNER W,KINCAID S AND SILVA. 1998. Sex
differences in temporal summation but not sensory-discriminative processing of thermal pain. Pain 75: 121-127.
GDOUTOS EE, RAFTOPOULOS DD AND BARIL JD. 1982. A
critical review of the biomechanical stress analysis of the human femur. Biomaterials 3: 1-8.
GOONETILLEKE RS AND FEIZHOU S.2001. A methodology to determine the optimum seat depth. Int J Ind Ergonom 27: 207-217.
GRAF M, GUGGENBUHL U AND KRUEGER H. 1995. An
assessment of seated activity and postures at five workplaces. Int J Ind Ergonom 15: 81-90.
GYI DE AND PORTER JM.1998. Musculoskeletal problems and
driving in police officers. Occup Med 48(3): 153-160.
GYI DE AND PORTER JM.1999. Interface pressure and the pre-diction of a car seat discomfort. Appl Ergon 30: 99-107.
HARRISON DD,HARRISON SO,CROFT AC,HARRISON DE AND
TROYANOVICH SJ. 1999. Sitting Biomechanics Part I:
Review of the Literature. J Manip Physiol Ther 22(9): 594-608.
HARTVIGSEN J,LEBOEUF-YDE C,LINGS S AND CORDER EH.
2000. Is Sitting-While-At- Work Associated with Low
Back Pain? A Systematic, Critical Literature Review. Scan J Public Healt 28: 230-239.
HAWORTH N AND ROWDEN P. 2006. Fatigue in motorcycle
crashes. Is there an issue?. In Proceedings Australasian Road Safety Research, Policing and Education Conference,
Gold Coast, Queensland, Australia.
HELANDER GM AND ZHANG L. 1997. Field studies of comfort
and discomfort in sitting. Ergonomics 40(9): 895-915. HORBERRY T,HUTCHINS R AND TONG R.2008. Road Safety
Research Report. 79: Motorcycle Rider Fatigue: A Review. Department for Transport: London.
JOUBERT DM AND LONDON L.2007. A cross-sectional study
of back belt use and low back pain amongst forklift
drivers. Int J Ind Ergonom 37(6): 505-513.
KARMEGAM K,ISMAIL MY,SAPUAN SM AND ISMAIL N. 2008.
Conceptual design and prototype of an ergonomic back-leaning posture support for motorbike riders. J Sci Ind Res
India 67: 599-604.
KARMEGAM K, ISMAIL MY, SAPUAN SM, ISMAIL N, SHAMSUL BAHRIB MT,SHUIB S AND SEETHA P.2009. A
study on motorcyclist’s riding discomfort in Malaysia.
EJUM 4: 39-46.
KEEGAN JJ AND NEBRASKA O. 1953. Alterations of the
KINNEAR PR AND COLIN DG.2006. SPSS 14 Made Simple.
Psychology Press, Hove and New York.
KOLEINI NM,SHIMOMURA Y,IWANAGA K AND KATSUURA T.
2008. Effects of strap support in a hand-held device on
the muscular activity in female workers assessed by electromyography and subjective rating. Ergonomics 52(7): 848-859.
LEHMAN GJ. 2004. Biomechanical assessments of lumbar
spinal function. How low back pain sufferers differ from
normals. Implications for outcome measures Research.
Part I: Kinematic assessments of lumbar function. J Manip Physiol Ther 27: 57-62.
LUSTED M,HEALEY S AND MANDRYK JA.1994. Evaluation
of the seating of Qantas flight deck crew. Appl Ergon 25(5): 275-282.
MCLNALLY S.2003. R3-Riding strategy formulation model for risk adverse motorcyclists. In: Contemporary Ergonomics
2003: Taylors and Francis Group, p. 423-428.
MEHTA CR AND TEWARI VK.2000. Seating discomfort for
tractor operators – a critical review. Int J Ind Ergonom
25: 661-674.
MOTAVALLI S AND AHMAD F.1993. Measurement of Seating Comfort. Comput Ind Eng 25(1-4): 419-422.
NA S,LIM S,CHOI HS AND CHUNG MK.2005. Evaluation of
driver’s discomfort and postural change using dynamic body pressure distribution. Int J. Ind Ergonom 35: 1085-1096.
NACHEMSON A AND ELFSTROM G.1970. Intravital Dynamic
Pressure Measurements in Lumbar Discs. A Study of
Common Movements, Maneuvers and Exercises. Scand J
Rehabil Med 1(Suppl): 1-40.
NAING L,WINN T AND RUSLI BN.2006. Practical Issues in
Calculating the Sample Size for Prevalence Studies. Arch
Orofac Sci 1: 9-14.
ROY SH,LUCA CJD AND CASAVANT DA.1989. Lumbar muscle
fatigue and chronic lower back pain. Spine 14: 992-1001.
STEVENS EM. 2004. Design Guidelines and Evaluation of
an Ergonomic Chair Feature Capable of Providing Support to Forward-Leaning Postures, PhD Thesis, Texas A&M University, USA.
TANAKA TH,LEISMAN G,MORI H AND NISHIJO K.2002. The
effect of massage on localized lumbar muscle fatigue.
BMC Complementary and Alternative Medicine 2:9.
(This article is available from: http://www.biomedcentral. com/1472-6882/2/9).
YAMAZAKI N. 1992. Analysis of sitting comfortability of
Appendix A
Rating on body parts discomfort/fatigue by motorcyclists (Male, n=50).
Borg Scale Rating at end of each time period (minutes)
Body Part Condition 0 15 30 45 60 75 90 105 120
Neck Or
Head
W/O 0 0.2 ± 0.1 (0-0.3)
0.9 ± 0.2 (0.7-1.0)
4.5± 0.6 (3.0-5.0)
4.5± 0.6 (3.0-5.0)
5.6 ± 0.5 (5.0-6.0)
6.6 ± 0.5 (6.0-7.0)
7.5 ± 0.6
(6.0-8.0) 7.7 ± 0.5 (7.0-8.0)
W 0 0.1 ± 0.1
(0-0.3)
0.8 ± 0.2
(0.4-1.0)
3.8 ± 0.5
(2.5-5.0)
3.8 ± 0.5
(2.5-5.0)
4.7 ± 0.5 (4.0-6.0)
5.6 ± 0.5 (5.0-7.0)
6.6 ± 0.5 (6.0-7.0)
6.8 ± 0.6 (6.0-8.0)
Shoulder
W/O 0 0.3 ± 0.1 (0.3-0.5)
2.7 ± 0.3 (2.0-3.0)
4.7 ± 0.5 (4.0-5.0)
4.7 ± 0.5 (4.0-5.0)
5.8 ± 0.4
(5.0-6.0)
6.7 ± 0.4 (6.0-7.0)
7.0 ± 0.7
(6.0-8.0) 7.8 ± 0.6 (7.0-9.0)
W 0 0.2 ± 0.1
(0-0.5)
2.3 ± 0.4 (1.5-3.0)
4.1 ± 0.5 (3.0-5.0)
4.1 ± 0.5 (3.0-5.0)
4.5 ± 0.5 (4.0-5.0)
5.3 ± 0.5 (5.0-6.0)
5.6 ± 0.5 (5.0-6.0)
6.5 ± 0.5 (6.0-7.0)
Upper Back
W/O 0 0.5 ± 0.1 (0.3-0.7)
2.3 ± 0.6 (1.0-3.0)
5.1 ± 0.8
(4.0-6.0)
5.1 ± 0.8
(4.0-6.0)
5.4 ± 0.5 (4.0-6.0)
5.8 ± 0.4
(5.0-6.0)
7.0 ± 0.7
(6.0-8.0) 7.5 ± 0.7 (7.0-9.0)
W 0 0.2 ± 0.1
(0-0.5)
0.7 ± 0.2 (0.3-1.0)
1.6 ± 0.4 (1.0-2.5)
1.6 ± 0.4 (1.0-2.5)
2.1 ± 0.4 (1.5-3.0)
3.0 ± 0.3 (2.5-4.0)
3.9 ± 0.5 (3.0-5.0)
4.9 ± 0.5 (4.0-6.0)
Arms & Hands
W/O 0 0.3 ± 0
(0.3-0.5)
2.1 ± 0.4 (1.5-3.0)
4.0 ± 0.6 (3.0-5.0)
4.0 ± 0.6 (3.0-5.0)
4.5 ± 0.5 (4.0-6.0)
5.5 ± 0.5 (5.0-6.0)
6.5 ± 0.5
(6.0-8.0) 7.2 ± 0.5 (6.0-8.0)
W 0 0.2 ± 0.1
(0-0.3)
0.8 ± 0.2
(0.3-1.0)
2.7 ± 0.5 (1.5-4.0)
2.7 ± 0.5 (1.5-4.0)
3.6 ± 0.6 (2.5-5.0)
4.6 ± 0.6 (3.0-6.0)
5.6 ± 0.6 (4.0-7.0)
6.6 ± 0.6
(5.0-8.0)
Low Back
W/O 0 0.5 ± 0.1 (0.3-0.7)
2.5 ± 0.4 (2.0-3.0)
5.5 ± 0.9 (4.0-7.0)
5.5 ± 0.9 (4.0-7.0)
6.3 ± 0.6
(6.0-8.0) 7.2 ± 0.4 (7.0-8.0) 7.6 ± 0.7 (7.0-9.0)
8.3 ± 0.5 (8.0-9.0)
W 0 0.1 ± 0.1
(0-0.3)
0.3 ± 0.1 (0.3-0.5)
1.2 ± 0.2 (1.0-1.5)
1.2 ± 0.2 (1.0-1.5)
2.6 ± 0.4 (2.0-3.0)
3.8 ± 0.7
(3.0-5.0)
4.6 ± 0.5 (4.0-5.0)
5.9 ± 0.7 (5.0-7.0)
Buttocks
W/O 0 0.4 ± 0.1 (0.3-0.5)
2.1 ± 0.4 (1.5-3.0)
4.4 ± 0.6 (4.0-6.0)
4.4 ± 0.6 (4.0-6.0)
5.0 ± 0.6 (4.0-6.0)
6.0 ± 0.6 (5.0-7.0)
7.0 ± 0.6
(6.0-8.0) 7.8 ± 0.6 (7.0-9.0)
W 0 0.3 ± 0.2
(0-0.7)
0.6 ± 0.2 (0.3-1.0)
2.1 ± 0.4 (1.5-3.0)
2.1 ± 0.4 (1.5-3.0)
3.2 ± 0.6 (2.5-4.0)
4.6 ± 0.5 (4.0-5.0)
5.8 ± 0.6
(5.0-7.0)
6.9 ± 0.6
(6.0-8.0)
Thighs
W/O 0 0.2 ± 0.1 (0-0.5)
1.8 ± 0.4
(1.0-2.5)
3.2 ± 0.5 (3.0-5.0)
3.2 ± 0.5 (3.0-5.0)
4.2 ± 0.5 (4.0-6.0)
4.9 ± 0.5 (4.0-6.0)
5.4 ± 0.5 (5.0-7.0)
6.4 ± 0.5
(6.0-8.0)
W 0 0.2 ± 0.2
(0-0.5)
0.5 ± 0.2 (0.3-0.7)
1.4 ± 0.7 (0.7-3.0)
1.4 ± 0.7 (0.7-3.0)
2.6 ± 0.8
(1.5-4.0)
3.8 ± 0.7
(2.5-5.0)
4.9 ± 0.7 (4.0-6.0)
6.0 ± 0.7 (5.0-7.0)
Knees
W/O 0 0 ± 0.1
(0-0.5)
0.8 ± 0.4
(0.5-2.0)
3.0 ± 0.5 (2.5-4.0)
3.0 ± 0.5 (2.5-4.0)
3.8 ± 0.7
(3.0-5.0)
4.7 ± 0.5 (4.0-5.0)
5.0 ± 0.6 (4.0-6.0)
6.0 ± 0.6 (5.0-7.0)
W 0 0 ± 0.1
(0-0.3)
0.3 ± 0.1 (0.3-0.5)
1.3 ± 0.3 (1.0-2.5)
1.3 ± 0.3 (1.0-2.5)
2.4 ± 0.3 (2.0-3.0)
4.0 ± 0.8
(3.0-5.0)
5.0 ± 0.8
(4.0-6.0)
5.9 ± 0.7 (5.0-7.0)
Calf
W/O 0 0.3 ± 0.2 (0-0.5)
0.7 ± 0.2 (0.5-1.0)
2.5 ± 0.4 (2.0-3.0)
2.5 ± 0.4 (2.0-3.0)
3.1 ± 0.5 (2.5-4.0)
3.9 ± 0.7 (3.0-5.0)
4.9 ± 0.7 (4.0-6.0)
5.8 ± 0.6
(5.0-7.0)
W 0 0.2 ± 0.2
(0-0.5)
0.5 ± 0.2 (0.3-0.7)
1.9 ± 0.6 (1.0-3.0)
1.9 ± 0.6 (1.0-3.0)
2.8 ± 0.4
(2.0-4.0)
3.6 ± 0.6 (3.0-5.0)
4.6 ± 0.6 (4.0-6.0)
5.6 ± 0.6 (5.0-7.0)
Ankles & Feet
W/O 0 0.1 ± 0.1 (0-0.5)
0.5 ± 0.1 (0.3-0.7)
2.4 ± 0.3 (2.0-3.0)
2.4 ± 0.3 (2.0-3.0)
3.5 ± 0.6 (3.0-5.0)
4.4 ± 0.6 (4.0-6.0)
5.2 ± 0.4 (5.0-6.0)
6.0 ± 0.6 (5.0-7.0)
W 0 0 ± 0.1
(0-0.3)
0.3 ± 0.1 (0.3-0.5)
1.0 ± 0.3 (0.7-1.5)
1.0 ± 0.3 (0.7-1.5)
2.2 ± 0.5 (1.5-3.0)
3.6 ± 0.5 (3.0-5.0)
4.6 ± 0.5 (3.0-5.0)
5.7 ± 0.6 (5.0-7.0)
Appendix B
Rating on body parts discomfort/fatigue by motorcyclists (Female, n=50).
Borg Scale Rating at end of each time period (minutes)
Body Part Condition 0 15 30 45 60 75 90 105 120
Neck Or
Head
W/O 0 0.2 ± 0.1 (0-0.5)
0.5 ± 0.1 (0.3-0.7)
1.3 ± 0.4 (0.7-2.0)
2.8 ± 0.7
(1.5-4.0)
4.5 ± 1.1 (2.5-6.0)
5.5 ± 0.9 (4.0-7.0)
6.6 ± 0.8
(5.0-8.0) 7.6 ± 0.7 (6.0-9.0)
W 0 0.1 ± 0.2
(0-0.3)
0.4 ± 0.2 (0.3-0.7)
1.0 ± 0.3 (0.7-1.5)
1.7 ± 0.6 (1.0-3.0)
3.2 ± 0.7 (2.0-4.0)
4.8 ± 1.1
(3.0-6.0)
6.0 ± 0.9 (5.0-7.0)
7.0 ± 0.9
(6.0-8.0)
Shoulder
W/O 0 0.3 ± 0.2 (0-0.5)
1.1 ± 0.4 (0.7-1.5)
2.3 ± 0.6 (1.5-3.0)
3.7 ± 1.0 (2.5-5.0)
4.7 ± 1.0 (3.0-6.0)
5.7 ± 1.0 (4.0-7.0)
6.8 ± 0.8
(6.0-8.0) 7.7 ± 0.7 (7.0-9.0)
W 0 0.2 ± 0.2
(0-0.3)
0.5 ± 0.2 (0.3-1.0)
1.4 ± 0.5 (0.7-2.5)
2.6 ± 0.9 (1.5-4.0)
4.2 ± 1.2 (3.0-6.0)
4.9 ± 0.8
(4.0-6.0)
5.9 ± 0.8
(5.0-7.0)
6.9 ± 0.8 (6.0-8.0)
Upper Back
W/O 0 0.4 ± 0.1 (0.3-0.7)
1.3 ± 0.4 (0.7-2.5)
2.6 ± 0.4 (2.0-4.0)
4.4 ± 0.5 (4.0-6.0)
5.0 ± 0.7 (4.0-7.0)
5.8 ± 0.6
(5.0-7.0)
6.7 ± 0.6
(6.0-8.0) 7.4 ± 0.6 (6.0-8.0)
W 0 0.2 ± 0.1
(0-0.3)
0.7 ± 0.3 (0.3-1.0)
1.0 ± 0.4 (0.5-1.5)
2.0 ± 0.7 (1.0-3.0)
2.9 ± 0.9 (1.5-4.0)
3.6 ± 1.1 (2.0-5.0)
4.6 ± 1.1 (3.0-6.0)
5.6 ± 1.1 (4.0-7.0)
Arms & Hands
W/O 0 0.4 ± 0.1 (0.3-0.5)
1.8 ± 0.4
(1.5-2.5)
2.9 ± 0.5 (2.5-4.0)
4.7 ± 0.7 (4.0-6.0)
5.7 ± 0.7 (5.0-7.0)
6.4 ± 0.6
(5.0-8.0) 6.8 ± 0.7 (6.0-8.0) 7.7 ± 0.7 (7.0-9.0)
W 0 0.2 ± 0.1
(0-0.3)
0.5 ± 0.2 (0.3-0.7)
1.2 ± 0.3 (0.7-1.5)
2.5 ± 0.6 (1.5-3.0)
3.5 ± 0.8
(2.5-5.0)
4.8 ± 1.0
(3.0-6.0)
5.8 ± 0.9
(4.0-7.0)
6.9 ± 0.8 (6.0-8.0)
Low Back
W/O 0 0.4 ± 0.1 (0.3-0.7)
1.5 ± 0.3 (1.0-2.0)
3.0 ± 0.5 (2.5-4.0)
4.9 ± 0.6 (4.0-6.0)
6.2 ± 0.8
(5.0-7.0)
7.2 ± 0.8
(6.0-8.0) 7.5 ± 0.7 (6.0-9.0)
8.4 ± 0.6
(7.0-9.0)
W 0 0 ± 0.1
(0-0.3)
0.3 ± 0.1 (0-0.5)
0.5 ± 0.1 (0.3-0.7)
0.9 ± 0.3 (0.5-1.5)
1.9 ± 0.7 (1.0-3.0)
3.4 ± 1.0 (2.0-5.0)
4.5 ± 0.9 (3.0-6.0)
5.6 ± 0.8
(5.0-7.0)
Buttocks
W/O 0 0.4 ± 0.1 (0.3-0.5)
1.0 ± 0.3 (0.5-1.5)
2.2 ± 0.6 (1.5-3.0)
3.9 ± 0.9 (2.5-5.0)
4.9 ± 0.8
(4.0-6.0)
5.9 ± 0.8
(5.0-7.0)
6.7 ± 0.6
(6.0-8.0)
7.4 ± 0.5
(7.0-8.0)
W 0 0.1 ± 0.2
(0-0.3)
0.4 ± 0.2 (0.3-0.7)
1.0 ± 0.3 (0.7-1.5)
2.1 ± 0.6 (1.5-3.0)
2.8 ± 0.8
(2.0-4.0)
3.8 ± 0.8
(3.0-5.0)
5.0 ± 0.8
(4.0-6.0)
6.0 ± 0.8
(5.0-7.0)
Thighs
W/O 0 0.2 ± 0.2 (0-0.5)
0.7 ± 0.3 (0.3-1.5)
2.1 ± 0.4 (1.0-3.0)
3.7 ± 1.0 (2.5-5.0)
4.4 ± 0.9 (3.0-6.0)
4.8 ± 0.9
(4.0-6.0)
5.7 ± 0.8
(5.0-7.0)
6.7 ± 0.7
(6.0-8.0)
W 0 0.1 ± 0.1
(0-0.3)
0.4 ± 0.1 (0.3-0.7)
0.8 ± 0.3
(0.7-1.5)
1.8 ± 0.5
(1.5-3.0)
2.3 ± 0.6 (2.0-4.0)
3.1 ± 0.8
(2.5-5.0)
4.7 ± 0.7 (4.0-6.0)
5.7 ± 0.6 (5.0-7.0)
Knees
W/O 0 0 ± 0.1
(0-0.5)
0.4 ± 0.1 (0.3-0.7)
1.1 ± 0.4 (0.7-2.0)
2.1 ± 0.5 (1.5-3.0)
3.0 ± 0.6 (2.5-4.0)
4.3 ± 1.1 (3.0-6.0)
5.1 ± 0.8
(4.0-6.0)
6.0 ± 0.8
(5.0-7.0)
W 0 0 ± 0.1
(0-0.3)
0.3 ± 0 (0.3-0.5)
0.5 ± 0 (0.3-0.7)
1.1 ± 0.2 (0.7-1.5)
2.1 ± 0.4 (1.5-3.0)
3.1 ± 0.4 (2.0-4.0)
4.3 ± 0.5 (3.0-5.0)
5.3 ± 0.5 (5.0-6.0)
Calf
W/O 0 0.2 ± 0.2 (0-0.5)
0.6 ± 0.2 (0.3-1.0)
1.4 ± 0.7 (0.7-2.5)
2.8 ± 0.7
(2.0-4.0)
3.6 ± 0.9 (2.5-5.0)
4.4 ± 1.1 (3.0-6.0)
5.3 ± 1.0 (4.0-7.0)
6.2 ± 0.9
(5.0-8.0)
W 0 0.1 ± 0.1
(0-0.3)
0.3 ± 0.1 (0.3-0.5)
0.6 ± 0.1 (0.5-0.7)
1.2 ± 0.3 (0.7-1.5)
2.2 ± 0.8
(1.0-3.0)
3.5 ± 1.0 (2.0-5.0)
4.9 ± 0.9 (3.0-6.0)
6.0 ± 0.8
(5.0-7.0)
Ankles & Feet
W/O 0 0.1 ± 0.1 (0-0.3)
0.5 ± 0.2 (0.3-0.7)
1.4 ± 0.7 (0.7-2.5)
2.6 ± 0.7 (2.0-4.0)
3.6 ± 1.0 (2.5-5.0)
4.6 ± 1.0 (3.0-6.0)
5.6 ± 1.0 (4.0-7.0)
6.5 ± 0.9
(5.0-8.0)
W 0 0 ± 0.1
(0-0.3)
0.3 ± 0.1 (0.3-0.5)
0.5 ± 0.1 (0.5-0.7)
1.1 ± 0.3 (0.7-1.5)
2.3 ± 0.6 (1.5-3.0)
3.8 ± 1.0
(2.5-5.0)
4.8 ± 1.0
(3.0-6.0)
5.9 ± 0.8
(5.0-7.0)
Appendix C
T test output for the paired samples (with and without lumbar support) discomfort (Male, n=50).
Body Parts (Min)Time Mean Std. Dev t df Sig. (2-tailed)
Effect
Size, Cohen's d
Neck or Head
15 0.09 0.17 3.66 49 0.00** 0.52 Medium
30 0.08 0.21 2.74 49 0.01* 0.39 Small
45 0.70 0.62 7.95 49 0.00** 1.12 Large
60 0.77 0.85 6.39 49 0.00** 0.90 Large
75 0.86 0.78 7.77 49 0.00** 1.10 Large
90 0.94 0.74 8.98 49 0.00** 1.27 Large
105 0.96 0.64 10.65 49 0.00** 1.51 Large
120 0.88 0.69 9.03 49 0.00** 1.28 Large
Shoulder
15 0.08 0.14 4.00 49 0.00** 0.57 Medium
30 0.38 0.52 5.16 49 0.00** 0.73 Medium
45 1.33 0.71 13.22 49 0.00** 1.87 Large
60 0.64 0.72 6.27 49 0.00** 0.89 Large
75 1.24 0.72 12.25 49 0.00** 1.73 Large
90 1.40 0.70 14.15 49 0.00** 2.00 Large
105 1.48 0.79 13.27 49 0.00** 1.88 Large
120 1.36 0.72 13.33 49 0.00** 1.88 Large
Upper Back
15 0.25 0.16 11.00 49 0.00** 1.56 Large
30 1.63 0.62 18.65 49 0.00** 2.64 Large 45 3.07 0.81 26.84 49 0.00** 3.80 Large
60 3.51 0.82 30.36 49 0.00** 4.29 Large
75 3.25 0.66 35.00 49 0.00** 4.95 Large
90 2.84 0.50 40.21 49 0.00** 5.69 Large
105 3.12 0.77 28.54 49 0.00** 4.04 Large
120 2.66 0.80 23.56 49 0.00** 3.33 Large
Arms & Hands
15 0.08 0.13 4.30 49 0.00** 0.61 Medium
30 1.33 0.42 22.26 49 0.00** 3.15 Large
45 1.62 0.62 18.52 49 0.00** 2.62 Large
60 1.37 0.69 14.02 49 0.00** 1.98 Large
75 0.95 0.73 9.20 49 0.00** 1.30 Large
90 0.94 0.74 8.98 49 0.00** 1.27 Large
105 0.98 0.80 8.72 49 0.00** 1.23 Large
120 0.60 0.81 5.25 49 0.00** 0.74 Medium
Low Back
15 0.45 0.20 16.21 49 0.00** 2.29 Large
30 2.14 0.40 38.19 49 0.00** 5.40 Large
45 3.41 0.79 30.55 49 0.00** 4.32 Large
60 4.27 0.95 31.65 49 0.00** 4.48 Large
75 3.71 0.66 39.56 49 0.00** 5.60 Large
90 3.46 0.54 45.10 49 0.00** 6.38 Large
105 3.00 0.76 28.06 49 0.00** 3.97 Large
Appendix C (continuation)
Body Parts (Min)Time Mean Std. Dev t df Sig. (2-tailed)
Effect
Size, Cohen's d
Buttocks
15 0.12 0.23 3.67 49 0.00** 0.52 Medium
30 1.52 0.48 22.51 49 0.00** 3.18 Large
45 2.23 0.70 22.54 49 0.00** 3.19 Large
60 2.27 0.73 21.99 49 0.00** 3.11 Large
75 1.44 0.79 12.94 49 0.00** 1.83 Large
90 1.82 0.84 15.25 49 0.00** 2.16 Large
105 1.28 0.78 11.55 49 0.00** 1.63 Large
120 0.94 0.82 8.12 49 0.00** 1.15 Large
Thighs
15 0.04 0.20 1.54 49 0.13 0.22 Small
30 1.29 0.40 22.84 49 0.00** 3.23 Large
45 2.01 0.41 34.70 49 0.00** 4.91 Large
60 1.77 0.84 14.83 49 0.00** 2.10 Large
75 1.61 0.94 12.13 49 0.00** 1.72 Large
90 1.09 0.91 8.44 49 0.00** 1.19 Large
105 0.54 0.84 4.56 49 0.00** 0.64 Medium
120 0.44 0.88 3.52 49 0.00** 0.50 Small
Knees
15 0.01 0.15 0.66 49 0.52 0.09 Small
30 0.47 0.39 8.49 49 0.00** 1.20 Large
45 1.28 0.39 23.33 49 0.00** 3.30 Large
60 1.66 0.54 21.79 49 0.00** 3.08 Large
75 1.47 0.69 15.11 49 0.00** 2.14 Large
90 0.72 0.90 5.63 49 0.00** 0.80 Large
105 0.06 0.93 0.45 49 0.65 0.06 Small
120 0.08 0.97 0.59 49 0.56 0.08 Small
Calf
15 0.09 0.25 2.55 49 0.01* 0.36 Small
30 0.23 0.26 6.27 49 0.00** 0.89 Large
45 0.87 0.68 9.07 49 0.00** 1.28 Large
60 0.57 0.71 5.64 49 0.00** 0.80 Large
75 0.31 0.72 3.04 49 0.00** 0.43 Small
90 0.38 0.97 2.78 49 0.01* 0.39 Small
105 0.38 0.97 2.78 49 0.01* 0.39 Small
120 0.16 0.91 1.24 49 0.22 0.18 Small
Ankles & Feet
15 0.01 0.16 0.43 49 0.67 0.06 Small
30 0.11 0.15 5.21 49 0.00 0.74 Medium
45 0.85 0.34 17.53 49 0.00 2.48 Large
60 1.37 0.45 21.66 49 0.00 3.06 Large
75 1.23 0.77 11.29 49 0.00 1.60 Large
90 0.82 0.75 7.76 49 0.00 1.10 Large 105 0.62 0.70 6.29 49 0.00 0.89 Large
120 0.32 0.84 2.68 49 0.01* 0.38 Small
Appendix D
T test output for the paired samples (with and without lumbar support) discomfort (Female, n=50).
Body Parts (Min)Time Mean Std. Dev t df Sig. (2-tailed)
Effect
Size, Cohen's d
Neck or Head
15 0.11 0.14 5.23 49 0.00 0.74 Medium
30 0.12 0.19 4.58 49 0.00 0.65 Medium
45 0.36 0.46 5.53 49 0.00 0.78 Medium
60 1.02 0.78 9.30 49 0.00 1.32 Large 75 1.31 1.07 8.63 49 0.00 1.22 Large
90 0.72 1.20 4.26 49 0.00 0.60 Medium
105 0.68 1.02 4.72 49 0.00 0.67 Medium
120 -0.64 1.01 -4.50 49 0.00 0.64 Medium
Shoulder
15 0.12 0.23 3.79 49 0.00 0.54 Medium
30 0.61 0.44 9.93 49 0.00 1.40 Large 45 0.83 0.82 7.20 49 0.00 1.02 Large 60 1.08 1.29 5.92 49 0.00 0.84 Large
75 0.52 1.52 2.43 49 0.02 0.34 Small
90 0.76 1.27 4.23 49 0.00 0.60 Medium
105 0.92 1.08 6.00 49 0.00 0.85 Large
120 0.80 1.01 5.60 49 0.00 0.79 Medium
Upper Back
15 0.20 0.19 7.52 49 0.00 1.06 Large 30 0.62 0.48 9.16 49 0.00 1.29 Large
45 1.67 0.58 20.29 49 0.00 2.87 Large
60 2.46 0.94 18.59 49 0.00 2.63 Large
75 2.17 1.05 14.64 49 0.00 2.07 Large
90 2.20 1.16 13.40 49 0.00 1.90 Large
105 2.04 1.21 11.91 49 0.00 1.68 Large
120 1.78 1.23 10.20 49 0.00 1.44 Large
Arms & Hands
15 0.18 0.15 8.26 49 0.00 1.17 Large
30 1.32 0.38 24.35 49 0.00 3.44 Large
45 1.72 0.62 19.54 49 0.00 2.76 Large
60 2.21 0.97 16.12 49 0.00 2.28 Large
75 2.16 1.17 13.04 49 0.00 1.84 Large
90 1.62 1.21 9.46 49 0.00 1.34 Large
105 0.96 1.21 5.60 49 0.00 0.79 Medium
120 0.84 1.13 5.25 49 0.00 0.74 Medium
Low Back
15 0.37 0.11 23.95 49 0.00 3.39 Large
30 1.15 0.25 33.12 49 0.00 4.68 Large
45 2.50 0.38 47.05 49 0.00 6.65 Large
60 3.99 0.42 66.99 49 0.00 9.47 Large
75 4.26 0.66 45.88 49 0.00 6.49 Large
90 3.74 0.72 36.57 49 0.00 5.17 Large
105 2.98 0.80 26.50 49 0.00 3.75 Large
Appendix D (continuation)
Body Parts (Min)Time Mean Std. Dev t df Sig. (2-tailed)
Effect
Size, Cohen's d
Buttocks
15 0.22 0.18 8.54 49 0.00 1.21 Large
30 0.57 0.38 10.65 49 0.00 1.51 Large
45 1.21 0.71 12.00 49 0.00 1.70 Large
60 1.81 1.02 12.49 49 0.00 1.77 Large
75 2.08 1.14 12.90 49 0.00 1.82 Large
90 2.07 1.14 12.81 49 0.00 1.81 Large
105 1.76 1.04 11.95 49 0.00 1.69 Large
120 1.34 0.98 9.65 49 0.00 1.37 Large
Thighs
15 0.09 0.23 2.67 49 0.01 0.38 Small
30 0.34 0.30 7.93 49 0.00 1.12 Large
45 1.23 0.50 17.29 49 0.00 2.44 Large
60 1.93 1.09 12.49 49 0.00 1.77 Large
75 2.12 1.13 13.24 49 0.00 1.87 Large
90 1.73 1.22 10.05 49 0.00 1.42 Large
105 1.04 1.03 7.14 49 0.00 1.01 Large 120 0.94 0.91 7.28 49 0.00 1.03 Large
Knees
15 0.01 0.13 0.56 49 0.58 0.08 Small
30 0.06 0.14 3.31 49 0.00 0.47 Small
45 0.60 0.40 10.58 49 0.00 1.50 Large
60 1.07 0.51 14.94 49 0.00 2.11 Large
75 0.88 0.67 9.33 49 0.00 1.32 Large 90 1.14 1.07 7.54 49 0.00 1.07 Large 105 0.82 0.83 7.03 49 0.00 0.99 Large
120 0.62 0.83 5.28 49 0.00 0.75 Medium
Calf
15 0.12 0.19 4.67 49 0.00 0.66 Medium
30 0.27 0.26 7.25 49 0.00 1.03 Large 45 0.82 0.68 8.54 49 0.00 1.21 Large
60 1.65 0.75 15.49 49 0.00 2.19 Large
75 1.32 1.20 7.76 49 0.00 1.10 Large
90 0.97 1.41 4.86 49 0.00 0.69 Medium
105 0.48 1.33 2.56 49 0.01 0.36 Small
120 0.24 1.20 1.41 49 0.17 0.20 Small
Ankles & Feet
15 0.07 0.17 2.67 49 0.01 0.38 Small
30 0.16 0.18 6.06 49 0.00 0.86 Large 45 0.90 0.67 9.45 49 0.00 1.34 Large
60 1.52 0.77 13.98 49 0.00 1.98 Large
75 1.25 1.13 7.85 49 0.00 1.11 Large
90 0.80 1.43 3.97 49 0.00 0.56 Medium
105 0.76 1.44 3.74 49 0.00 0.53 Medium
120 0.58 1.31 3.13 49 0.00 0.44 Small