QUANTITATIVE STUDY OF THE EFFECTS OF THE EUROPEAN COMMUNITY ENLARGEMENT ON THE PROCESSED TOMATOES MARKET. PARTICULAR REFERENCE TO THE CASE OF THE PORTUGUESE SECTOR
Doctoral Dissertaíion by
Maria Teresa de Noronha Vaz
1993
UNIVERSIDADE DO ALGARVE Unidade de Economia e Administração
QUANTITATIVE STUDY OF TIIE EFFECTS OF THE EUROPEAN (OMMDNFIY ENLARGEMENT OIN THE PROCESSED TOMATOES MARKEF. PARTICULAR REFERENCE TO THE CASE OF THE PORTUGUESE SECTOR
Doe!ora! I lisserlaiion by
Maria Teresa de Noronha Vaz
1993
UNIVERSIDADE DO ALGARVE Unidade de Economia e Administração
Uníversidaoe oo algarve SERVIÇO DE DOCUMENTAÇÃO 118 \ r . z - ^ ,1 1 íd-
UNIVERSIDADE DO ALGARVE
QUANTH ATIVE STUDY OF THE EFFECTS OF THE EUROPEAN COMMUNITY ENLARGEMENT ON THE PROCESSEI) TOMATOES MARKET. PARTICULAR REFERENCE TO THE CASE OF THE PORTUGUESE SECTOR.
Maria Teresa de Noronha Vaz
Dissertação apresentada na Universidade do Algarve para a obtenção do grau de Doutor em Ciências Económicas (Economia)
FARO 1993
ACKNOWLEDGMENTS
I am graleílil lo my liusband, Winchil, for having laught me llie persistence necessary for tliis work and for íinding llie time to lielp me in tlie translations of this text. I appreciale lhe patience of my son Erich who supported many of my moments of intolerance.
The collaboralion of colleagnes and IViends allowed llie exchange oí ideas and many fruitful discussions. To ali of them I am thankful, but I want to mention in particularly the following names: Doctor H.-C. Behr, for bis help in the use of the model; Doctor 11.-H. Jahn and Professor E.Schmitt íor their advice; Eng" Teresa Costa Neves and Paulo da Ponte for their support with data and graphics. An acknowledgement lo my colleagues from lhe Unidade de Economia e Administração, particularly to Professor A. Pimpão, who amiably received me in lhe UEA and created good and agreeable working conditions.
I owe the beginning of this work to the support of Professor H. de Haen and to the confidence of Professor R. von Alvensleben, my first adviser. This thesis is based on the work of two great scientists whose name I have to emphasize here: Professor S. Tangermann and Professor K. Moulton.
At lasl a special thanks to Professor F. Brito Soares who, during lhe past year and inspite of ali his other duties, found the time to guide me in lhe lasl phase of this work. I lis contribution lias been inestimable.
TABLEOFCOINTEINTS:
1. Introduction 3
2. The Cominou Agricultural Policy: market regulations and
structural supports 9
2.1. Generical goals oflhe CAP, policies and results 9 2.1.1. Price policy in the EC and lhe stability of lhe
world markets 13 2.1.2. Price formation and the CAP 17 2.1.3. CAP and lhe inlegralion of Portugal and Spain 18 2.1.4. The structural policy ofthe CAP 24
2.2. Perspective for future policies 26
3. Production and processing of tomatoes - a sectorial study 29
3,1 Siluation on inlernalional markets: production and
consumption 35 3.2. Price and subsidies policies in lhe sector 39 3.3. Trade llovvs as a result of politicai market regulations 45 3.4. Competiliveness and conslrains in lhe world for the
processing tomalo induslry 50
4. The use of a simulation model for projections of international
trade patterns of processed tomatoes 58
4.1. Selected studies and selection of a simulation model 58 4.2. Advanlages and limits of a simulation model 68 4.3. Theoretical analyses of applied instruments 69 4.3.1. The behaviour of the producer 69 4.3.2. The behaviour of the consumei" 71
4.4. Characterisation and mathemalical formulation 76 4.5. Relationship between tlie diílerent possibilities of
politicai decision and paramelcr variation 87
5. Computer procedure 89
5.1. Material and methods: commenls on the choice of the
parameters 89 5.2. Model validation 91 5.3. Specification of the proposed scenarios 97
6. Discussion of the results 100
6.1. Discussion of the scenarios: plausible scenarios and
scenarios for inslrumenlal analysis 100 6.2. Sensilivity analysis for lhe mosl plausible scenarios 122 6.3. Interrelationship between tomato paste and
peeled tomatoes 126
7. The portuguese tomalo-processing sector 129
7.1. Portuguese agriculture and signifícance of tomato
production 129 7.1.1. Agrarian structure 134 7.1.2. Processing industry 139 7.1.3. Export markets for the product and some
problems of the sector 141 7.2. The application of plausible CAP policies and its
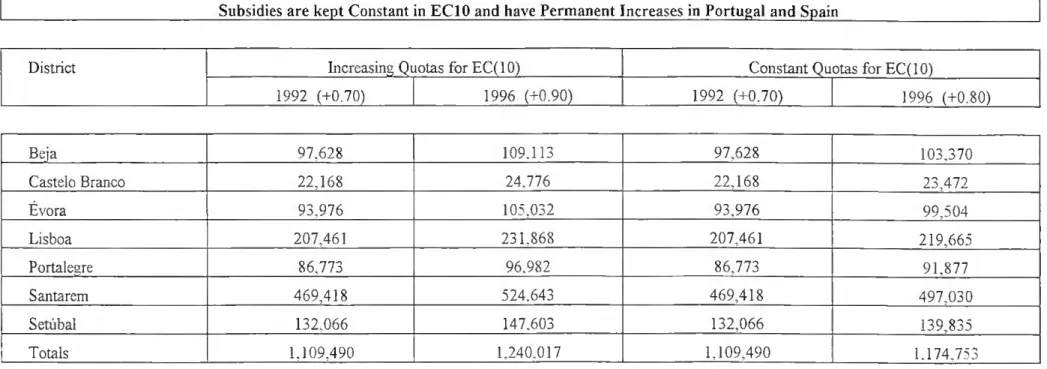
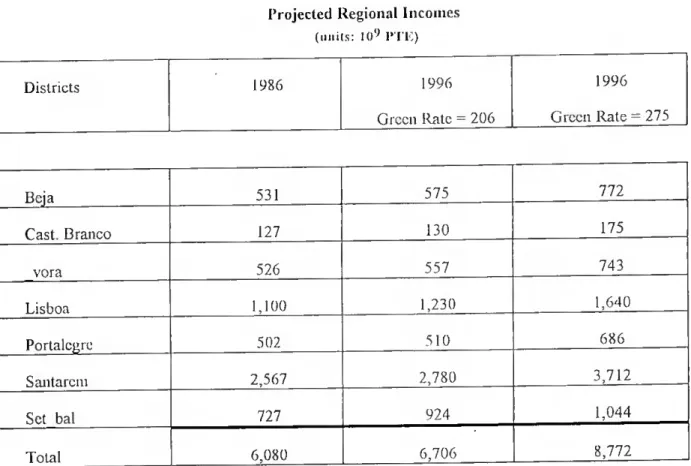
consequences for the agricultural sector 143 7.3. Evolution of farmers income 150
8 Conclusion 154
REFERENCES 159
LISTOFTABLES 171
LIST OF FIGURES 173
APPENDIXES:
3 .4 Tables ou Production struclure of dillerent countries 5.1 Quantities of produced and consumed processed tomatoes 5.2 Slatus-quo projections
5.3 Proposcd sccnarios 5.4 Computalional procedure
I. INTRODUCTION
AIMSOF THE WORK
11 is well known that tlie enlargemenl ofEuropean Community by lhe integration of Portugal and Spain raised concerns not only witli respect to the impact that an extended Common Agricultural Policy (CAP) had on international markets of differenl commodities bui also on tlie íact tliat lhe European Markel achieves surpluses in cerlain commodities wliose production has a strong financial support from the CAP. Production of processed lomatoes is one of the typical examples of such a situation. In this case, both Portugal and Spain have a significant position in the world trade of tomato processed products but at the same time other countries like Italy and Greece almost achieve leveis of self sufficiency for the European Markets.
Since these two recently integrated countries had different trade policies for lhe products under consideralion prior to adhesion lo lhe EC, different médium term reactions to the application of the CAP are expected.
We intend to simulate, in so lar as possible, the situation described above in a Multi-Country Equilibrium Simulation Model, so we shall be working with different processed products (concentrate and peeled) on a static basis. This will allow us lo have, for lhe sector, a quantitative method of calculating variations in supply and demand quantities as well as expected
prices for lhe diíTerenl countries considered in llie model projections. This presupposing, of course, changes of subsidies, minimuni grower prices and quotas. The use of such an analytical crilerion allows a judgement based on tlie quantitative impact of llie parameters, thereby being more reality-near than lhe usual descriptive analyses.
The imporlanl role lhat llie lomalo produclion sector has lor agriculture in Portugal stimulales lhe study of the consequences of the "model-expected" new equilibrium prices and quantities on farmefs and regional incomes. AJso here, whenever the available portuguese data permits it, the use of a quantitative method will be attempted.
The main aim of this study is, therefore, to apply model simulations to available data of the processed-lomato industry and detecl lhe international market changes as well as possible consequent income instabilities in Portugal.
DESCRIPTIVE PLAIN OF TIIE WORK
The tomato processing industry was chosen as an interesting sector where the CAP and ils instruments have been able to strongly promote production and trade.
Two distinct sections will be carried out in this work. The first section will involve a detailed study of the international market of processed
tomatoes. We intend to characlerise and describe the international trade in this sector over llic lasl leu years and lo carry oul a theoretical economical analyses of lhe three fundamental decisions of the CAP that may have an elTect on this trade: production subsidies, production quotas, variations in producer prices.
So, our main interest is to select a simulation model, based on an equilibrium situation between supply and demand, able to reproduce this market situation, create plausible scenarios and use them for projections. Such melhodology will involve procedures related to lhe choice of paraineters and simulative modelling, development of an appropriate computer program and, in wliat concerns model projections, a study of the relationship between different possibilities of politicai decisions and consequent parameter variation
As a result of lhe projections, we shall obtain new equilibrium quantities and prices that will allow us lo describe future perspectives for international trade in the commodity considered and also provide the values which will serve as a base for the second section.
The second section will be restricted to a study of the portuguese sector. An overview of the productive and entrepreneurial structures, considering the labour productivity and its agrarian institutional context, as well as a delailed description of the financial supports for development of the tomato-processing industry in Portugal before 1986, will be presented. Here
we use a quantitative method which relates lhe equilibrium values obtained for Portugal in lhe first section, to national data in order to estimate socio- economical indicators such as farniePs and regional inconics and fluctuations of the trade balance. To conclude this part vve would like to consider, on an empirical basis, the inclusion of "non-observable" variables that may alter the results obtained.
The research done lo obtain reliable data supplied nuich more information than being directly used for the tvvo blocks described above. Since such information and data could eventually be useful for other studies, or would consist in a support to lhe conlents of this work, it has bcen compiled and annexed in lhe forni of appendices.
2. THE COMMON AGRICULTUIIAL POLICY: MARKET REGULATIONS AND STRUCTURAL SUPPORI S.
2.1. GENÉRICAL GOALS OV THE CAP, POLICES AND RESULIS.
In lhe early JÇBCs when tlie economic policies of lhe U.S.A. and Europe took diíTerent directions and Japan increased its importance in lhe world markels, a growing niaiket imbalance becaine llie focus of lhe present economic problems. The USA had foliowed a line of tight monetary control and expansionary fiscal policy. Europe, on lhe contrary, decided lo develop liberalisation in lhe industrial and services sectors. However, contrary to lliese sectors in lhe world markels, proteclionism of agricultural commodities had intensified, increasing lhe distorlions of lhe Irade patterns.
Reasons for lhe distinct development of market regulations in this sector have been analysed (see Kruger, 1983) and may be considered to be lhe result of condilions created for most european countries by the second world war. Among the more important reasons we can consider the following:
1) High european dependence on food crops from the U.S.A., Austrália, Canada, New Zealand and Argentina.
2) Devaslalion of rural areas, socially justiíying lhe support to the farm sector.
In addition to tliis lhe post-war agricullural policy of the other counlries, nolably that ofllie USA, lias accentuated tlie inibalance:
1) The changing monetary policy and consequent variation of exchange rate lended lo reduce U S A. exports and incentivate productions in other countries (Moyer and Josling, 1990).
2) The inefficiency of the domestic policy of lhe U.S.A. also contributed substantially to the problem. Kramer (1986) has analysed most of lhe commodity programs that have been developed in the U.S.A. vvith criticisms based on lhe fact that they vvere attracting resources into production of unprofilable commodities or even that this kind ol programs have focus on price ralher lhen on income risk.
Bullock (1984) summarises the structural characteristics of the U.S. agriculture criticising the use of agricullural price support programs with arguments based on the fact that during the 1980-1982 period, farms with annual gross sales in excess of U.S. $500,000- were producing about 60% oí the US annual net farm income represented only about 1% of the total farms, while 72% of lhe rest oflhe farms produced only about 13% and were operating on average, at a loss.
3) The developing countries instead of creating a solid rural basis, using the comparative advantages that they had for the agricullural sector, tried lo follow and give support lo a quick growth settled on the usual industrialisalion process. Such an oplion contributed to the degree of imbalance in these countries and probably made them to lose, for many years, the possibility of competition in both agricullural and industrial sectors.
Indeed lhe CAP of lhe EC, lias been having major eíTects on lhe world agricullure bui its main impact in lhe domestic production carne afler lhe weakening of tlie US$ vvhen subsidies to support prices had to increase in Europe to keep its export levei in lhe world markets.
As a consequence the budgetary weight represented by agriculture as well as the increasing surpluses in production of agricultural commodities, becanie the main concerns of european policy makers. fhis first problem, characterised as the asymmetry of the european budget is illustrated with the fact that 70% of its expenses are being used in agricultural policy and 30% in lhe area of social, regional and development policies. Yel, lhe complex social implications of a prolected agricullural system have to be considered.
Since income is self-sustained and no credits are allowed to cover debts in the E.C., the use of the budgetary revenues is being directed mainly to the agrarian sector. Understanding such a situalion from its globality we should keep in mind that wastes in the utilisation of comparative advantages are taking place more than ever. While the developed countries restrict their budget in supports for the industrial sector, where they generally have such advantages, they are simullaneously taking away the opportunilies of the developing countries to improve their agricultural sector, due to the deterioration of the trade conditions that such policies promote (Spahn,
Another major problem is the permanent dependence of the success of CAP decisions upon the monelary policy of the USA. In tliis case particularly, the agricultural sector is very sensitive to variations of real exchange rates. Such can be considered a strong restriction lo the development of an eíTeclively protected agricultural policy.
New efforls are required from almost ali concerned entities to solve the present problems. The common opinion is that the present world market system based essentially ou regulations such as the CAP in Europe, tax regulations in lhe USA or Preferential frade Agreements practised by other countries sets a framework for agriculture that is no longer transparent to the simple rules of demand and supply. Whether such efforts should be based only upon an institutional change or whether they should require an entirely new defmition and concept of the market rules (Weinschenk, 1985), is still in discussion. The hypotheses that the agriculture policy defmitions of the EC are very influenced by its unique institutional structure supports the former case (Runge and Wilzke, 1987).
Considering the problems referred to above, the analysis of the difficulties involved in achieving world trade liberation seems opportune. Such an approach was brought up by Schmitz (1988) who use the Compensation and the Pareto principies to analyse the rule of special interest groups in lhe GATT In this sludy the EC plays a most important part and only a dynamic analysis based on lhe Compensation Principie gives the theoretical support to freer trade. However, as from any policy change, also
in this case lliere are losers nolably small producers who may not be able to cover costs at free trade prices and lhereíbie will require compensative amounts to moderate llieir income losses and preveni regional or social inslabilities.
2.1.1. PR ICE POLICY IN THE ECANDTIIE STAIHLITY OFTHE WORLD MARKE I S
The prescnl situalion in lhe woikl inarkels shows lhal lhe lluropean Conununily has become one olThe mosl importam trade partners and as such ils stabilily will inllncnce lhe condilions for lhe inlernalional trade ofagrarian producls and correlated industries.
The leveis of agrarian prices practised in lhe EC are higher then the ones existent for the rest of lhe world.
A liberalisation of the inlernalional trade in agricultural producls will possibly dccrcasc prices creating lower produclion and higher demand. This will promote imports, a situalion that sooner or later will lead to the increase of the world prices. Therefore, a knowledgc of the amount of the resulting changes in produclion is of inleresl for cach country, although a clear prediction is improbable. Predictive models, in order to have applicability, require that lhe degree of conlldence existent in lhe chosen elasticities be high, which imposes a very restrictive condition. As such, it is not surprising that the arguments of lhe differenl countries lowards lhe change in the
european agricultural policy, are difficult to justify in quantitative lerms and reílect only lhe dilVerenl expeclalions rclalivc lo lhe perspective oí dillerenl trade patterns.
Koesler (1985) selected basically thrcc characlerislics that would define llie expecled relalions:
1) Those who are exportei s ofthe most agricultural producls would be happy to deal with an expanded market at higher prices - it would be the case ofthe USA.
2) Countries whose imports would stay at the saine levei independem ofthe reduced compelitivity in the EC would be negatively influenced. 1 hey would have lo bear lhe higher prices without reaching the positive result in lhe trade balance. Especially lhe developing countries would be in this group.
3) Some nel importei" countries could be able lo surmount diíTiculties if the increase in prices could allow them to be exporteis at least in some commodities.
Indeed, it is difficult to judge whcther or nol lhe CAJ> contributes to the price stabilisation of agricultural products. The conditionants for it are a complex system of supply, demand and stock variations. Hinton (1991) describes the situation as follows: If it is considered that due to CAP prices are kept higher inside Europe then in the rest of lhe world, it is to be expect that Europe will, as a consequence, develop the condilions lo produce more whereas the rest ofthe world will develop the conditions to produce less.
Changes in produclion amounts (or in lhe elasticities oí supply and demand), however, are not tlie essenlial reasons for changes in lhe vvorld prices. These are much more the consequence of stockage of the products. The exporteis receive a diíTerential correspondem lo the difference between the price used in tlie internai market and lhat of lhe rest of lhe world. 1 hus their advantage is to keep their stocks constants. The CAP decisions stipulate the stock variations and lhe pressures on tlie world markets are essentially a consequence of these.
We have seen lhe consequences for the agricultural sector from different price policies. However, we should not lorget lhe complex world in which this price and other market policies are taking place.
Alvensleben (1988) compared a two sectors model oí the economy with a system of water basins with self regulation and explained lhe causes oí structural change in agriculture as well as the efiect that different market policies had upon this system. The Figure 2.1 shows how agriculture and the rest of lhe economy are interrelaled particularly in certain areas as íor instance, resource allocation, unemployment and domestic demand.
Fiyure 2 I
Comparison of a Two-Sector-Modei fo the Econom> with a System of Water Basms
i echnical Prosress Facior Prices Factor Allocation Domestic Supply Prodaction Capacity Agriculture Supply Quota
Weather Product Prices Shocks
Impons
Iinpon
Rcstrictior. Agricultura! Markets
Unemployed outntigration Tcchnical Progress Production Capacity Resi of the Economv
Domestic Supply Product Prices Supply Quota Impons Markets of the olher Hconomy — Impon Restriction
2.1.2. PR1CE FORMATION ANI) THE COMMON AG RI CULTURAL POLICY
Price ibrniation in llie internai markel, is seen as an inslrunient lo achieve objectives of trade and agricullural policy through its function as a regulator ofincomes and saleguard ofconsumer preíerences. 1 lie niechanisni leading from price ibrniation to income regulalion or consunier protection is based in price ílxing and income supports bui it is in many vvays restricted, by tlie interrelation belween supply and demand.
Price ibrniation in lhe CAP is known to be a very complex mechanism resulting from international prices and internai prices, tlie latter slipulated at a levei able to guarantee production to farmers. lhe fixing of such agricullural prices is made in ECLTs and these have to be reconverted in national currencies using both tlie green rale or lhe compensation amounts as additional regulalors.
The list of instruments aireeling supply may be grouped as follows: 1) Subsidies, favourable credit conditions and minimal price guarantees are instruments causing direct expansion in production; 2) Other instruments like import restrictions, export subsidies and processing supports, have as immediate effect, rise in prices and incomes. In such a case, contraction in tlie demand is possible and this may evenlually allect supply in a restriclive way; 3) Indirecl inlluences, such as invesíments, supports, research.
educalion, and improvemenl of advisory services, may also develop supply bui willi a mcdiuin or long Icrm cHecl.
II" we considcr lhe achievemcnl of incrcases in agricultural incoincs, direclly Ihrough highcr minimal producer prices, we have lo expect thal tlie consequent increases in supply would promete the possibilities of price decreases and new income reductions. Besides, it should be considered that while price mechanisms are quick procedures, the policy making process is slovv, particularly in horticulture.
As such, price formalion is a very risky regulalor ofincomes if one of the assumptions of lhe agricultural policy is to develop together with an income policy. In this case lhe combination of an intervention price anc^áce compensalion lo the íarmers, serves lo regulate lhe risk.
2.1.3. THE CAP AND THE INTEGRATION OF PORTUGAL AND SPAIN
The influences of lhe inlegralion of Portugal and Spain in lhe BC upon lhe inlernational markets are relatcd with lhe formation or enlargement of any customs union on trade ílows. As trade barriers disappear lower cosi impo ris substitute some high cosi domestic production, causing a consequent new order in lhe production processes and consequenlly eventual demand expansion due to price decreases - lhe so called trade creation effect.
This lias been tlie concern of several aulhors who have been trying since lhe IQSCs lo determine losscs and gains resulting from lhe integration of Portugal and Spain in the EC, using mainly analyses of trade flows. Some attempts to derive conclusions from aggregaled studies have been undertaken (Savver, 1984; Donges et af, 1982). Other aulhors have concentraled lhe analyses on specific sub-seclors (Tangermann et al., 1986) or speeific products (von Alvensleben et al., 1986).
A recent economelric model of bilateral Irade ílows (Plummer, 1991) calculates "changes in allocative eíllciency stemming from the expansion oí lhe EC". The study considers trade creation and trade diversion for tvvo conceptually distinct phases of integration. The first phase considers the incremental effects of the accession as a result of the disappearance oí bilateral tariffs and the second measures the total change in allocative efficiency due to preferential association between the EC and recently inlegrated countries, (see Table 2.1.1).
The sector of fruits and vegetables represents 13,7% of the EC(12) agricultural output. The contribution of such products for this output is illustrated in Table 2.1.2. In this area Spain is a major exporter of citrus, tomatoes, strawberries and onions (Hinton, 1991). The sector is organised, as in most of the other Mediterranean countries, relying on low costs of production and not having to face tariffs or other import conlrols. 11 may well happen that in the competition process Spain pushes the products oí non EC countries out of the european market. Table 2.1.3, representing lhe
evolution of exporls of horticultural products in Europe, can support this stalement. However, lhe degree of competiliveness of lhe country with lhe norlhern Emopean counlries like lhe Nelherlands or Gerniany, is nol such an easy issuc.
Much in lliis "competitive race" depends on tlie determinant technological factor. The use of new lechnologies presupposes a transition of a Iraditional production system to an industrial one, permitting a continuous adaplalion of lhe agriculluial aclivily lo lhe markel condilions in order lo achieve optimisation leveis, Such does not allow lhe survival oí many traditional production systems of the mediterranean areas (Ramos Real, 1991) so that lhe polcntial competiliveness becomes dependcnl on both lhe social context and the speed at which lhe transition is possible.
Portugal on lhe contrary having a very problematic agricultural sector with a veiy deficient marketing structure presents very few productions with dimensions lo compele in the european markel. I ornato production for paste was for a long time one of these products and therefore our interest in studying the recent changes occurring in the sector.
TABLE 2.1.1.
Estimatcs of Nei Trade Creation (1984 Erices)
Commodities Spain Portugal EC10
Meat -2.2 -0.3 -97.4 Dairy Products 9.2 0.4 -88.8 Cereais -65.2 -35.3 -146.5 Sugar 5,8 22.8 -899.2 Tobacco -135.7 -7.2 -132.1 Leather Products -3.6 0.2 -12.9 Rubber 9.2 2.5 -25.8 Textiles 13.0 1.0 -171.9 Paper Products -9.9 -4.4 -690.0
Iron & Steel -1.8 12.9 -719.7
Total Agriculture -188.0 -19.6 -1328.1
Total Manufacture 7.0 12.2 -1620.3
Total -181.0 -7.4 -2948.4
Source; C. Plummer (1991) "Efficiency eíTects of lhe accession of Spain and Portugal to the EC".
TABLE 2.1.2.
Ihei ían Particijíalion in EC Vegelablc and Fniit Production by Areas and Quantities (%, 1987)
Products Área Production
Ali Brassicas 36.00 37.02
Vegetables - Leafed or Stalked 24.48 23.29
Tomatoes for Fresh and Process 31.20 27.70
Other Annual Cultivated Fruit 47.75 38.77
Roots and Tubers 33.99 26.02
Pulses 18.02 24.18
Apples and Peai s 28.40 15.93
Grapes for Table 28.72 19.23
Stone Fruit 24.63 19.11
Citrus Fruit 54.84 59.82
Berries and Kiwis 22.00 23.08
Other Fruit 78.41 85.00
TABLE 2.1.3
Evolution of Exports of Horticultural Products (1984 to 1989) (1,000 U.S. dollars)
Northern European Countries 1984 1985 1986 1987 1988 1989 84/89
Beleium - Luxemburs 593 657 939 1,197 1.262 1,462 147%
Federal Republic of Germany 578 627 846 1,062 1.194 1,220 111%
The Netherlands 2,151 2,077 2,688 3.353 3,786 3,953 84%
United Kiunedom 254 264 368 492 396 460 80%
Southern European Countries
France 1,209 1.276 1,624 2,120 2.269 2,335 93% Spain 1,998 1,840 2,582 3,302 3.674 3,682 84% Portugal 102 95 119 122 153 162 59% Italy 2.043 2.226 2,631 3.101 3.232 3.209 57% Greece 681 689 809 864 601 955 40% Turkey 931 932 1,232 1,441 1.585 1,292 39% Source: OECD
2.1.4. THE STRUCTURAL POL1CY OF THE CAP
The market and the price policy of the EC, absorb about 90% of the CAP budget spent in avoiding production surpluses, controlling price prcssincs and subsidising some non-compelilive sectors. I lie íacl lhat only a small part of this budget is oriented Lo the structural policy has created serious additional difficulties for regions with disadvantages in the farm structure (Santos Varela, 1988).
The immediate results of the CAP allowed Europe, a traditional importei" of agricultural produets, to become not only self-sufficient but also to export successively more of ils surpluses. lhe observation ol figure 2.2 shows a high increase in exports of agricultural produets since the early 1970,s followed by a slight decrease belween 1980-1986. This accentuated tendency promoted decreases in lhe real agricultural prices.
The Memorandum of Siena, 1984, proposes that an equilibrium in the agricultural market could only be achicvcd if prices could decrease about 20%. The EC is in a situation of creating structural surpluses in cereais, milk, beef, sugar, wine, olive oil (for detailed values see Santos Varela, 1988). A reorganisation of lhe productive structure of the EC is consequently necessary but such a reorganisation must lake into account the special case ofeountries like Portugal, whose agricultural structure does not have the characteristics referred to above.
Figure 2.2
Agriculluml Expoi ls of (lie USA uiul EC
45,00 -r 40,00 35,00 j=> feO 30,00 25.00 20.00 15,00 10.00 5.00 0.00 -x- o f—H ri ri -f <n VD (- 00 Os O r—l n Cl <n SO r- r- r- t- r- r- t- r- oo OO oo 00 OO oo OO ON ON Os Os Os Os Os Os Os Os Os Os Os Os Os Os ' 1 '—1 ■ 1 '—' ' ' ' ' ' ' ' 1 ' ' [•('(IO) USA
Sonrce; II.W. Moycrand T. Josling, 1990, in:
2.2 PERSPECTIVE FOR FUTURE POLICIES
The expansion of european agricultural aclivily during the past Ivvo decades was characlerised especially by an increase in productive inlensily, by regional and entrepreneurial specialisation of production and a consequent concentration of agricultural aclivily in ever smaller rural areas. This situation developed in a parallel and interrelated forni vvith the problems referred to in the first part of this chapter. Thus, any alteration of the CAP cannot be undertaken exclusively on the basis of the problems of production surpluses and budgetary deficits but must also consider our increasing responsibilily to lhe environment and the equilibrium of lhe ecosyslems (de Haen, 1985). Changes based upon consumer preferences and tasles vvith a tendency towards improved quality, are evidently also of fundamental importance in this process.
Logical suggestions for future agrarian policies should then tend to encourage extensive use ofland resources without at the same time resorting to monocultures. Such encouragement would, however, creale large regional discrepancies and because of market reasons would reduce lhe possibility of increases in farm incomes. These concepts reflect, by their nature, long term tendencies opposed to those that the market imposes and that will be considered to be of short term and are presented belovv;
If we consider agricultural activity in the U.S.A. which until 1985 suffered strong decreases in production, it may be expected that during the
decade of the I99()'s recovciy begins due to a combination of reduclion in lhe value of tlic US dollar and application oflow inlerest rates that permitted llic farmers to survivc situalions ofdcbl crcaled duiing lhe 1970s and 1980s (Drabenslolt and Barchcnia, 1990), On lhe other hand, GA IT negoliations are determinant for the future market tendencies and llie policy promoted by the US for a free trade in world markels is blocked by llie EC and Japan who attempt to delay liberalisation since they fear lhe consequent results upon prices and farmers' incomes. The expected liberalisation of lhe sector will cause a reduclion of world prices leading lo a better use of comparative advantages, in some cases improving the siluation of developing countries bui also crealing strong changcs in lúiropean faimer incomes. According lo projcclions presenteei by Schmidt (1988), it is lo be expected lhal lhesc market considerations and long term tendencies referred to above lead to the development of some agricullural productions as described in Table 2.2.1.
TABLE 2.2.1.
Projections for Areas and Productions of Sonic Agriculíiiral Products (EC 12)
Products Arcas Produclion Arca Produclion
1981 1985 1995 1995 Cercais 36226 150281 30100 160400 Sugar 20.34 1.3730 1500 12000 Gil Sccds 3248 61.31 6000 16000 Nuts 1402 2469 2300 6900 Total 42910 17261I 39900 195300 Source; Schmidt (1988) 27
As far as developing countries are concerned, arguments relative to imports as well as exports of lliese countries have to be considered. Parlicularly in such countries imports in food products are very dependent on EC price policies, US technology and Easl block price variations, so that positive eíTects from trade are directly linked with trade liberalisation in tlie developed countries. l lie risk of increases in their food costs and increases in externai dependence in the sector is very high if "prudent actions to search cost reducing technology change are not taken in the future" (Schuh, 1983). This means that for such countries, economical development would have a more effective basis if settled on the expansion of their agricultural markets, than if the only expectation is to profit from the downward trend of the vvorld prices. Specially with respect lo fruits and vegetables lhe opportunities in lhe future for those countries are related to the consumption of exotic agricultural products in case increases in exports is a goal lo achieve.
Also, the more recent studies that argue against this kind of policy to defend diversification in lhe agricultural sector of their countries and define new targets are very importanl lo be considered (Timmer, P., 1992). They suggest new strategies for the policy makers: first, the stability provided by a well-diversified and flexible agricultural economy; second, the process of diversifying a rural economy as a significant source of income for rural areas; and third, diversifying cropping patterns in order to achieve a more sustainable growth avoiding the dependence crcated by intensive cullivation of single crops.
3. PRODUCTION AINl) PROCESSING OF TOMATOES
The production of processed tomatoes has a characteristic common to the production of ali processed products, i.e. from tlie producer to the consumei", the original product is vvorked up in different procedures and until being consumed is inlluenced by economic forces from three different areas: 1) The demand for food, 2) the structure of supply and 3) the competitiveness of the sector.
Connor etaf, 1985, tried to survey the trends of these economic forces over lhe last decades for lhe food processing industry. It is expected that in the future, assuming that incomes increase, lhe consumption of processed foods will turn inlo a higher demand for frozen products. Consumeis preferences have moved in lhe last 15 years lo fresh vegetables, this is attributed to lhe consumefs increasing concern about health. Processed vegetable in the USA grew very little (less then 1% a year) with the exception of tomatoes that have been more consumed due to the increasing use of ready made food (Vegetable Situalion and Outlook Repoit, August, FRS, USDA, 1987).
The processing sector transforms the ravv product in processed food, adding to it labour and capital. The market structures with its main determinants, supply and demand conditions, support the commercialisation of the final product. So evidently the tomato-processing industry is dynamically interacting with the farmer and consumers' sectors.
It is expanding to internalional dimensions and is facing therefore conslrains of mico) and macro policies. Archibald cl al., lc)85, illuslralc lho dimension of sucli a policy environnienl Jbr lhe íbod processing industry.
Figure 3.2 shows lhe diíTerenl phases and lheir interrelalions up lo lhe point of obtaining lhe final product for lhe tomato-processing industry. Indecd, only a specific analysis of cacii of lhese poinls would allow a conclusion regarding llie capacily ol cach counlry lo vaiy ils production depending upon price incentives or olher financial supports which may be applied to lhe produets.
Our study dedicales more special atlention lo lhe influence lhat variations in minimum giower prices and subsidies to processors could have on variations in production and trade. The reason íor this decision is the íact lhal lhese Iwo factors have been the goal of large interventions by the EC in the lasl dccade.
Eventually a markel study on tomato processed produets should extend itself to ali the varieties of tomato derivatives: peeled, paste, concentrate, catsup, chilli sauce, pulp, puree and juice. This study will deal mainly with lhe produets paste and peeled, sporadically giving some atlention lo olher produets. The reason is the difficulty to obtain time series data lo work on quanlilalive procedures for produets diíTerenl from paste and peeled.
Because lhe inlcnlion of lliis chapler is lo create a working basis for lhe quantitative analyses to be developed later, mainly three groups ol questions will arise:
1. Produclion evolulion in llie diflerenl countries over llie lasl decade (1980 - 1990).
2. Price and subsidy policies related lo lhese products over lhe lasl five years.
3. An analyses of lhe developmcnl ofliade relalions as a consequence oftlie policies reíerred lo above.
The great lack of slalislical information did not allow us to obtain unifonn and coherent data. This obliges us lo accept lhe possible occurence oferrors arising mainly from:
1) Use of diílerenl periods of time as il was lhe case for calendar and agricullural years.
2) Use of diflerenl sources of information like Ilaly and E.C.
3) Cases in which quantilies of olhei kinds of analogous by-products are included in the available information without possibility of distinction (an example is the inclusion of "concentrate" under the heading "paste", in some cases without discrimination).
4) Different data series relative to short periods and of different origins, which have to be pui logelher in order to get values for more extended periods ( the case of some production values).
The data was grouped in countries of common economic characlerislics for the processing of lomatoes. Thus lhe following groups
were created: EC (Greece, Ilaly and France); Spain and Portugal; United States of America; Other Mediterranean Countries (Israel, Turkey and Marroco); and Rest of (lie World.
FIGURE 3 1
PROCESSINa OF TOMATCES: AORICULTURE AND INDUSTRV
PRODUCTTW TECHNGLOO':
CAPACITY aUARANTEHD
PRICES
LAND CULTT. ATED
DIMSICN .AREA
INDUSTRIAL
CL DIA TH SU3sh:ZS
CA=Acrrv
PROCESSING
LABOUR STOCKS COSTS
soa. QuALITY STRUCTURAL SUPPORTS ALTERNATTVE PRODUCTION PRODUCTION PROCESSÃO COMPEtTTION PRICES INTERNAL .ViARKET NtARKETTS EXPORT5 EXTERN AL SUPPLY AND DEKtAND
FIGURI* 3.2
THE POLICY ENV1RONMENT FOR FOOD PROCESSING INDUSTRY
NAriONAi iwAcnoi POIICV f OneiGN policv FOÒO AIO INFL AT ION H AT E MON ETA"' "EGUL ATION VS N ATIONAl IN OU ST RY POllC.Y DEPEGUL ATION IN i i ni ■; i "Al ( [; XGH ANGE
"ATE FOOO AND EA"M TO"
AN TITRUSI EOOO iNOusrnY E A"M SECTOn CONSUME"S CONSUME" POLICV •FOOO STAMPS • WIC FAOM POLICV coMwooiriEs •cnEDiT FOOO iNOUSTnv POLICV •GRAOING FOOO SAFETY COPPO" A I 1; T A X POLICV TAR1FFS QUOTAS COM WE "Cl AL TRADE POLICV IMMIGRAT ION
"ESEARCM AND DEVELOPWF.NT POLICV
3.1 SITUATION ON INTERNATIONAL MARKETS: PRODUCTION AND CONSUMPTION
During the period 1980/1981 production dropped in almost ali countries. This was the result of climatic conditions that especially afí^ected countries in the mediterranean area.
In 1981 production continued to drop, threatening a difficult situation which the EC decided to combat by introducing specific measures to help increase production. A subsidy was guaranteed to tomato processors ií lhey would agree to pay a certain minimum price lo fanners. 1 hese subsidies evidenlly benefitted essentially the Frendi and Italian producers since Greece was still not completely integrated at this stage in the EC.
In 1982, an increase in production of tomatoes for processing is noted in almost ali countries with the exception oí Italy that, due to climatic and management reasons was unable to benefit from an immediate eílect of the measures applied in the preceding year. In the following two years, 1983 and 1984, production progressively increased, attaining the highest values reco rd ed until then. The next two years were characterised by slight decreases in production, 1987 saw a dramatic change in lhe market for processed tomato products in the Mediterranean Basin, specially for paste (Foreign Crop Estimates Division, USDA). For a betler appreciation of these variations Table 3.1.1 was made considering the most important producer countries. The total 1988 production of tomatoes for processing in
Table 3.1.1.
Production of Tomatoes for Processing (Units: 1.000 metric tons)
Country 1979 1980 1981 1982 1983 1984 1985 1986 1987 1988 1989 USA 6649 5634 5186 6622 6377 6967 6511 6707 6895 6639 8200 Canada 416 380 451 490 383 500 480 490 500 520 1000 México 200 220 170 180 190 240 250 300 393 300 400 Italv 3635 3083 3050 2800 4400 5000 3899 2917 2929 3100 3150 France 393 416 377 357 328 340 392 342 23 239 310 Greece 998 1500 1189 1193 1265 1570 1319 706 825 976 1156 Portueal 542 454 386 480 533 620 742 542 421 461 480 Spain 418 499 477 543 878 1080 746 473 571 713 781 Israel 122 166 181 240 295 270 251 196 186 177 150 Taiwan 365 491 274 378 370 na 277 276 225 262 200 Turkev na na na na na na 1100 700 760 900 1050
Sources; Revista do Agricultor. Jan./Fev., 1992
GLW der Kommission der EG, 1987; Foreign Crops Estimates Division. USDA. 1987: and Food and Agriculture Service, USDA. February 1983; February 1985: July 1988;
Table 3.1.2.
Cultivated Areas for Tomato for Processing (Units: 1.000 ha)
Countrv 1975 1976 1977 1978 1979 1980 1981 1982 1983 1984 USA 155.5 125.0 140.3 119.7 130.2 108.2 103.6 119.5 118.2 118. Canada 9.4 9.1 9.5 9.9 9.4 9.9 11.4 11.3 10.9 12.3 México 4.0 3.4 5.0 5.0 5.5 4.5 5.5 5.0 6.0 5.5 Italv 1) 112.1 96.2 107.9 111.5 na na na 124.0 138.0 150.0 France 10.0 6.0 5.7 6.7 9.6 9.2 8.9 8.9 8.3 8.4 Greece 20.1 10.1 16.5 20.8 19.3 18.8 19.7 22.4 28.1 27.9 Portugal 23.5 17.5 21.5 21.3 19.3 18.4 14.0 17.5 20.0 22.0 Spain 26.0 15.4 20.0 19.7 14.6 14,0 15.9 22.3 23.0 28.2 Israel 4.5 3.3 3.9 4.9 na na na 4.9 6.2 5.7 Taiwan 4.6 2.2 2.4 2.4 na na na 5.3 7.7 8.5 Turkev 25.0 25.5 26.0 26.0 26.0 26.0 26.3 na na na
Sources: Foreign Crops Eslimales Division. USDA. 1987; and Food and Agriculture Senice. USDA. April 1979 ; July 1981; Februan- 1985; Note: 1) Includes fresh lomalo areas
seven major producer countrics of llie mediterranean basin was about 8% more then in the previous year. Table 3.1.2, illustrate lhe repercussion of lhe loca! increase in production of tomatoes upon the percentage of areas dedicated lo this culture.
The processing industry consumes almost ali the produced tomatoes in paste and peeled. Figures 3.3 and 3.4, at the end of the chapter (54, 55, 56 and 57), show the developmcnl lhat lhese finished products had in different countrics during the lasl 10 years.
At lhe moment it can be referred that the production of the USA is about 50% of the workfs total. European production is mainly in the product concentralc for which llaly conlributes wilh about 60%.
In EC the biggest consumers are England and Germany. AJso in France, Holland, Canada and Japan as well as ex-URSS and Middle East lhe consumption is high.
3.2 PRICE ANI) SUBSIDIES POLICIES FOR TIIE SECTOR
As was already reíerred to in lhe second chapter of this work, lhe recent enlargement of lhe EC puis it into a very significant position in lhe world exports of agricultural products. Tomatoes for processing belong to tlie group of products that highly contribute lo this position bui they have been also heavily supported. To liave an idea, from 1985 to 1986 this value liad dccreased from 835 inillion ECTCs to 429.2 of vvhich 250.4 were atlributed to lomato piocesscd products (RG Komission, 1987). On lhe other sidc lhe importance of lhe US as an exporler and the capacity of american production lo compele al a médium term wilh produclion supported by governmental policies has been questioned (Schwartz, 1986).
The system lo support production and processing is constiluted both of internai regulalions and customs protection. We will describe three types of instruments of the agricultural policy: prices, import controls and subsidies that were channelled to this sector during lhe period 1978 up to 1989:
Up to 1977 there were few incentives to production and trade in processed fruits. These had import levies stipulated on bases of sugar content as its only protection.
The introduction of a processing aid scheme appeared in 1978 and was applicable to lomato concentrale, peeled tomato and lomato juice. Subsidies to processors who contracted growers to produce at pre-defined
minimum prices, were introduced. Laler there was an extension of the support system to frozen tomatoes and tomato llakes.
The basic regulation of the Common Market Organisation (CMO) to which processed tomatoes belong is the Reg, N0. 516/77 laler modified by Reg. N0. 3454/80. These regulations serve many other products besides tomatoes; dried figs, sultanas, horticultural products prepared with or without sugar, fruit juices and other processed vegetables. They establish the trade regime, the production supports and the prices to be considered for ali products. In this case lhe trade regulations allow the mechanism of compensatory amounts to be applied to these products in order to ensure the preference for the european products. The prices and production supports are interdependent . Financial support is given to the processors that on a contract basis will pay lhe growers a minimal pre-defined price. Such minimal price is stipulated considering both, the price levei of the previous campaign and the evolution of the production costs of the sector. The subsidy paid to the processors is fixed so as to compensate the difference between lhe price levei of these products being produced in the EC and the levei of them coming from the world markets (Santos Varela, 1987).
In May 1979, Spain, Trance, Greece, Italy and Portugal set together to found AMITOM, an international mediterranean association for processed tomatoes. l he objective was lo stimulate lhe improvement of quality and the organisation of the market of such products ( Miklichansky, 1980). But the costs of supporting increasing production obliged to the introduction of
quotas in 1982. A maximum of 4.7 million tons production of fresh tomatoes was allowed, of which 3 million were destined to concentrate and 1.3 to peeled.
Later, in 1984, more adjustments had to be made when the accession of Portugal and Spain into EC made a new competitive situation evident. There was a reduction on processing subsidies and a new basis for their calculation (net wcight was used instead of gross weight). Also lower minimum grower prices and a definition of quality criteria were established. In the case of Greece a contínuos increase of the Minimum Guarantee Price (MGP) is notcd with small varialions since 1984 for ali producls cxccpt crushed tomatoes. Aller 1987 ali producls are included in the communitary system.
For the next period, 1985/1986, the new limiting quotas were defined for each country. Italy was restricted to 3.8 million tons of raw tomatoes and Greece to 1.4 million tons eligible for subsidies. Table 3.2.1 reports the EC quotas for processed tomalo producls during lhe 1988/1989 season. The situation of Portugal and Spain is reduced basically to the area of concentrates and peeled. The levei of practised MGP^, was still considerably low.
In lhe period from 1983 up to 1985, particularly in lhe case of concentrates, for EC(9) and for Greece gross decreases in subsidies are observed. Greece suíTered during tliis period from more drastic measures
than did lhe other inember couiitries. For crushed and concentrate products and aíler slight increases, lhe subsidies show a very attenuated decrease in 1987. Greece which since lliis year is totally inlegrated in lhe EC benefíts from increases in ali products.
TABLE 3.2.1.
EC Quotas for Processei! Tomato Products Raw Material Usage, 1989-1991
Countries 1989 1990 1991 1989-1991 Italy 1.655.000 1.655.000 1.655.000 0 Grccce 967.000 967.000 967.000 0 Francc 298.622 278.691 278.691 -0.07 Spain 370.000 500.000 550.000 +0.49 Portugal 685.000 747.445 832.945 +0.22 EC12 3.975.622 4.148.636 4.283.636 +0.08
Sourcc; Group dc Travail dcs Politiques ct des Marches Agricolcs (1991) "Silualion and Perspectives of lhe Tomalo Markcl in lhe OECD", OECD.
Also still in lhe area of processing subsidies, those attributed to Portugal and Spain were very much lower than those practised in other member countries. ll must be noted that this large diíTerence in the price and subsidy policy will disappear up lo lhe year 1993 in which integration of these two countries will be completed. This levelling of supports suggests that either Portugal and Spain will bencíll from lhe high increases in MGI^s and subsidies, renewing record leveis of european production, or the support system will have to be reduced to the other member síates. For a complete illustralion of these values, Table 3.2.2 and Table 3.2.3, supply the information on guaranlee prices and subsidies in use up lo 1989 and 1993 respectively.
TABLE 3.2.2.
Variations in Producer Prices (Units: ECU / m. tonne)
Countn- Tvpes 1981 1982 1983 1984 1985 1986 1987 1988 1989 EC9 la 155.1 165.2 169.3 167.6 162.6 154.5 147.5 147.5 147.5 1b 117.0 124.6 127.6 127.6 123,8 117.7 113.5 113.5 113.5 2 97.1 103.1 105.6 105.5 102.4 94.7 89.1 89.1 89.1 3 92.8 98.8 101.3 100.2 97.2 92.3 89.1 89.1 89 1 Greece la 110.6 125.8 137.1 143.5 147.0 147.1 147.5 147.5 147.5 1b 78.4 90.7 100.0 107.0 110.5 111.3 113.5 113.5 113.5 2 65.4 75.3 84.3 88.5 91.4 89.6 89.1 89.1 89 1 3 61.0 70.6 78.1 83.0 86.1 87.1 89.1 89.1 89.1 Spain la 55.1 na na na na 79.4 87.8 99.7 111.6 3 na na na na na 53.6 57.9 64.2 70.4 Portugal 3 na na na na na 58.1 61.6 67.1 70 4 U.S.A. ns 56.0 70.9 75.4 82.4 88.5 na na na Israel ns na 85.5 na na na 74.5 66.1 na na
Sources: L. Garoyan. K. Moullon (1987) "The Processing Tomalo Indiuslry in Greece", University of Califórnia. Berkeley. USD A Horticulture and Tropical Products Division. FAS. September 1985. August 1986. July 1988. and August 1989.
TABLE 3.2.3.
Variations in Subsidies (Units: ECU / m. tonne)
Countrv T\pes 1985 1986 1987 1988 1989 1990 1991 1992 1993 EC9 la 124.1 117,5 115.8 116.7 114.4 na na na na 1b 90.8 86.4 82,3 83.2 80.7 na na na na 2 47,9 38.9 37,0 na na na na na na 3 270.0 282.6 297,3 326.9 317.2 317.7 312.6 309,8 292,9 Greece la 83.1 87.3 115.8 na na na na na na 1b 63.2 68.1 82,3 na na na na na na 2 33.2 30.7 37,0 na na na na na na 3 338.8 259.8 297.3 326.9 317.2 317.2 242.9 275.0 292.9 Spain la na 39.2 35,7 52.6 68.3 na na na na 3 na 157.3 172,7 179.6 207.8 207.8 242.9 275,0 292,9 Portuaal 3 (64.5) 184.3 194.4 196.8 220.1 220.1 251.2 279.1 292.9
Sources: USDA Honiculmre and Tropical Products Division. FAS. Seplember 1985, August 1986. July 1988. and August 1989. Eng. T. Costa Neves, INGA, Lisboa (1992) Personal Communication.
Note: T>pe.s: la = Peeled S. Marz.; 1 b = Peeled Roma. 2 = Crushed. 3 = Concentrate na = Data not available.
3.3. FRADE FLOWS AS A RESULT OF POLFFICAL MARKET REGU LATIONS
From an analyses ofthe evolution of tlie export values ol tomato pasle and peeled tomatoes, presented in Tables 3.3.1 and 3.3.2 we conclude the following:
1) A growing increase in the lotai values of world exports, except for the years 1983-1985.
2) Portugal and Spain show an accenluated tcndcncy lo export incrcases.
3) The US have an interesting situation due to the decrease in exports of paste.
4) The exports of Taiwan show the grealesl expansion rate, having almost doubled in the period between 1981 and 1986.
5) Large increases in the total value of exports of peeled tomatoes, particularly notable in lhe european exports.
ó) Since 1983 existence of new leveis of exports of peeled tomatoes in Spain, Taiwan and Other Mediterranean Countries.
We have tried to analyse the signifícance of exports of tomato paste in the total production of tomatoes for processing. The ratio Export/ Produclion indicated in Table 3.3.3 represenls such variations.
The ratio shows an evolution characterised by a slope alter 1985, a period in which production did not increase so spectacularly but exports of paste kept on finding markets. In 1989 this tendency stopped.
Ilaly is by far lhe llrst producer of lhe CC. It is íbllowed by Greece, Spain and Portugal. Therefore we consider that it would be interesting to calculate the evolution ofthe same ratio just for Italy.
In our opinion, lhe inílucnce ofthe accession of Portugal and Spain on the trade in processed tomatoes plays a most important role in this work. The fact that the EC is the world leader in the market of processed tomatoes and that the leveis of participation of Portugal and Spain in this market are also very high, makes it difficult to forecast the long term iníluence that the extension of the communitary regulations lo these two countries will have on lhe trade of these products.
TABLE 3.3.1.
Exports of Tomato Paste (1,000 metric tonnes)
Countrv 1982 1983 1984 1985 1986 1987 1988 1989 EC10 150.1 211.4 202,0 168.4 209,9 361,9 474,7 401.0 Port & Sp 89.3 61.7 52.5 74,2 96.5 141.2 132,0 141.0 U.S.A. 12.0 11.6 3.2 2.8 2,7 na na na OMC 17.6 20.4 30,1 26.4 24,3 na na na Taiwan 21.6 42.3 42,8 57.8 41.0 33.4 30,0 29.9
Source: USDA Horliculture and Tropical Products Division, FAS, Febmary 1982; June 1988. NMEX
Externai Trade Slatislics for Portugal. France and Ilaly.
TABLE 3.3.2.
Exports of Peeled Tomatoes (1,000 metric tonnes)
Countrv 1982 198? 1984 1985 1986 1987 1988 1989 | EC10 401.5 412.4 374.7 396.2 479.3 453.6 489.7 503.8 Port &. Sp 12.3 46.3 73.9 82.8 69.5 48.7 52.0 60.0 U.S.A. na na na na na na na na OMC na na na na na na na na Taiwan 2.3 6.1 9.9 18,7 11,8 6.8 7,0 6.1
Source: USDA Horticulture and Tropical Products Division, FAS, February 1982: June 1988. NIMEX
Table 3.3.3
Variations in Contribution of Exports in the Total Production of Toniatoes
(EC, 1982 to 1989) Production (1000 mt) Exports of Paste (1000 mt) Exp / Prod. Ratio 1982 5,373 290.6 0.05 1983 7,404 347.4 0.05 1984 8,610 330.6 0.04 1985 7,098 329.6 0.05 1986 4.980 374.4 0.08 1987 4,769 536.5 0.11 1988 5,489 636.7 0.12 1989 5,877 571.9 0.10 (Italy, 1983 to 1990) Production (1000 mt) Exports of Paste (1000 mt) Exp / Prod. Ratio 1983 2,282 252.0 0.11 1984 3,092 274.5 0.09 1985 2,111 306.4 0.15 1986 1,502 267.0 0.18 1987 1,555 244.0 0.16 1988 1,567 249.1 0.16 1989 2,063 270.1 0.13 1990 1,842 263.1 0.14
Source; Ovvn calculations based on data from MICOFEL, C.F.C.E., Bulletin mensuelle, 12/92
In principie it is not to be expected that the situation that occurred afler the accession of Greece will repeat itself in lhe case of Portugal or Spain, since the starting positions with respect to the MGP's and subsidies now offered are very different from those of the early 1980's. The altitudes of agricultural policies, at that time directed to improving production leveis in the southern regions, are now primarily oriented by the necessity of avoiding creation of surpluses. On the other hand, if we consider the exporl leveis, the Spanish fraction of the market being similar to that of Greece for paste and much superior for the peeled product, we have to recognise that Spain is in a much more advantageous position to benefit from the price and subsidy policy. In these countries a combination of factors not only related lo the possible externai supports, will be determinant in the establishment of output variations and possible trade conílicts in the enlarged community.
These factors are; 1) Incidence upon externai trade: a) Disappearance of export subsidies after 1986 (Spain); b) Application, since 1986, of the Common Customs Tariffs (CCTs) wliich impose advalorem duties on imports from third countries (Schwarz, 1987) restricting import of products from non-EC countries; c) Elimination of custom barriers within the EC (for Spain from 1993, for Portugal since 1990). 2) Incidence upon internai production: a) Application of MGP^ initially substantially below that for the rest of the EC countries, becoming equal to these in 1993; b) Varying processing subsidies; c) Application of production quotas during the first four years of membership: Spain, 667000 and Portugal, 694137 m.tons of tomatoes for processing.
3.4. COMPETIT1VENESS AND CONSTRA1NTS IN THE WORLD FOR THE TOMATO PROCESSING INDUSTRY
It is not our intention to present here an international market study, since that work has been carefully developed by K. Moulton and we would not do any better then to repeat and resume his research in the area. However for the purpose of convenience and based on data obtained mostly in his work we have prepared Appendix 3.4 in which the information relative to production structure of the tomato processing sector for different countries may be found.
We have observed that mainly the mechanisation levei and the production costs are very distinct from country to country and that problems and constraints are related in one forni or the other with each of their structures.
We have seen that production in Italy, the leading producer in Europe, can not adjust easily to high mechanisation leveis due to size of the farms. The fact that farmers will benefit from profits only if production reaches the levei of 700 kg/ha which at the moment is 550 kg/ha (Silvestri and Siviero, 1986) and the barrier caused by farm size obliges the country to face progressively more rentability problems.
Tomatoes for processing is still a first choice alternative for farmers in countries like Taiwan or Turkey. In Turkey there is an optimistic outlook in
spite of two major problems: lhe first is lhe subsidies system that suppoits other alternative crops to tomatoes as sunflower and wheat (see Buelbuel, 1988) and lhe second, and more important, is lhe very high cost of financing the industry.
In 1988, considering an inflation rale of about 60%, the interest rate for loans for commercial purposes was as high as 100%, making investments practically prohibitive so that only those firms belonging to holding companies that had their own access to capital (USDA, FAS, July 1987) were able to surmount such a financial crisis. Nevertheless expansion is expected, accentuating a concentration tendency of the processing industry to grow fewer and more powerful firms.
Due to currency devaluations and inflation, Israel runs risk of having a stagnating industry that is also characterised by its high degree of technical sophistication in the fields. The best farms get 80 - 120 mt/ha and about 30% - 40% of ali fields are machine harvested (see Runsten and Moulton,
1988).
The expected direct influence of mechanisation upon production leveis and consequently upon international market shares has shown itself as debatable in the case of the USA, namely Califórnia, where many factors have contributed to change the competitive position of californian industry (see Runsten and Chalfant, 1988).
Traditional producer countries such as Portugal that could oíler comparative advantages in lhe past (due to climatic conditions, cheap labour costs, irrigation possibilities) have to deal now with lack of competitivity since the present processing structures do not oíTer processors lhe guarantees of constant incomes and are, therefore, desperately seeking new production technology.
Also to consider is the fact that the expected decreases in supply resulting from difíerent policies in Europe may very well be replaced by new lower cost productions from other countries that are not traditional producers like México, Tunísia, Turkey and Thailand.
A sludy made by Montigaud et al. (1987) tried to analyse constraints and points of strength of several processed fruits and vegetable systems including the tomato sector. According to these authors the structures of five processed fruits and vegetable systems (tomatoes, peaches, onions, plums and mushrooms) in France have sensitive points that are points of constraints, of advantage and of regulation. In the tomato processing industry constraints are the necessity of technical innovation and the "requirements of the central buying offices of the retail industry that lay more and more on the system through prices, quantities, products or services".
However, such constraints meei several points of regulation, namely the diversification of the farming systems, the inter-profession and the reaction of the processing firms; considering their possibilities of
reallocations, of manufacturing high added value products or even increasing investments to save labour.
Figure 3.3 (1)
Production of Tomato Paste in Metric Tons
1000 900 800 700 600 500 400 300 200 100 o vo Cs r- oo Os O ■—' (N ro ■+ •n SO r- ao Os o <N -t so so so r- r~- r- r- r- r- r- r~ oo oo OO OO OO 00 as as Os Os Cs Os Os Os Os Os Os as as as Os OS Os as Cs
■—< r—l *—* •—t i—H •—< i—' •—< r—l >—< r—< f—• I—< •—< *—*
■ USA • 1TALY 0 GREECE 0 PORTUGAL
Source: Horticultural and Tropical Products Division
Figure 3.3 (2)
Production of Toniato Paste in Metric Tons
100 -r 90 -- 80 70 60 50 40 30 20 10 *
■X FRANCE "" SPAIN 1 ISRAEL X TAIWAN
Source: Horlicultural and Tropical Products Division
Figure 3.4 (I)
Productíon of Pccled Tomato iu Metric Tons
1.200 1.100 1.000 900 800 700 - 600 500 400 CM CO r^- r^- LO r^ CD r- r^- CO O) o ,— CN co O" r^ r- r- CO CO CO CO CO CD CD CD O) cr> cn CD CD CD CD CD CD CD r ' ' ' T— r~ T~ T- r~ i USA ITALY
Source: Horticullural and Tropical Products Division
300 285 270 255 240 225 210 195 180 165 150 135 120 105 90 75 60 45 30 15 0 Figure 3.4 (2)
Production of Pccled Tomato in Metric Tons
-x i -T x— - ---X í- CN r- O) o d co r- co in co CD r- co r- co CO r- co co r^- co O co co co co CN co CO —o PORTUGA SPAIN GREECE ISRAEL -X- -x- ERANCE TAIWAN CO CO CO CO CO
Source; Horticultural and Tropical Products Division
4. THE USE OF A SIMULATION MODEL FOR PROJECTIONS OF INTERNATIONAL TRADE PATTERNS
4.1. SELECTED STUD1ES AND SELECTION OF SIMULATION MODEL
4.1.1. The impact that the european agricultural policies have upon international trade in the sector became of a more generalised interest when the established market situation was altered by the integration of Greece, Portugal and Spain into the EC.
This promoted much research about the farm sector as a whole and of its subsectors in particular and both studies of equilibrium within the international trade markets as well as studies of the possible reactions within the national economies were undertaken. Empiricism was frequent and many studies were based on a very narrow quantitative support (Hinten, 1978; Hormann, 1977; Montigaud, 1983). Initially, in attempts to describe the reílexes of expected politicai changes on the subsectors, models of the optimisation type were chosen to develop a quantitative analysis (linear and quadratic programming).
Examples are the studies concerning the european market for stone- fruits published by Weindlmaier (1976) or the analyses of the effects of the enlargement of the EC. to Portugal and Spain upon the portuguese farm sector made by Brito Soares (1981). These sort of optimisation models.
called normative, are essentially prescriplive and therefore generally used to suggest the optimal utilisation of resources, to propose adjustments and specify cost minimising methods, or to solve related problems. 'J he approach is, however, the object of many criticisms related to the restrictions it imposes when estimates of the effects of diílerent politicai decisions in a given system are desired. Quantitative effects, resulting from real applied agricultural policies, have been a major concern since 1980 (von Alvensleben, 1980).
With the increased availability of advanced computational techniques, new static or dynamic methods based on simulative experiments have been increasingly used to describe agricultural systems and suggest alternative solutions.
Simulation is essentially a technique that attempts to model a real system, considering mainly the relations to be observed and experimenting on it with the manipulation of variables, called instruments. In such a mathematical model, the interactions among the components of the system are first defined and are checked by comparison of the computed results obtained with ali important available knowledge and statistical data. When an acceplable representation is achieved, usually after several trials with the instrumental basis, it serves as a point of departure for the typical phase of a simulative study: the projections.
The first example wc want to rcfer lo is llic study of Sarris (1983), for whom "the impact of EC enlargement on trade of fruits and vegetable products seems to be a area of speculation with a few hard numbers to support the arguments", and who tried to surmount this gap by simulating parameters related to lhe international trade of the farm sector for the most important products involved in the integration problem. His model aggregates the different products and goes later into the details of the ones of his particular interesl. Because of its complexity the model does not allow considering onc product individually. And, as lhe author himsclf commcnts, the emphasis on specific products makes such an analyses impossible due to the missing disaggregated data.
Tangerman (1982) has attempted to overcome such difficulties by using a syslem with simplc algorilhms lo reílect a market equilibrium situation with linear functions and reproduce a small number of parameters for a few restricted, well-defined products. Since then this type of simulative study has been much used in market studies of products for which dynamic factors do not seem to play a dominant role (von Alvensleben and Behr, 1986; Frenz and Manegold, 1986). The attraction of this approach lies in its simple presentation as well as in the fact that using a methodology of comparative statics always permits lhe introduction of changes in its cxogenous variablcs.
Based in very similar principais as those models are the much more recent models MISS developed in Rennes, France, in order to evaluate and
quantiíy eífects of EC and USA trade liberization. The analyses entails the estimation of politicai preference weights, game theory, a partial equilibrium world trade model based on the year 1986 ( Mahe, Roe, and Johnson, 1991) for eight commodities.
The study we are presenting follows the methodology of Tangermann (1982) and offers quantitative methods to support possible changes in the market of tomato processed products. In its methodology it is very close to the MISS model with limitations in the amount of policy parameters used and because it stayed restricted to the paste product. Cross relations between these and other alternative crops were not our concern.
In spite of the importance of tomato production for the farm sector of the mediterranean region and its intimate relationship to the food industry, the product has not yet received due attention by quantitative studies specially in Europe. In the United States several studies appear (Brandt, 1981; Melnick, 1985; and Logan, 1985). Yet some authors have seriously studied the marketing chances of such products (Bavarez, 1985; Miranda de Oniz; 1979 and the Centre Trancais du Commerce Exterieur, 1977). Schwartz (1986) discussed the theoretical basis lo motivate market changes. Moulton, in several studies, has extensively examined the market conditionalisms of different countries offering excellent evaluations of the international situation in the production and trade but without the intention of providing quantitative prognosis.