F
ACULDADE DEE
NGENHARIA DAU
NIVERSIDADE DOP
ORTOMechanical Characterisation of an
Organic Phantom Candidate for Breast
Tissue
Ana Margarida da Silva Teixeira
Mestrado Integrado em Bioengenharia
Orientador: Pedro Alexandre Lopes de Sousa Martins Co-orientador: Nilza Alexandra Gomes Ramião
c
Resumo
A mama é um órgão vital para as mulheres e as patologias associadas à mama, como o cancro, são muito frequentes. O cancro da mama é um dos cancros mais comum nas mulheres, sendo 25% de todos os tipos de cancros e afeta 1.38 milhões de mulheres por ano, no mundo.
A mama é composta por tecido adiposo, fibroso e glandular. Os ligamentos suspensórios são também estruturas importantes na mama, responsáveis pelo seu suporte. A mama é um orgão que sofre constantes alterações, de acordo com a idade da mulher, o seu ciclo menstrual, a menopausa, a gravidez/amamentação, terapia de hormonas e o seu índice de massa corporal. Estes fatores causam modificações em todos os diferentes tecidos e existem alterações visíveis no tamanho e volume da mama e na sua sensibilidade, por exemplo.
Na literatura, os tecidos mamários normais, como o glandular, o fibroso e o adiposo, têm sido estudados, assim como o tecido patológico. Sabe-se que na presença de uma lesão, o tecido pa-tológico torna-se mais rígido do que o normal. Assim, as propriedades mecânicas desses tecidos têm sido alvo de investigação, o que pode levar a melhorias no diagnóstico de cancro, no planea-mento de cirurgias e em trataplanea-mentos estéticos.
Para análise de imagem, materiais para mimetizarem os tecidos são muito importantes para desenvolver novos sistemas, permitindo treinar, calibrar, testar e validar novas técnicas. Os mate-riais mais comuns são o agar, a gelatina e o silicone, no entanto estes matemate-riais ainda apresentam algumas desvantagens. Reproduzir as propriedades mecânicas, acústicas e óticas em biomaterias está a ser alvo de estudo para alcançar uma replicação mais realística dos tecidos mamários.
A agarose, componente principal do agar, tem sido estudada para regeneração dos tecidos dev-ido às suas características únicas, como a sua excelente biocompatibilidade, termoreversibilidade, comportamento de gelificação e características físico-químicas.
Assim, o objetivo desta dissertação é analisar as propriedades mecânicas da agarose, de modo a avaliar se é um bom candidato para mimetizar o tecido mamário. Concluiu-se que a agarose pode mimetizar os tecidos mamários no que diz respeito à elasticidade, ajustando as concentrações de agarose utilizadas de acordo com o tipo de tecido que se quer replicar.
Abstract
The breast is a vital organ for women and the pathologies associated to it such as cancer are very frequent. Breast cancer is one of the most common cancers in women, being 25% of all types of cancers and affects 1.38 million women per year, worldwide.
The breast is composed by adipose, fibrous and glandular tissues. The suspensory ligaments are also important structures in the breast, being responsible for the support of the breast. The breast is an organ that is always in continuous change, according to the age of the woman, her menstrual cycle, menopause, pregnancy/lactation, hormone therapy and her body mass index. These factors cause changes in all the different tissues and there are visible alterations in size and volume of the breast and in its sensibility, for example.
On literature, normal breast tissues, such as glandular, fibrous and adipose, have been studied as well as pathological tissue. It is known that in the presence of a lesion, the pathological tissue become stiffer than the normal one. Therefore, the mechanical properties of those tissues have been a target of research, which led to improvements in the diagnose of cancer, in the planning of surgeries and in aesthetic treatments.
For image analysis, tissue-mimicking materials are very important to develop new systems, allowing the training, calibration, testing as well as validation. The most common materials are agar, gelatin and silicone, however they still present some drawbacks. Reproduce the mechanical, acoustic and optical properties in biomaterials is being a target for research to achieve the most realistic replication of breast tissues.
Agarose, the main component of agar, has been studied for tissue regeneration, due to its unique features such as excellent biocompatibility, thermoreversible gelation behaviour and phys-iochemical features.
Thus, the goal of this dissertation is to analyse the mechanical properties of agarose, in order to evaluate if it is a good candidate for a phantom of breast tissue. It was concluded that agarose can mimic the breast tissues concerning elasticity, by adjusting the agarose concentrations according to the type of tissue that is desired to replicate.
Acknowledgements
This work was only possible with the help of my supervisors Pedro Martins and Nilza Ramião, who always supported me and encouraged me during this time. Thank you for your availability and for the advices to solve the problems that have appeared.
I also have to thank to António Diogo André and Sérgio Pinto, who helped me in the laboratory on the practical issues.
For last but not least, thank you to my family, specially to my parents and my brother, and to all my friends, who supported me and motivated me all the time during this journey.
Ana Margarida Teixeira
Contents
1 Introduction 1 1.1 Overview . . . 1 1.2 Motivation . . . 2 1.3 Objectives . . . 3 1.4 Structure . . . 4 2 Literature Review 5 2.1 Changes in Breast Tissue Structure . . . 52.2 Characterisation of the Mechanical Behaviour of Breast Tissues: Basic Concepts 6 2.2.1 In VivoExperiments to Determine Material Properties of Breast Tissue . 9 2.2.2 Ex VivoExperiments to Determine Material Properties of Breast Tissue . 11 2.3 Phantoms for Breast Tissues . . . 15
3 Experimental Procedures 19 3.1 Agar/Agarose . . . 19
3.1.1 Basic Concepts . . . 19
3.1.2 Production of Agarose: Methodology . . . 21
3.2 Materials and Methods . . . 22
3.2.1 Samples preparation . . . 22
3.2.2 Measurement Protocol . . . 22
4 Results 25 4.1 Mathematical Approach . . . 25
4.2 Statistical Analysis . . . 26
4.3 Effects of preload, preconditioning, hydration and velocity test . . . 26
4.4 Agarose as phantom . . . 36
5 Discussion 41 5.1 Mechanical properties of agarose . . . 41
5.2 Agarose and the other phantoms of breast tissue . . . 42
5.3 Agarose as phantom of breast tissue . . . 44
5.3.1 Hyperelastic parameters . . . 48
6 Final Conclusions 49 6.1 Conclusion . . . 49
6.2 Future Work . . . 50
A Calibration of the Compression Machine 51
viii CONTENTS
List of Figures
1.1 Anatomy of the breast . . . 1
1.2 Tissue properties covered by agarose . . . 3
2.1 (a) Breast anatomy; (b) Mammary glands . . . 5
2.2 Mechanical behaviour of linear elastic and hyperelastic materials . . . 7
2.3 Hysteresis Loop . . . 8
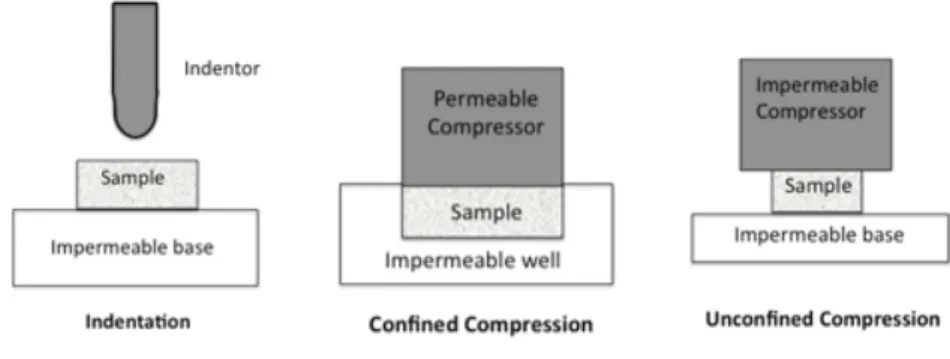
2.4 Schematic representation of a) indentation test, b) confined compression test, c) unconfined compression test . . . 9
2.5 Experimental Setup used by Krouskop et al. . . 12
2.6 Experimental set-up used by Wellman et al. . . 13
2.7 Experimental set-up used for block shape samples . . . 14
2.8 Experimental set-up used for slice samples . . . 14
3.1 Molecular structure and self-gelling property of agarose . . . 21
3.2 One batch of powder agarose produced . . . 21
3.3 Metal punch (left) and mould (right) to prepare the samples . . . 22
3.4 Compression machine (a); support and a sample inside (b) . . . 23
4.1 Example test curve of stress/strain/displacement showing direction of load-ing, relaxation and unloading segments (indicated by arrows) and defined tangent moduli (red dashed lines) . . . 26
4.2 Stress-strain curves for each velocity of preconditioning for each preload and de-formation used: 0.005N and 10% (a); 0.005N and 5% (b); 0.01N and 10% (c); 0.01N and 5% (d). In general, the graphs show that increasing the velocity, the Young’s modulus increases. . . 28
4.3 Stress-strain curves of the effect of saline solution in deformation (a), preload (b) and preconditioning velocity (c). The deformation and preconditioning velocity were the most influenced by the saline bath . . . 29
4.4 Stress-strain curves to evaluate the test velocity when preconditioning is (b) or is not applied (a). The test velocity influences more when there is preconditioning . 29 4.5 Stress-strain curves of the effect of preload and deformation with a velocity of preconditioning of 1mm/min (a), 3mm/min (b) and 5mm/min (c). When the ve-locity of preconditioning is 1mm/min the influences of preload is more notorious, meaning higher preloads higher elastic modulus and stress. The deformation did not influence the results . . . 30
4.6 Stress-strain curves for each type of preconditioning for agarose concentrations of 1% (a); 1.5% (b); 2% (c); 4% (d). Increasing the concentration, the Young’s modulus and stress increase as well. Also, increasing the velocity this parameters increase . . . 37
x LIST OF FIGURES
4.7 EI, EII and Fmax versus agarose concentration, respectively: (a), (b) and (c). All
these parameters increase with the increase of concentration and, for each
concen-tration (mainly high concenconcen-trations) , with the increase of velocity. . . 39
A.1 Stress-strain curves: a) for the EPS13 with the division of each region; b) for
EPS13 and EPS28 . . . 52
A.2 Experimental set-up after precompression (a) and at the end of the test (b) . . . . 52
List of Tables
4.1 Conditions for the tests . . . 27
4.2 Results obtain for each condition used. EI, EII and maximum force are presented
as mean±sd . . . 31
4.3 Statistical results to compare the effect of the use of saline solution. *significantly
different with p-value < 0.05 . . . 33
4.4 Statistical results for the preload: 0.01N vs. 0.005N. *significantly different with
p-value<0.05 . . . 34
4.5 Statistical results for the deformation: 5% vs. 10%. *significantly different with
p-value<0.05 . . . 34
4.6 Statistical results for preconditioning velocities. * significantly different with
p<0.05. (1) 1mm/min is significantly different from 5mm/min and 10mm/min with p<0.01 and from 3mm/min with p<0.001; (2) 1mm/min and 3mm/min with p<0.01 and 1mm/min and 5mm/min with p<0.001; (3) 3mm/min is significantly different from 1mm/min with p<0.05, 10mm/min is significantly different from 1mm/min with p<0.01 and from 5mm/min with p<0.05; (4) 1mm/min and 5mm/min with p<0.05; (5) 1mm/min is significantly different from 3mm/min with p<0.05 and from 5mm/min with p<0.01; (6) All are significantly different with p<0.001, ex-cept between 3mm/min and 10mm/min (p>0.05) and 10mm/min and 5mm/min
(p<0.01) . . . 35
4.7 Statistical results for the velocity in the final test: 1mm/min vs. 3mm/min.
*sig-nificantly different with p-value <0.05 . . . 35
4.8 Statistical results to compare the effect of preconditioning at each preload and
velocity of test. *significantly different with p-value < 0.05 . . . 36
4.9 Results for the Young’s modulus EIand EIIas well as for Fmax, for each
concen-tration. The results are presented as mean±sd . . . 39
5.1 Results review for the Young’s modulus obtained for other materials used as
phan-toms of breast tissue . . . 43
5.2 Young’s modulus review for different types of human breast tissues reported in
literature (mean(±sd) kPa) . . . 46
5.3 Statistical analysis between different concentrations of agarose and each type of
tissue studied by Samani et al. at 5% deformation and velocity of 6mm/min;
*p-values<0.05 . . . 47
5.4 Statistical analysis between different concentrations of agarose and the types of
tissue studied by Samani et al. at two different tests: 5% deformation at velocity
of 1mm/min and 3mm/min; *p-values<0.05 . . . 47
A.1 EPS sample’s properties . . . 52
xii LIST OF TABLES
Abbreviations and Symbols
DCIS Ductal Carcinoma in situ
IMC Invasive Mucinious Carcinoma
ILC Invasive Lobular Carcinoma
IDC Invasive Ductal Carcinoma
EPS Expanded Polystyrene
US Ultrasound
MR Magnetic Resonance
NMR Nuclear Magnetic Resonance
DIET Digital Image Elasto Tomography
CT Computerized Tomography
ε Strain
σ Stress
ν Poisson’s ratio
EI Young’s modulus at initial linear region
EII Young’s modulus at second linear region
sd Standard deviation
PVA Polyvinyl Alcohol
PVC Polyvinyl Chloride
PEG Polyethylene Glycol
Chapter 1
Introduction
1.1
Overview
The breast is an organ constituted mainly by glandular, adipose and fibrous tissues, being therefore
an heterogeneous structure (figure1.1). Each breast presents lobes of compound glands that are
embedded in fibrous and adipose tissue [1].
Figure 1.1: Anatomy of the breast. Adapted from [2]
The Cooper’s ligaments are composed by closely packed collagen fibre bundles oriented in a
parallel fashion [3] to provide support and hold the breast in place, which consequently influence
the shape and the contour of the breast [1].
The woman breast undergoes a series of changes throughout the life span. Factors such as age, menstrual cycle, pregnancy, hormone therapy, menopause and others, influence the structure and the morphology of the breast, and consequently its biomechanical properties. Studies that have been made over the past decades show that the intrinsic elasticity of any soft tissue is a property
that changes under pathological processes such as cancer [1], [4], [5]. The elastic modulus of soft
2 Introduction
tissues depends on the microscopic and macroscopic structural organisation of their molecules
and, in the presence of a pathology, the structure undergoes a reorganisation [4],[5], [6]. The
breast tumours are stiffer than normal breast tissues, although in any situation they still are softer
than muscle or bone. Palpation, is the first diagnostic test [1] and is based on qualitative assessment
of the low-frequency stiffness of the breast tissue [5].
The mechanical properties of soft tissues have been a topic of interest in medical applications
such as computer-assisted interventional procedures and medical imaging [7], [6]. On the breast,
research of the biomechanical properties has been related to clinical applications such as cancer detection, mechanics injury, surgical simulators and tumour motion tracking during surgeries.
On medical image, it has been used phantoms that mimic breast tissue regarding its mechani-cal, acoustic and optical properties, with the purpose to develop and validate new techniques such
as elastography [8] [9] [10].
1.2
Motivation
The main research about mechanical properties has been done in tissues that are subject to some degree of mechanical activity, like muscles, arteries, lungs, tendons, skin and urethra. On the other hand, the tissues which do not have such activity, like breast, prostate or thyroid, do not have
so much information available about their mechanical properties [5]. The mechanical properties
of these tissues play a relevant role in their morphology and structure, being significant when a pathology is developed, such as cancer.
Breast cancer is one of the most common diseases in women, being 25% of all types of cancer in women. Worldwide, it is a pathology that affects approximately 1.38 million women per year
[1]. One of the current therapies for breast cancer is surgical treatment, which is becoming less
mutilating over the last century [11]. After a mastectomy, breast reconstruction is a procedure
that women can do to recover their breast. According to International Society of Aesthetic and Plastic Surgery, in 2017, there were 1.449.337 breast reconstructions, which represents 15.8% of
all reconstructive procedures in the world [12].
Breast tissue changes in response to a function, pathological situation or according to the hor-monal state, therefore it is very important to understand its behaviour and the mechanical changes under normal and abnormal environment from all the components of the breast. This knowledge, obtained from in vivo and ex vivo techniques, associated to biomechanical modelling and imaging techniques, is essential to reduce the numbers of misdiagnosed breast cancers or other pathology, enhance surgical planning and aesthetics treatments. Better models from the breast will be also achieved, with more detail and more realistic.
The breast models and medical image techniques can be also improved with the use of phan-toms instead of real tissue. Phanphan-toms are very helpful for the development of new diagnostic
techniques such as elastography [8]. Test, train and optimise medical systems can be done using
tissue mimicking materials, that possess the mechanical, optical and acoustic properties similar to the breast tissue.
1.3 Objectives 3
In literature, these phantoms are usually made of water-based gels (e.g. hydrogels). Agar and gelatin are the most common used, because they present a similar behaviour under stress and strain fields as soft tissues. Inclusions can be embedded on these gels to mimic the internal structures of a breast, as well as tumours, and to replicate the same physical properties of the breast.
Agarose, an hydrogel obtained from agar, is not being used as often as agar and gelatin. How-ever, it also presents the same stress/strain relationship and it is a material stiffer than the other
two. Agarose was once used to determine the nuclear magnetic resonance parameters [13] but
the mechanical properties were not analysed. Therefore, there is an opportunity to analyse its mechanical behaviour under compression and evaluate if it fits on breast tissue properties.
In addition, agarose also cover the properties of other human tissues (figure1.2) and is also
been investigated for tissue engineering applications. Agarose, along with its derivatives and blends, have been widely used in tissue engineering and regenerative medicine, such as neuro-genesis, angioneuro-genesis, spermatoneuro-genesis, cartilage formation, bone regeneration, wound healing and artificial pancreas. It is a natural polysaccharide polymer that has unique characteristics such as excellent biocompatibility, thermoreversible gelation behaviour and physiochemical features, which support its use as a biomaterial for cell growth and/or controlled/localised drug delivery
[14]. Therefore, agarose shows to be promising in medical environment.
Figure 1.2: Tissue properties covered by agarose. Adapted from [14]
1.3
Objectives
The goal of this dissertation is to characterise mechanically an organic phantom candidate for breast tissues. Agarose will be used and its Young’s modulus will be determined under different conditions. The technique applied will be unconstrained compression and the influence of preload, preconditioning, hydration and concentration of agarose will be analysed.
4 Introduction
1.4
Structure
The dissertation is organised in 6 chapters as follow: in Chapter1an introductory overview about
the topic was done. In Chapter2first is described the structural changes that the breast suffers
dur-ing the life of a woman and then it is presented the basic concepts about the mechanical behaviour of breast tissues. In this subsection, in vivo and ex vivo protocols already performed will be dis-cussed as well as their main results. Besides that, different techniques of compression tests will be taken into account, such as constrained, unconstrained and indentation tests. At the end of this chapter, a section about phantoms for breast tissues is presented, including the materials that have
been used for this purpose. In Chapter3, the experimental procedure is described in detail, starting
with an introduction of the material used as well as its production protocol. Then, the
prepara-tion of the samples and the measurement protocol ere reported. Chapters4and5will present the
results obtained for agarose and a discussion comparing the results with literature, respectively. The results will be compared with the mechanical properties of other phantoms studies and from
human breast tissues. At the end, in Chapter6the final conclusions and the future work will be
mentioned. In AppendixAis described the method and the results obtained for the calibration of
Chapter 2
Literature Review
2.1
Changes in Breast Tissue Structure
Mammary glands are modified sweat glands, responsible for the production of milk and they are localised inside the breasts. In prepubescent children of both sexes, the structure of the breast is similar, which means a rudimentary glandular system composed by channels and scarce alveoli.
In girls, the breast starts to develop in puberty by the action of estrogen and progesterone. In an adult woman, the lobes develop and each mammary gland is composed by 15 to 20 lobes covered
by adipose tissue [15], figure2.1. The adipose tissue with the connective tissue are responsible
for the volume, shape and size of the breast at different periods of woman’s life, such as puberty, pregnancy and menopause. In the breast, there are also fibrous tissue, blood vessels, lymph vessels and nerves. The percentage of each component is different for each woman and it is also dependent on the age of the woman. The suspensory ligaments or Cooper’s ligaments are important to hold the breast and are composed by fibroblasts that are located between the parallel collagen fibres [15].
Figure 2.1: (a) Breast anatomy; (b) Mammary glands. [16]
6 Literature Review
Temporary or definitive changes in the breast can occur due to a variety of factors, such as age, menstrual cycle, pregnancy and lactation, hormone therapy, menopause or trauma. Therefore, along the life of a woman the breast is always changing.
In puberty, the breast tissue develops the mammary glands and simultaneously the grow and ramification of the galactophore ducts. For that reason and also due to the accumulation of adipose
and connective tissue around the mammary glands, the breast increases its volume and size [17].
Until menopause, the breast suffers cyclic modifications according to the menstrual cycle [18].
After menopause, the size of mammary glands decreases in size and there is atrophy of the secre-tion porsecre-tions and it might occur as well as in the ducts. Also the connective tissue interlobular
can be influenced by this atrophy [17]. These modifications are associated with the decrease of
estrogen and progesterone and also with the lost of collagen in the skin. Consequently, in an old
woman, the Cooper’s ligaments, superficial fascia and the skin get weaker and stretch [15] which
makes the breast more fallen.
In gestation phase, the mammary glands grow a lot due to the increase of secretion of
hor-mones, like estrogen, progesterone, prolactin and human placental lactogen [17]. The high level
of estrogen causes the ducts of mammary glands to grow and branch extensively. Once the ducts are complete, progesterone stimulates the budding and development of acini at the ends of the
ducts. The acini are organised into grape-like clusters (lobules) within each lobe of the breast [2].
The alveoli are composed by epithelial cells that are organised in spheres and they are
respon-sible for the secretion of milk in lactation [17]. In lactation, there is a decrease in connective and
adipose tissue and an increase in mammary glands. After lactation, the alveoli produced
degener-ate by apoptosis [17].
2.2
Characterisation of the Mechanical Behaviour of Breast Tissues:
Basic Concepts
The biomechanical properties of any tissue are related to its function and therefore they are differ-ent from one organ or tissue to another. For example, bone is the tissue with the highest Young’s modulus and the highest stiffness (i.e it is the hardest) and the blood, mucus and fluid are the components in human body with the lowest stiffness and viscosity. The stiffness of breast tissue
is situated between the lung and the endothelial tissue [1].
The size and shape of the breast change during the menstrual cycle, pregnancy, after weaning,
and during menopause [3]. These changes influence the epithelial proliferation, hydration and
vascularization of the breast tissue [19]. Regarding the mechanical properties, they change in
response to a function (as during mammary gland lactation) or in pathological situations (such as
tumours) [1].
The mechanical properties of soft tissues are represented generally in two domains: elastic and viscous. It is the combination of these two components that control the tissue deformation.
2.2 Characterisation of the Mechanical Behaviour of Breast Tissues: Basic Concepts 7
The stress (σ ) and strain (ε) are related by the classic elasticity theory, which is represented by Hooke’s Law:
σ = Eε (2.1)
The constant of proportionality, E, represents the elasticity modulus and can be obtained
through the slope of the stress-strain curve, figure2.2, in the elastic region.
Figure 2.2: Mechanical behaviour of linear elastic and hyperelastic materials [1]
The elasticity modulus can be of three types: tensile (Young’s modulus), shear (shear modulus) and volumetric elasticity (bulk modulus). The first one is the most common of the three to quantify
stiffness [1].
Soft tissues are assumed to be elastic, near incompressible and isotropic [20], [21], [22]. Some
of them can be considered as linearly elastic materials and are characterized by Young’s modulus, E, and Poisson’s ratio, ν. Since soft tissues are assumed as quasi-incompressible due to their high
fluid content [1], Poisson’s ratio is equal to 0,495 [22], [1]. With this assumption, only Young’s
modulus is required to characterize the mechanical properties of the tissue. This parameter is a function of the material and does not depend on the geometry of the material or the boundary
conditions surrounding the material [5]. To determine Young’s modulus, some authors [5], [23],
[24] used the following equation:
E=2(1 − ν
2)qa
w (2.2)
where q is the load density, a is the radius of the loaded area, w is the maximum displacement and ν is the Poisson’s ratio. This coefficient measures transversal deformation relative to the longitudinal direction of load application and can be calculated as:
ν = −εd
εa
8 Literature Review
where εa is the strain in loading direction and εd is the corresponding strain in the lateral
direction.
Mechanical properties depend on time and strain history and this is why stress-strain curves
are different from loading and unloading conditions and different in each cycle [1]. The force
response for each cycle usually shows an hysteresis loop, that tends to decrease as the cycle number
increases [24]. This phenomenon can happen due to the viscoelasticity of the material, which is
related to the shear contact between collagen fibres, the proteoglycans and elastin component
of ground substance [1]. Hysteresis effect (figure2.3) happens once shear stress causes energy
dissipation due to the recovery of the tissue after elongation and contraction. To achieve the steady state for a given load cycle, preconditioning, which is a repeatedly loading and unloading of the tissue, is necessary. Preconditioning happens because the internal structure of the tissue
changes with the cycling, but after a repeated cycling a steady state is reached [22]. Umemoto et
al. [24] concluded that after two cycles the steady state was reached. Also Krouskop et al. [5]
used 5% and 20% of precompression and Wellman et al. [21] loaded 10 times the samples at 2N
for preconditioning.
Figure 2.3: Hysteresis Loop [1]
In the most traditional way, the measurement of Young’s modulus is achieved by compressing the sample between two plates and thus the displacements and the resulting forces are measured. This measurement approach assumes that stress and strain have uniform distribution through the
tissue volume [4], [20], which is not always true for some soft tissues due to its surface roughness
and inhomogeneity [4]. Several authors have been using compression tests [5], [23], [25] or
indentation tests [20], [4], [7], [26] to measure the mechanical parameters of the tissue. The
compression tests can be unconfined, in which the specimen is fixed between two plates and so
the deformation of the tissue is in the direction parallel to the applied force, figure 2.4 (c). In
the confined compression, the sample is additionally constrained in the radial direction to the
2.2 Characterisation of the Mechanical Behaviour of Breast Tissues: Basic Concepts 9
compression test but a cylindrical plane-ended or spherical-ended indenter applies the load to the
tissue, figure2.4(a). Another difference is that the indenter surface is smaller than the specimen
testing surface while, in compression tests, the compressor plate should not be inferior to the size of the sample. The deformation of the external surface is recorded and the slope of the stress-strain curve gives the Young’s modulus. The fluid flow outside the indenter-tissue contact point is possible in both lateral and axial directions. When breast tissue is compressed the strain increases rapidly corresponding to the elimination of free fluid. With the increase of strain, the elastic
modulus becomes progressively higher [1]. Indentation test has minimum requirements for tissue
preparation and so it is suitable for testing relatively small tissue samples [26].
Figure 2.4: Schematic representation of a) indentation test, b) confined compression test, c)
un-confined compression test. [27]
2.2.1 In Vivo Experiments to Determine Material Properties of Breast Tissue
As stated above, there are few studies about the mechanical properties of soft tissues and, within these, most of them are performed ex vivo, which means that concerning in vivo techniques the
data about the elastic properties of soft tissues is even less [22]. Palpation is a diagnostic test for
breast cancer based on a qualitative assessment of the low-frequency stiffness of the tissue [1]. It
has a high subjectivity and a low sensitivity associated which, in many cases, prevent the detection
of small and/or deep lesions [22].
Therefore, to help in the detection of abnormalities, imaging techniques can be used.
Elas-tography is a tool to diagnose cancer that provides quantitative information on tissue stiffness [1],
adding the estimation of the elastic modulus [5]. It is a non-invasive method that creates an image
of the distribution of a physical parameter related to the mechanical properties of the tissue [5],
like the spatial distribution of tissue elasticity [4], by measuring the response or strain of the
tis-sue resulting from the applied stress [1]. The elastogram is the output grey scale image with the
elasticity information [28].
Normally it is applied a small quasi-static or harmonic tissue compression, acquiring tissue displacement data using conventional imaging techniques such as ultrasound (US), magnetic res-onance (RM) imaging or x-ray computerised tomography (CT) and then the elastic modulus is
10 Literature Review
In elasticity imaging methods, a stress is applied to the tissue and the response to that stimulus is measured. From that response, the parameters related to the mechanical properties are
deter-mined [1]. Elastography is a technique with a high level of sensitivity (detect the presence of an
abnormality) and specificity (differentiate between benign or malignant tumour) [1].
One study where real-time ultrasound elastography was applied is the work of Umemoto et
al. [24]. This technique was based on the differences in strain and a colour scale was constructed
to indicate the areas with the greatest strain or no strain. They could detect all the lesions once their strain distribution on the elastic images differed from the normal surrounding breast tissues (i.e. lesions had lower strain than normal tissues). They also visualised that for each cycle, the force response showed a hysteresis loop, but the size of the loop decreased as the cycle number increased, tending to stabilise after two cycles. This is the so-called preconditioning and happens because of the internal structure of the tissue changes with the cycling, but after a repeated cycling
a steady state is reached [22].
Barr and Zhang [29] determined the effect of this precompression on clinical images. They
concluded that precompression substantially influences the results on both strain and shear waves elastography. They divided the preload compression in four regions: A) 0-10%, B) 10-25%, C) 25-40% and D) >40%. Concerning the strain, in regions A, B and C there was a visible difference in elasticity between soft and malignant tissues. In region D, the elasticity was very similar in both tissues and thus the elastogram was only noise. If there are only soft tissues, the results are worse as the precompression increased. About the shear wave, with the increase of precompression, Young’s modulus increases as well. It was recommended that all clinical breast images be obtained in the zone of minimal precompression (0-10%).
Besides ultrasound, MR can be also used among elastography and Sinkus et al. [30] applied
this method, which is capable of assessing the viscoelastic properties of the tissue non invasively. The mechanical properties of the breast were done indirectly through the measurement of low fre-quency mechanical shear waves that are coupled longitudinally into the tissue. The compressional waves contribute to the total displacement field, however, it is difficult to evaluate this contribution once the tissue is incompressible. Therefore, a curl-operator was applied in their study to measured the displacement field. The results showed a good separation between breast cancer and benign fibroadenoma, being the breast cancer 2.2 times stiffer, as well as between breast cancer and sur-rounding tissue, with a stiffness 3.3 times higher for the breast cancer. According to the shear viscosity, the results showed that it is not a useful parameter to distinguish benign and malignant
lesions. Lawrence et al. [31] also used MR elastography but on healthy women and concluded
that the shear modulus of glandular tissue was 2.45 kPa (+0.2 kPa) and of adipose tissue was 0.43
kPa (+0.07 kPa). Van Houten et al. [32] and Chen et al. [33] also concluded that adipose tissue
had a lower elasticity modulus than fibroglandular tissue. In [33] the stiffness of the adipose tissue
ranged from 0.25 to 0.41 kPa and for the glandular tissue ranged from 0.46 to 0.9 kPa. Chen et al.
[33] also studied the stiffness of an invasive ductal carcinoma (IDC) in one patient and the value
was 1.42 ± 0.17 kPa. For this woman, the glandular tissue had a stiffness of 0.90 ± 0.18 kPa and the adipose tissue of 0.41 ± 0.10 kPa.
2.2 Characterisation of the Mechanical Behaviour of Breast Tissues: Basic Concepts 11
Srivastava et al. [34] used optical coherence tomographic elastography and found out that
malignant tissue was four times stiffer than normal tissue and the stiffness of benign tissue was two times higher than normal tissue.
Han et al. [22] and Zheng et al. [28] used an ultrasound indentation system to analyse the
elastic properties of soft tissue. Han et al. [22] approach was based on US imaging to visualise
and measure the displacements in the tissue and simultaneously measure the applied external force during indentation test. Then, analytical methods are used to obtain the mechanical properties from
the image-based measurements. Zheng et al. [28] used a probe composed by an US transducer,
which was the indentor as well, and a load cell, to measure the thickness and the deformation of the tissue and to record the force response. The material constants were obtained via a curve-fitting procedure by predicting the force transient response from the deformation time data using a quasi linear viscoelastic model.
Céspedes et al. [35] introduced a new elastography system based on a linear array transducer
that is suitable for in vivo scanning. The output elastogram showed a well defined black area, which corresponds to the carcinoma, surrounded by white fat. The results showed that the elas-tography is a good technique to imaging the elastic properties of the tissue in vivo with good resolution, being able to detect small hard or soft local lesions in the deep tissue.
Summing up all the results regarding in vivo experiences, the elastic modulus was higher for tumour tissues, then normal glandular tissue and the lower value for normal adipose tissue. This conclusion is consistent for all the authors.
2.2.2 Ex Vivo Experiments to Determine Material Properties of Breast Tissue
In addition to the in vivo measurements, the mechanical properties have also been determined in ex vivo. Ex vivo experiments normally are performed within two hours after the tissue removal
from the breast in order to preserve as much as possible the original properties [24], [23], [5], [7],
[20]. However, Wellman et al. [21] and Krouskop et al. [5] proof that there are no changes in the
data if this deadline is overcome.
Ex vivotechniques include compression and indentation tests, as they are described above in
Chapter2.2
Krouskop et al. [5] studied the elastic modulus of breast tissue under compression and they
intended to evaluate the viscoelastic nature of the material and determine the validity of modelling the tissue as an elastic material. They studied normal adipose tissue, normal glandular tissue, fibrous tissue, intraductal carcinoma in situ and invasive and infiltrating ductal carcinoma under three strain rates (frequencies at 0.1, 1.0 and 4.0 Hz) using uniaxial compressive force with preload
12 Literature Review
Figure 2.5: Experimental Setup used by Krouskop et al. [5]
The data show that breast adipose tissue had a constant modulus over the strain range tested while the other tissues had a modulus that was dependent on the strain level. The fibrous tissue was 1 to 2 times stiffer than adipose tissue. At low strain, the glandular and adipose tissues had a similar elastic modulus but at high strain, the glandular tissue was found to be one order higher than adipose tissue. Intraductal carcinoma in situ had an elastic modulus similar to the adipose tissue at low strain but, at high strain, its stiffness was higher than glandular tissue. Infiltrating ductal carcinomas were the stiffest tissue.
The results also showed that the breast tissues are highly dependent on the level of precom-pression: the elastic modulus increase as the pre-compression increase as well. This dependency showed the nonlinear elastic behaviour of the tissues, which was more pronounced in the carcino-mas with the increase in stiffness.
Wellman et al. [21] did uniaxial compression tests and punch indentation tests (figure2.6),
using a precompression of 2N over 10 times on the tissue. They hypothesised that cancer exhibits greater non-linearity and its change in modulus with strain is greater. They found out that infil-trating ductal cancer was more than 10 times stiffer than normal adipose and 2.5 times stiffer than glandular tissue at 1% strain. At 15% strain, the cancer tissue was 70 times stiffer than adipose tissue and 5 times stiffer than glandular tissue. The major conclusion from their study is that cancerous tissue displays a much more non-linear increase in stiffness (going from about 10:1 stiffness ratio to 50:1 ratio as strain increase from 1% to 15%).
2.2 Characterisation of the Mechanical Behaviour of Breast Tissues: Basic Concepts 13
Figure 2.6: Experimental set-up used by Wellman et al. [21]
Samani et al. [20] developed a system to measure Young’s modulus of small soft tissue
speci-mens, accommodating sample size, geometry imperfections and heterogeneity. The samples were indented and Young’s modulus was obtained from the resulting force-displacement slope, using finite element analysis. They saw that breast tissues appear to exhibit significant nonlinear be-haviour and thus Young’s modulus was sensitive to the amount of precompression. Samani et
al. [7] also with a similar technique measured the hyperelastic parameters. They used a computer
controlled loading system while measuring the resulting indentation force and through the slope of the force-displacement response, the parameters were calculated based on an inversion technique. They concluded that Young’s modulus of the tested tissue specimens was 3.6 kPa. Also, higher order hyperelastic parameters indicate that under higher strains the fibroglandular tissue is stiffer than adipose tissue.
Again with a similar technique as [20], Samani et al. [4] measured Young’s modulus of
tu-mours embedded in normal tissue. They obtained a smaller error while analysing larger tutu-mours, once if the tumours were small the errors due to the deformation of the surrounding tissue would be significant. Benign lesions and malignant tumours were found to be five times and ten times stiffer than normal breast tissues, respectively.
Samani et al. [6] used an indentation technique to measure the elasticity of 169 samples,
in-cluding adipose, fibroglandular tissue, benign tumour and malignant tumour. The data showed that under small strains the elastic modulus of normal adipose and fibroglandular tissues were similar and, comparing to fibroadenomas, those tissues were 2 times stiffer. Comparing to fibroglandu-lar tissue, fibrocystic disease and malignant tumours were 3-6-times stiffer, while invasive ductal carcinoma (IDC) was 13 times stiffer.
The experimental set ups used for the studies of Samani et al. are represented in figure2.7
and2.8. The first one was used for block shape specimens while the second was used for slice
14 Literature Review
Figure 2.7: Experimental set-up used for block shape samples [7]
Figure 2.8: Experimental set-up used for slice samples [4]
Likewise, Matsumura et al. [23] measured the elasticity of breast tissues, but using a direct
compression test. It was observed that adipose and glandular tissue had similar stress-strain curves and presented a bigger non-linearity than lesions. These tissues had a significantly lower Young’s modulus than invasive ductal carcinoma and mucinous carcinoma. The ductal carcinoma in situ (DCIS) was stiffer than normal breast tissues under lower stress but the magnitude relation be-tween them changed around the stress of 1 kPa. They also concluded that Young’s modulus was significantly dependent on the loaded stresses.
Umemoto et al. [24] concluded that Young’s modulus of breast tissue differed under conditions
of light stress (<1 kPa), and, in ascending order of their elasticity, the tissues were adipose, normal glandular and ductal carcinoma in situ and invasive carcinoma. The elasticity of normal tissues significantly differed from that of lesions, especially under light stress conditions, but the contrast of elasticity between these two types of tissue gradually decreased as the stress applied increase, showing the non-linearity of the normal tissues. The rates of increase in elasticity of normal
2.3 Phantoms for Breast Tissues 15
breast tissues with respect to a stress axis from 0.0 to 1.2 kPa are significantly larger than those of malignant tissues; Young’s modulus of normal breast tissues increase to the point where they come close to or exceed those of malignant tissues.
Zhang et al. [36] developed a nonlinear finite element model to investigate the influence
of friction and large deformation on the calculation of Young’s modulus, using a cylindrical flat-ended indentation test. They concluded that friction influences the calculation of effective Young’s modulus. This was the only study that referred the influence of friction and was performed in 1997, which can indicate that this factor was not relevant anymore for the following research and maybe the techniques adopted afterwards reduced its influence.
In terms of viscoelasticity, Qiu et al. [26] measured the viscoelastic properties of breast cancer
tissue from 4T1 and SKBR3 cell lines using a mouse model. The study show that the cell lines were strain-independent for instantaneous and long-term elastic modulus. Also, the extracelular matrix could contribute to the stiffening the tissue-level behaviour. The viscoelastic character-isation is important for the elastography measurement of breast cancer tissue and it is a useful information for modeling the tissue.
As an overall conclusion for the ex vivo techniques, tumour tissue has the highest Young’s modulus comparing to normal breast tissue and also as the precompression increases, Young’s modulus increases as well.
Comparing adipose tissue with glandular tissue, Krouskop et al. [5] and Wellman et al. [21]
determined that glandular tissue is stiffer than adipose tissue. Although for Samani et al. [4] the
value of Young’s modulus was similar for adipose and glandular tissue and for Matsumura et al.
[23] and Umemoto et al. [24] at low stress this value was also similar but, for higher stress, the
adipose tissue was stiffer than glandular tissue. Comparing ductal carcinoma in situ (DCIS) with invasive ductal carcinoma (IDC) all the authors concluded that IDC has a higher Young’s modulus,
except Wellman et al. [21] that found a higher value for DCIS.
These differences found on literature might be caused by numerous factors: different amount of samples and reduce number of tumour tissue samples used; there are always systematic errors associated with the measurement techniques and with the finite element models; the tissue hetero-geneity and etiologic factors such as the age or menstrual cycle of the women might influence the results. Also, the preconditioning method was not the same in all the studies and the authors used different levels of strain/stress, which was already mentioned above that influence the results.
2.3
Phantoms for Breast Tissues
Human tissue mimicking phantoms are used to mimic the physical and mechanical properties of human tissues with the purpose of providing a more clinically realistic imaging environment for
medical applications [37] [8]. Phantoms are composed by tissue mimicking materials and the
majority have a simple homogeneous internal structure. However, targets can be embedded within phantoms to mimic internal structures. An advantage of phantoms is that idealised tissue models
16 Literature Review
can be constructed with well-defined acoustic properties, dimensions and internal features, thereby
simplifying and standardising the imaging environment [38].
The development of breast phantoms has been capturing the interest of researchers. These
phantoms aid the development and validation of new systems or diagnostic techniques [38], such
as elastography [8] [9] [10], photoacoustic equipment [37] and ultrasound [39], including testing,
training and optimization of those systems. Also for calibration of diagnostic radiology equipment
[40], ultrasound [38] and nuclear magnetic resonance (NMR) [13] phantoms are useful. The
evaluation of mammographic equipment can be also facilitated with phantoms [41] [42].
According to the technique, different properties of the breast tissue should be mimicked. For example, for photoacoustic imaging, it is important to pay attention to the speed of sound,
attenu-ation, acoustic impedance and absorption and scattering coefficients, among others [37] [38].
A better understanding about the nonlinear stress/strain properties of phantom materials can aid to develop methods for estimating the nonlinear parameters of tissues, using elastic
imag-ing techniques [43]. The elastic properties of a phantom should be chemically stable to prevent
changes in contrast over time and it is important that the inclusions mimic the structures with
respect to their shape, size and placement in stress and acoustic fields [44].
Hydrogels, which are hydrophilic and cross-linked polymers that expand in water [39], were
the first materials to be used for ultrasound and photoacoustic imaging systems [37]. They possess
many of the most important features necessary to build phantoms [44] and they are also easy to
fabricate, with a flexibility in the process that allows the incorporation of additional ingredients,
organic or non-organic [45], to produce a range of optic and acoustic properties [37] [38].
The common materials for breast phantoms include agar, gelatin, polyacrylamide, polyvinyl
alcohol (PVA) , paraffin-gel waxes, polyvinyl chloride (PVC) and silicone [45] [39] [37] [8].
Agar and gelatin are well-know materials for its nonlinear stress/strain relationship although
was proved by Pavan et al. [43] that gelatin shows a nearly linear relationship until 10% strain.
Agar and agar/gelatin mixtures have been commonly used to mimic the acoustic and elastic
prop-erties of soft tissues [37], providing a reasonable stable material [43]. However, these materials
have a short longevity, on the order of a week [45], due to microbial contamination or damage [37].
Also, because they are not rigid at room temperature and tends to fracture at moderate strains (e.g.
brittle gel) [10], it is difficult to construct complex shapes [45]. Another drawback is that agar
exhibit a much more rapidly increasing in Young’s modulus with strain than normal breast tissue,
for strains greater than a few percent [10].
Epoxy resins can be molded and they are stable over time. They can be used for years while
maintaining their optical properties [41], however resins phantoms are much stiffer than soft tissue
[45].
Silicone, which also presents a nonlinear behaviour [8], is another material currently used
for breast phantoms. It is compatible with a lot of scatters for optical properties, its mechanical properties can be controlled by crosslinking and it has low viscosity prior to curing which allows to build complex structures. However, it is not compatible with organic materials, such as tissue
2.3 Phantoms for Breast Tissues 17
and both organic and inorganic scatters can be added. Fibrin is a human protein that provides structural support for blood clots and can be readily synthesised, with a shelf life of up to one month. In this study, also PVA cryogels were analysed and it was mentioned that their mechanical properties can be controlled in the range found in breast tissue although the optical properties are difficult to control. The conclusion for Lamouche et al. is that no one phantom can replicate all the properties of breast tissues for optical coherence tomography.
Price et al. [40] studied PVA as well in ethanol and water with equivalent mechanical and
x-ray attenuation properties of breast tissues.
Ismail et al. [8], through digital image elasto tomography (DIET), studied the elastic
modu-lus and viscoelastic properties of different materials and compositions to accurately mimic skin, adipose tissue and tumor tissue. The materials used were agar, gelatin and silicone and they con-cluded that all of them are suitable for mimicking breast tissue. Agar and gelatin are water-based materials and therefore their stiffness is similar to soft tissues. Silicone does not have water con-tent but overcome all the limitations found in agar and gelatin, such as durability and it is not brittle, which allows to perform repeated tests over time. Therefore, silicone was mentioned as the best over the three.
Pavan et al. [43] developed a phantom material for elasticity imaging based on agar and
gelatin. Oil droplets were added to the mixture of agar/gelatin to provide a greater control of the small strain shear modulus and the nonlinear parameter of the material. Different concentrations of each component were used and compression test was performed in order to evaluate the elasticity of each material. They concluded that plain agar was more nonlinear than plain gelatin and the mixture of them showed also a nonlinear behaviour. The oil droplets decreased the stiffness and the nonlinear behaviour of the gels.
Hall et al.[44] studied the acoustic and mechanical properties for gelatin materials, used to
construct tissue-like phantoms for elastography. They concluded that gelatin gels can provide a wide range of stiffness as presented in soft tissues. In these gels, stiffness, sound speed, absorption and scattering can be controlled by aldehydes, N-propanol and graphite flakes and glass beads, respectively.
Madsen studied phantoms for breast tissues since 1982 with focus on elastography. The first
study [46] mimics skin, glandular tissue, adipose tissue and Cooper’s ligaments. Adipose tissue
is mimicked using dispersions of oil-kerosene solutions in a gel matrix. Glandular tissue consists in water-based animal-hide gel with graphite particles randomly distributed. Cooper’s ligaments have the same composition but the percentage of graphite particles is much higher. Skin has the
same gel as background but it has pumice powder distributed. In 2003, Madsen et al. [10] analysed
heterogeneous phantoms, made of oil-in-gelatin dispersions. A cube with a cylindrical inclusion of different composition was subject to quasi-static tests and the elastic, ultrasound and magnetic resonance properties were determined. They demonstrated that all these properties remain
ad-equately stable. In 2005 [9] and 2006 [47], Madsen determined the same properties of breast
phantoms but first in agar/gelatin materials with an inclusion and the year after with safflower oil droplets in aqueous gelatin.
18 Literature Review
Mitchell et al. [13] used agarose gel phantoms to determine the magnetic resonance properties,
Chapter 3
Experimental Procedures
3.1
Agar/Agarose
3.1.1 Basic Concepts
Agar-agar, or simply agar, is a gelatin-like product, that occurs as structural carbohydrate in the
cell walls of agarophytes algae [48]. These algae are red algae (Rhodophyta phylum [49]), mainly
of the genus Gracilaria, Gelidium [50] [49] and Eucheuma [51]. They are characterised for being
small, have a reddish stem and they are rich in mucilage (a fiber) [51]. This polysaccharide was
consider to be formed by one unitary structure only having sulphate semi-ester groups linked to a
few galactose hydroxyl groups [52].
The agar can have plenty of applications such as food industry (food additive), metalworking (improve coating or encourage the stretching of some metals), paper industry (waterproofing prop-erties), leather industry (leather tanning), textile industry (provide strength and stiffness to clothes and facilitate printing), pharmaceuticals (composition of drugs and excipients), natural medicine (laxative and in slimming cures), cosmetic industry (skin creams) and microbiological research
(culture media) [51]. And it is available in different forms such as powder, flakes, bars or threads
[48].
Agar is composed by two polysaccharides, agarose (a neutral polymer) and agaropectin (a charged, sulfated polymer). The percentage of each component varies between the species of seaweed but agarose is always the major one, corresponding at least to two-thirds of the mixture
[48]. The variations of each fraction depends on the original raw material and the manufacturing
process employed [52].
Agarose, the gelling fraction, is a neutral linear polymer essentially free of sulfates and made up of repeating units of agarobiose, which is a disaccharide made up of D-galactose and 3,6-anhydro-L-galactopyranose. Agaropectine, the non-gelling fraction, is an heterogeneous mixture of smaller molecules made up of alternating units of D-galactose and L-galactose heavily modified
with acidic side-groups, such as sulfate and pyruvate [49] [48].
Although agar is insoluble in cold water, it absorbs as much as twenty times its own weight
[50] [48]. It dissolves in boiling water [52] and sets a firm gel at concentrations as low as 0,50%.
20 Experimental Procedures
These gels are rigid, brittle, have well defined shapes and sharp melting and gelling points. The gelling portion has a double helical structure. To obtain a gel, the double helices aggregate to form
a three dimensional structure framework with the water molecules in its interstices [48] and are
the hydrogen bonds formed among the linear galactan chains of the gel that confers the gelling
power [52]. These gels are reversible, which means that they can exchange between the melting
and solid states without losing the original properties [52] [53].
Agar exhibits hysteresis, melting at 85oC and solidifying from 32-40oC, showing a suitable
balance between easy melting and good gel stability at relatively high temperatures [49]. These
temperatures depend on the presence of agarobioses originally in the agarophyte seaweed from
where the agar was extracted [52].
Another property of the agar and agarose gels is the phenomenon of syneresis, which is the
capacity to eliminate the water on the gel mesh through its surface [48]. When an undried and
synergised gel is submerged in water, it will recover exactly its original size and form, a capacity
known as gelling memory [52].
The gel strength is influenced by concentration (higher concentration, higher strength), time (with time, the strength increase), pH (as the pH decreases, the gel strength weakens) and sugar
content (increasing levels of sugar make gels harder but less cohesive texture) [48].
The viscosity of the agar solutions depends on the raw material source and so varies widely. At temperatures above its gelling point, the viscosity is relatively constant (pH 4.5 to 9.0) and once
the gelling starts, the viscosity increases with time, at constant temperature [48].
A solution of agar is slightly negatively charged and so its stability depends on the hydration and the electric charge. Without these two factors, the agar starts forming flakes. It should be also taking into account that long periods of exposure to high temperatures cause a decrease in gel strength at the point of gel formation and this is worsened with the decrease of pH. Therefore, it should not be kept with a pH lower than 6.0 for extended periods of time as well as at high
temperatures [48].
Agarose is the fraction with more interest for the current applications and, therefore, some methods to extract agarose from agar have been developed since 1937. The basic principles to prepare agarose are mainly: acetylation, selective solution, quaternary ammonium precipitation, polyethylene glycol, dimethyl sulfoxide extraction, ammonium sulfate precipitation, ion exchange, insoluble support absorption, chromatography, electrophoresis, rivanol precipitation and chitin and
chitosan precipitations [53].
The agarose produces physical gels, which means that the aqueous gels have all their structure
formed only by the polymer molecules, which aggregate through hydrogen bonds, figure3.1. Due
to this property, the gel holds in the interior network a great amount of water which can move freely through the macroreticulum. In contrast, the chemical gels have the polymer molecules
3.1 Agar/Agarose 21
Figure 3.1: Molecular structure and self-gelling property of agarose. Adapted from [14]
3.1.2 Production of Agarose: Methodology
To extract the agarose from agar, the method used in this dissertation was based on polyethylene glycol (PEG) precipitation. The process was based on the patent: "Method for separating and
preparing agarose from agar by using polyethylene glycol precipitation method" [54].
This procedure starts with the dissolution of 4g of agar in 100mL of distilled water, using a
heating plate and stirring constantly. Then the solution is placed in a water bath at 90oC.
Sec-ondly, it was prepared a 40% solution of PEG with molecular weight of 8000 (Sigma-Aldrich, Poly(ethylene glycol) average mol wt 8000, powder). This solution was rapidly mixed into the agar solution with a volume ratio of 1:1 and kept in the water bath with constantly stirring for two minutes. After that time, the solution was taken off from the water bath and allowed to cold down
at room temperature. It is important to notice that the temperature decreased less than 10oC. In
the next step, the solution was cooling centrifuge with 2500rpm for 15 minutes at 35oC. Then,
the precipitate obtained was washed, firstly with distilled water for four times and secondly with acetone for three times. In this step, the parameters of the centrifugation were 2500rpm for 3
min-utes at 35oC. Finally, the white precipitate was dried in a drying oven at a constant temperature,
approximately 30oC, overnight. The final product, a powder agarose (figure3.2), was stored in
petri dishes at room temperature. The yield of the process was in average 61.15%.
The properties of the agarose for each batch, such as purity and gel strength, were not possible to determine at the end.
22 Experimental Procedures
3.2
Materials and Methods
3.2.1 Samples preparation
To prepare the agarose for the samples, the powder produced was dissolved in distilled water
according to the desired concentration. The solution was heated until 85oC with a heating plate
and with constantly stirring. When the temperature was reached, the solution was still stirred for some more minutes at constant temperature to ensure the dissolution was complete and then was poured into a mould to solidified. When the gel become solid, with a metal punch the samples
were cut, all with the same dimensions, figure3.3.
Figure 3.3: Metal punch (left) and mould (right) to prepare the samples
Since the purposed of using agarose is to study it as a phantom of breast tissues, the samples
followed a shape and dimensions similar to the samples of breast tissues analysed in [7], [6], [20],
[4] and [21]. In literature, the samples had a block shape with dimensions of: 15x15x10 mm3in
the studies of [7], [6], [20] and 10x10x2 mm3in [21].
Therefore, the samples of agarose also had a shape of a block. However, the size was lightly
different once the metal punch used to cut the blocks had a fixed area of 12x12 mm2. The height
could be adjustable (with a maximum of 15mm) and the size defined was approximately 10mm. Two studies were performed, the first to analysed the influenced of preload, precompression, hydration and velocity of the test, the second to evaluate if agarose is a viable phantom for hu-man breast tissues or not. For the first case, some samples were kept in saline solution to avoid dehydration while the others were not and so evaporation might happen. For the second case, all samples were maintained in saline in order to mimic the tissues.
3.2.2 Measurement Protocol
To perform the tests, a compression machine (figure3.4a) was used. The load cell for the first study
was 100N (DBBSMM-10kg) once the range of force accomplished was higher. On the other hand, for the second study, a load cell of 20N (DBBSMM-2kg) was used because the samples were softer and so the forces measured were lower. The actuator used had a capacity of 12kg and a resolution
of 3.05 × 10⁻⁴mm.
The machine was previously calibrated with expanded polystyrene (EPS) with densities of
3.2 Materials and Methods 23
For the trials the preload, the preconditioning (amplitude, velocity and number of cycles) and the velocity of the test were defined. The preload vary from 0.005N to 0.03N, the amplitude was 5% or 10% of the initial thickness, the velocity of the cycles in preconditioning vary from 1mm/min to 12mm/min, the number of cycles was set as 25 and the velocity of the final test had
the same range as the preconditioning. These values are based on the studies of Samani et al. [4],
[6], [20], where they determined the elastic modulus of breast tissues as well as the hyperelastic
parameters [7]. Despite the experiments of Samani were performed with a cylindrical flat-ended
indenter of 5mm of diameter, which means an indentation test, in this dissertation the experiments were done with an indenter with the same shape but with 15mm of diameter, which means a compression test, once if the test was an indentation the indenter would penetrated the sample at low concentrations.
For all the trials the frequency of acquisition of data was set as 100Hz, the maximum allowed by the machine.
(a)
(b)
Chapter 4
Results
4.1
Mathematical Approach
On the experimental tests, the force, F, and displacement, ∆l, were measured and therefore the stress, σ , and strain, ε, were determined, using the followings equations, respectively:
σ = F
A (4.1)
ε =∆l
L0
(4.2)
where A is the area of contact between the sample and the indenter and L0is the initial thickness.
The stress-strain curve obtained for each measurement was analysed and the Young’s modulus,
E, was calculated using the equation [5], [24], [23]:
E= 2(1 − ν
2)a
z0 ×
σ
ε (4.3)
where a is radius of the loaded area, z0is initial thickness of the sample, ν is Poisson’s ratio,
σ is the stress and ε is the strain. Since agarose is consider to be an incompressible material, the
Poisson’s ratio is 0.5 [55].
The data was processed and analysed using a Matlab interface. The original data was loaded, then preprocessed in a way to find the best fitting curve for all the points, using convolution technique, and then converted to the desired parameters, such as stress and strain. With these
values, the equation4.3 was applied and the Young’s modulus was determined on the desired
range of data.
To analyse the stress-strain relationship, two Young’s modulus were determined, EI and EII
(figure4.1). Although the example curve has three phases: loading, unloading and relaxation,
only the loading part is relevant in this study, once the machine used was not capable of recording enough data to analyse an entire cycle. Therefore, the curves obtained in this work correspond to
the loading part of a cycle and the Young’s modulus EIand EIIwere determined as described in the
figure4.1with red dashed lines. For each sample EIwas calculated within a range of strain from
26 Results
2.5% to 10% and EIIwithin a range from 15% to 25%, although some exceptions could happen,
specially at low concentrations of agarose.
Figure 4.1: Example test curve of stress/load-strain/displacement showing direction of loading, relaxation and unloading segments (indicated by arrows) and defined tangent moduli (red dashed
lines). Adapted from [56]
4.2
Statistical Analysis
The difference between the means of each group was analysed using a Student’s t-test. Results with a p-value < 0.05 were considered to be statistically significant. The data was previously ensured that followed a Gaussian curve, using Anderson-Darling normality test. In the cases that more than two groups were analysed, one-way ANOVA test was performed with p-value < 0.05 as well and in these cases, a Bonferroni test was used to evaluate the differences between each pair.
4.3
Effects of preload, preconditioning, hydration and velocity test
Samples of 2% agarose, with similar size, were analysed in order to evaluate the influence of preload, type of preconditioning (percentage of strain and velocity), hydration and velocity in the final test. The preconditioning included 25 cycles and the test after was performed until rupture of
4.3 Effects of preload, preconditioning, hydration and velocity test 27
Table 4.1: Conditions for the tests
Preload Preconditioning (25 cycles) Final Test
1 0.01N 5% Deformation; 1mm/min 1mm/min
2 0.01N 5% Deformation; 3mm/min 1mm/min
3 0.005N 5% Deformation; 3mm/min 1mm/min
4 0.01N - 1mm/min
5 0.005N - 1mm/min
6 0.01N 10% Deformation; 3mm/min 1mm/min
7 0.005N 10% Deformation; 3mm/min 1mm/min
8 0.01N 10% Deformation; 1mm/min 1mm/min
9 0.005N 5% Deformation; 1mm/min 1mm/min
10 0.005N 10% Deformation; 1mm/min 1mm/min
11 0.01N - 3mm/min
12 0.005N - 3mm/min
13 0.005N 5% Deformation; 5mm/min 1mm/min
14 0.01N 5% Deformation; 5mm/min 1mm/min
15 0.005N 10% Deformation; 5mm/min 1mm/min
16 0.01N 10% Deformation; 5mm/min 1mm/min
17 0.005N 5% Deformation; 10mm/min 1mm/min
18 0.01N 5% Deformation; 3mm/min 3mm/min
19 0.005N 5% Deformation; 3mm/min 3mm/min
20 0.005N 10% Deformation; 10mm/min 1mm/min
SALINE SOLUTION
21 0.01N 10% Deformation; 3mm/min 1mm/min
22 0.01N 5% Deformation; 3mm/min 1mm/min
23 0.005N 10% Deformation; 3mm/min 1mm/min
24 0.01N 5% Deformation; 1mm/min 1mm/min
For each trial, more than one sample was tested and the stress-strain curves, presented in
fig-ures 4.2, 4.3, 4.4 and 4.5, correspond to the mean with the respective deviations. Each curve
corresponds to a sixth-degree polynomial, which was the best fit found. For each condition
ap-plied, Young’s modulus were determined (EIand EII) as well as the maximum force supported by
the sample (table4.2).
It is extremely important to point out that samples were not tested all in the same day (room temperature and humidity might be different and therefore could interfere with hydration of the samples) and the agarose powder used was not all from the same batch. Although the process to obtain agarose was the same, it is possible that different batches have different purities, which leads to different gel strengths, a parameter that was not possible to verified.
For any type of preconditioning (figure4.2), it is consistent that with the increase of velocity,
the Young’s modulus increases as well. Also, with higher preloads the maximum strain and stress reached by the samples increase as the velocity decrease.
![Figure 1.1: Anatomy of the breast. Adapted from [2]](https://thumb-eu.123doks.com/thumbv2/123dok_br/19175639.943049/17.892.172.760.586.876/figure-anatomy-breast-adapted.webp)
![Figure 1.2: Tissue properties covered by agarose. Adapted from [14]](https://thumb-eu.123doks.com/thumbv2/123dok_br/19175639.943049/19.892.311.618.616.855/figure-tissue-properties-covered-agarose-adapted.webp)
![Figure 2.2: Mechanical behaviour of linear elastic and hyperelastic materials [1]](https://thumb-eu.123doks.com/thumbv2/123dok_br/19175639.943049/23.892.257.669.352.586/figure-mechanical-behaviour-linear-elastic-hyperelastic-materials.webp)
![Figure 2.3: Hysteresis Loop [1]](https://thumb-eu.123doks.com/thumbv2/123dok_br/19175639.943049/24.892.276.573.542.819/figure-hysteresis-loop.webp)
![Figure 2.5: Experimental Setup used by Krouskop et al. [5]](https://thumb-eu.123doks.com/thumbv2/123dok_br/19175639.943049/28.892.261.587.142.405/figure-experimental-setup-used-krouskop-et-al.webp)
![Figure 2.6: Experimental set-up used by Wellman et al. [21]](https://thumb-eu.123doks.com/thumbv2/123dok_br/19175639.943049/29.892.293.658.152.344/figure-experimental-set-used-wellman-et-al.webp)
![Figure 2.7: Experimental set-up used for block shape samples [7]](https://thumb-eu.123doks.com/thumbv2/123dok_br/19175639.943049/30.892.214.634.147.373/figure-experimental-set-used-block-shape-samples.webp)
![Figure 3.1: Molecular structure and self-gelling property of agarose. Adapted from [14]](https://thumb-eu.123doks.com/thumbv2/123dok_br/19175639.943049/37.892.317.628.156.307/figure-molecular-structure-self-gelling-property-agarose-adapted.webp)

