Article
J. Braz. Chem. Soc., Vol. 22, No. 5, 836-848, 2011. Printed in Brazil - ©2011 Sociedade Brasileira de Química 0103 - 5053 $6.00+0.00
A
*e-mail: [email protected]
Citalopram Hydrobromide: Degradation Product Characterization and a Validated
Stability-Indicating LC-UV Method
Manav Sharma, Parikshit R. Jawa, Ravinder S. Gill and Gulshan Bansal*
Department of Pharmaceutical Sciences and Drug Research, Punjabi University, Patiala, 147 002, India
Cinco produtos de degradação (I-V) do hidrobromidrato de citalopram (CTL) foram formados sob condições diferentes de degradação forçada. Os produtos I e II foram formados sob condições hidrolíticas, enquanto que os produtos III-V sob condições fotolíticas. Os produtos II e IV
foram encontrados como impurezas conhecidas, citalopram carboxamida e citolopram-N-óxido, respectivamente. O produto I foi encontrado como sendo uma nova impureza, que foi caracterizada como 3-hidroxicitalopram N-óxido. A droga e todos os cinco produtos de degradação foram resolvidos de uma maneira otimizada em uma coluna C8 com fase móvel composta de acetonitrila e
tampão acetato de amônia (pH* 4,5) na vazão de 0,50 mL min-1. O método foi linear, preciso com
RSD < 3 (desvio padrão relativo) e exato com recuperação de 88-97% no intervalo de concentração 5-500 µg mL-1 de citalopram. Os limites de determinação (LOD) e de quantiicação (LOQ) foram
1 µg mL-1 e 5 µg mL-1, respectivamente. A análise por arranjo de fotodiodo de uma solução da
droga degradada contendo a droga e todos os cinco produtos de degradação revelou picos isolados, puros. Sendo assim, o método pode ser sugerido como estável.
Five degradation products (I-V) of citalopram hydrobromide (CTL) were formed under different forced degradation conditions. Products I and II were formed under hydrolytic conditions while product III-V were formed under photolytic conditions. Products II and IV were found known impurities as citalopram carboxamide and citalopram N-oxide, respectively. Product I was found to be a new impurity which was characterized as 3-hydroxycitalopram N-oxide. The drug and all ive degradation products were optimally resolved on a C8 column with mobile phase composed
of acetonitrile and ammonium acetate buffer (pH* 4.5) lowing at a rate of 0.50 mL min-1. The
method was linear, precise RSD < 3 (relative standard deviation) and accurate (recovery being 88-97%) in the concentration range of 5-500 µg mL-1 of citalopram. The limits of detection
(LOD) and of quantitation (LOQ) were 1 µg mL-1 and 5 µg mL-1, respectively. The photodiode
array (PDA) analysis of the degraded CTL solution containing the CTL and all ive degradation products revealed each peak to be pure. Hence, the method was suggested to be stability-indicating.
Keywords: citalopram, forced degradation, liquid chromatography-mass spectrometry (LC-MS), degradation products, mass fragmentation
Introduction
Citalopram hydrobromide (CTL) (Figure 1) is a highly selective and potent serotonin reuptake inhibitor which potentiates the serotonergic activity to produce antidepressant action.1 It is also reported to reverse
the memory impairment.2 Chemically, it is
(RS)-1-[3-(dimethylamino)propyl]-1-(p -fluorophenyl)-5-phthalan carbonitrile. Presence of nitrile group, fused teterahydrofuran ring, and C-N linkage in structure of the
drug makes it susceptible to degradation due to chemical reactivities of these groups under hydrolytic, oxidative, and photolytic environments,3,4 which will eventually produce
varied impurities or degradation products. Four process-related impurities of CTL [citalopram carboxamide (A), citalopram cyano N-oxide (B), citalopram N-oxide (C) and citalopram Di N-oxide (D)] reported in literature5 are listed
in Figure 1. Recently, Raman et al.6 have characterized a
new process-related impurity as citalopram butanone (E) (Figure1).
of all possible impurities and degradation products in a drug substance and product.7 Further, the ICH guidelines
Q1A(R2) recommend forced degradation of the drug substance under varied conditions like hydrolysis, oxidation, heat and photolysis to generate all possible impurities or degradation products in order to facilitate their structural characterization and also in development and validation of a stability-indicating assay method (SIAM).8 However,
there is no systematic forced degradation study on CTL. Moreover, spectral and mass fragmentation data of only a few process-related impurities is available in literature.6,9
Further, there are numerous analytical methods available for quantiication of CTL in formulations and biological matrixes.10 Both the European Pharmacopoeia and United
States Pharmacopeia have mentioned high performance liquid chromatography (HPLC) methods for separation of citalopram and some of its related substances,11 but there
is no method suitable to SIAM.
Hence, the present study is undertaken to conduct ICH prescribed systematic forced degradation study on CTL to identify its potential degradation products and to develop and validate a SIAM for accurate quantiication of CTL in the presence of its impurities and degradation products. The aim is to provide and substantiate the present data on impurities and quantiication methods.
Experimental
Chemicals and reagents
CTL was obtained as a generous gift sample from Ind-Swift Laboratories Ltd. (Dera Bassi, India). Acetonitrile and methanol (both HPLC grade) and hydrochloric acid, sodium hydroxide pellets, ammonium acetate and acetic acid (all AR grade) were purchased from Ranbaxy Fine Chemicals (SAS Nagar, India). Milli-Q water obtained from Milli-Q water puriication system (Synergy, Millipore, USA) in the laboratory was employed to prepare all reagents and solutions.
Instrumentation
The hydrolytic degradation studies were performed using a high-precisionwater bath equipped with a digital temperature controller (Narang Scientiic Works, New Delhi, India) capable of maintaining temperature within 1 °C. The thermal degradation study was conducted in a high precision hot air oven (Narang Scientiic Works, New Delhi, India) having a temperature precision of ± 2 °C. Photodegradation studies were performed in a photostabilitychamber (KBF 240; WTB Binder, Tuttlingen,
O
F NC
N
O
F
N
O
F C
N N
O
O
F NC
N
O O
C N
O
F
N O
O
F NC
N O
O
F
N OH
3-Hydroxy citalopram Citalopram carboxamide (A; II) Citalopram cyano N-oxide (B) carboxamide (I)
Citalopram N-oxide (C; IV) Citalopram Di-N-oxide (D) Citalopram butanone (E) 1
2
3
4
5 6
7 8 9
10 11
12
12
Citalopram
H2N O
H2N O
Germany) which was equipped with a light bank consisting of two UV (OSRAM L73) and four luorescent (OSRAM L20) lamps and capable of controlling temperature and relative humidity in the range of ± 2 °C and ± 5%, respectively. The light system complied with Option 2 of the ICH guideline Q1B.12 The LC-UV (liquid
chromatography-ultraviolet detection) analyses were carried on an HPLC system consisted of 515 binary pumps, 2487 dual wavelength detector, Rheodyne manual injector, and Millennium 2.01 software (Waters Corp., Milford, USA). The chromatographic separations were achieved on C8
column (150 mm × 4.6 mm i.d., 5 µm, Spherisorb®) (Waters
Corp., Milford, USA). A Nucleosil C8 (8 mm × 4.6 mm i.d.)
guard column was placed before the analytical column. The photodiode array (PDA) analysis was performed on an HPLC system consisting of a 600 E pump, 996 PDA detector, 717 autoinjector and degasser module (Waters Corp., Milford, USA). The liquid chromatography-mass spectrometry (LC-MS) studies and mass spectral analyses were performed in positive electrospray ionization (+ESI) mode using a Bruker Daltonics GmbH microTOF instrument (Bremen, Germany) controlled by microTOF control software version 2.0. The LC system of LC-MS was an 1100 series liquid chromatograph (Agilent Technologies Inc., Wilmington, USA), controlled by Hystar (version 3.1) software. The column used for LC-MS studies was the same as that for LC-UV analyses. Fourier transform infrared (FT-IR) spectra were recorded using 1711 Perkin Elmer IR spectrophotometer (Shelton, CT, USA) while the nuclear magnetic resonance of 1H (NMR spectrum) was recorded
on Avance II 400 spectrophotometer (Bruker, Fallanden, Switzerland).
Forced decomposition study
The drug was subjected to hydrolytic degradation in 2 mol L-1 HCl, water and 0.2 mol L-1 NaOH at 85 °C over
48 h. The oxidative degradation was performed in 30% H2O2 solution at room temperature over 48 h. For thermal
degradation, the solid drug was sealed in amber coloured borosilicate glass vials, which were maintained at 50 °C for 31 days. The photolytic studies were performed by exposing solid drug spread as a thin layer in Petri-plates as well as drug solutions in 2 mol L-1 HCl, water, and
0.01 mol L-1 NaOH in borosilicate vials to the light in
the photostability chamber for 16 days during which the total light exposure was 1.2 × 10⁶ lux. A parallel set of
solid drug and drug solutions was kept in dark chamber for the same period to serve as dark control. The drug concentration in all solution phase studies was 0.1% m/v. Samples were withdrawn at zero time and at preixed time
intervals. Whenever necessary, they were neutralized by acid or alkali and diluted up to 10 times with mobile phase before injection.
Chromatographic conditions
The drug and all degradation products formed under different forced conditions were optimally resolved on C8
column (150 mm × 4.6 mm i.d., 5µm, Spherisorb®) with
a mobile phase composed of acetonitrile and ammonium acetate buffer (0.025 mol L-1) (35:65 v/v, pH* 4.5) at a low
rate of 0.50 mL min-1. The injection volume was 20 µL,
and the eluent was monitored at 240 nm. The method was validated for its stability-indicating nature. Appropriate blank was injected before each analysis.
Isolation and characterization of degradation product
The major degradation product (II) formed in 0.1 mol L-1 NaOH after reluxing at 85 °C for 35 h was
isolated as ine crystals after neutralizing the solution with 0.1 mol L-1 HCl and cooling the reaction solution in
refrigerator for 24 h. The crystals were iltered, washed with cold water, and dried in a vacuum desiccator. Purity of the product was ascertained by the optimized chromatographic method. Its structure was ascertained by comparing its FT-IR, 1H NMR and mass spectral data with that of the
drug. The other degradation products formed in suficient amounts were characterised through LC-PDA and LC-MS studies (in both –ESI and +ESI modes, i.e. negative and positive ion modes) using a mixed degraded sample which was prepared by mixing drug solutions subjected to different forced conditions so that all degradation products were present in one solution.
Method validation
The optimized method was validated by evaluating linearity, precision, accuracy, limit of detection (LOD), limit of quantitation (LOQ), selectivity and ruggedness as per ICH guidelines Q2(R1).13
Linearity and range
A stock solution of CTL (1 mg mL-1) in water was
prepared in triplicate and each solution was serially diluted with mobile phase to prepare standard solutions having concentrations in the range of 5 to 500 µg mL-1. Each set
Precision
The intra-day precision was evaluated by analysing (n = 6) each of the three drug concentrations (40, 80 and 160 µg mL-1) on the same day. The same drug
concentrations were analysed on three different days to evaluate inter-day precision. The precisions were expressed as percent relative standard deviation (% RSD) of the calculated concentrations.
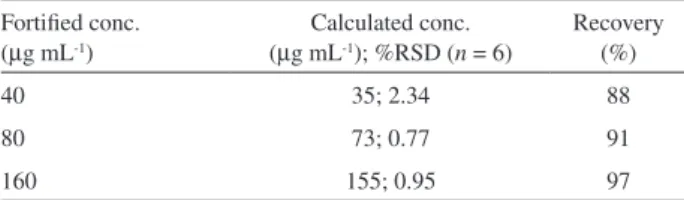
Accuracy
The photodegraded drug solutions in acidic and alkaline media were mixed in equal proportions to prepare a mixed degraded solution. The later was mixed further mixed with equal volume of mobile phase to prepare unfortiied sample solution. It was also mixed separately with an equal volume of each of the three standard drug solutions (80, 160 and 320 µg mL-1) so that the drug concentrations in the mixed
solution was fortiied by 40, 80, 160 µg mL-1, respectively.
The unfortiied and each of the fortiied solutions was prepared and analysed in triplicate. The accuracy was expressed a percent recovery of the drug from the fortiied solutions vis-à-vis unfortiied solution.
LOD, LOQ and selectivity
The LOD and LOQ of the drug was determined by signal-to-noise ratio method by measuring signals from samples with known low concentrations of drug (0.5, 1.0, 5.0 µg mL-1 for LOQ and 0.25, 0.50, 1.0 µg mL-1 for
LOD). The signals were compared with those of blank to establish the minimum concentration at which the analyte was reliably detected or quantiied. The overall selectivity was established through determination of purity and resolution factor of each degradation product peak using a PDA detector.
Robustness
Various chromatographic parameters including low rate, detection wavelength, and mobile phase composition were slightly varied deliberately and the mixed degraded solution was analysed (n = 3) using optimized as well as each varied chromatographic conditions. The calculated drug concentration obtained through each varied conditions was compared with that obtained through the optimized conditions.
Results and Discussion
Development of SIAM
Initially a standard drug solution and drug solutions subjected to varied forced degradation conditions were
chromatographed on a C18 column (150 mm × 4.6 mm i.d.,
Spherisorb®) with mobile phase composed of phosphate
buffer (0.02 mol L-1, pH 3.0) and acetonitrile (60:40 v/v)
flowing at a rate of 0.8 mL min-1 using 240 nm as
detection wavelength. The drug eluted at 4.5 min but degradation products formed under different conditions were not resolved. The phosphate buffer was replaced with ammonium acetate buffer to make the method LC-MS compatible, and flow rate was decreased to 0.4 mL min-1 to resolve the degradation products. It eluted
the drug at 19.1 min but degradation products formed in photodegraded drug solution in 2 mol L-1 HCl were not
resolved. To optimize the chromatographic conditions for separation of drug and all degradation products in a single isocratic run, the mixed degraded solution was employed so that all degradation products were present in one solution. Numerous alterations in low rate and mobile phase compositions did not improved resolution of the degradation products. Even use of ternary mobile phase composed of buffer (pH 3.0), acetonitrile, and methanol in varied proportions did not resolve the degradation products.
A critical analysis of structure of the drug followed by prediction of various degradation products based on chemical reactivities of the drug molecule under varied forced degradation conditions and various chromatograms obtained during the method development process suggested that the possible degradation products are polar than the drug itself. Further, differences in polarities of these degradation products were expected to be very small which is responsible for very close elution of these products. Based on this hypothesis, it was predicted that elution of the degradation products may be delayed by increasing polarity of stationary phase. Hence, C18 column was replaced by C8
column (150 mm × 4.6 mm i.d., 5 µm, Spherisorb®) which
was run over by mobile phase composed of ammonium acetate solution (0.02 mol L-1) and acetonitrile (40:60,
pH* 6.0) at a rate of 1 mL min-1. The drug eluted at 19 min
but degradation products were noted as merged peaks ahead of the drug peak. Lowering of pH* to 5.5 increased the sharpness of peaks. Increase in proportion of aqueous phase to 65% and further lowering the pH* to 4.5 improved the resolution with the drug eluting at 34 min. Further increase in aqueous component dashaped the peaks and also delayed drug elution to 80 min. Increase in concentration of ammonium acetate from 0.02 to 0.025 mol L-1 resulted
in a highly resolved chromatogram with all peaks well separated from each other. Hence, the optimum isocratic separation of drug and degradation products was achieved on C8 column (150 mm × 4.6 mm i.d., 5 µm, Spherisorb®)
rate of 0.5 mL min-1 using 240 nm as detection wavelength.
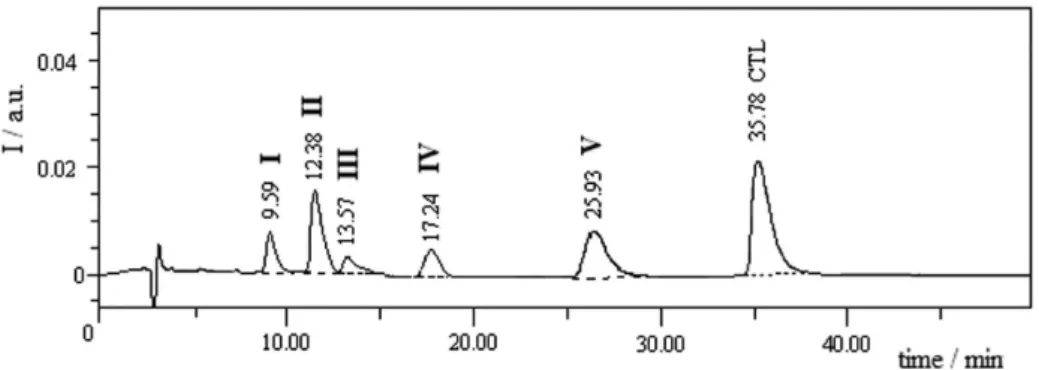
A typical chromatogram of mixture sample is shown in Figure 2. PDA analysis of the mixed solution established the purity of drug and each degradation product peak which indicated the method to be a selective SIAM. The method was applied to analyse samples generated under each forced degradation condition to study degradation behaviour of the drug.
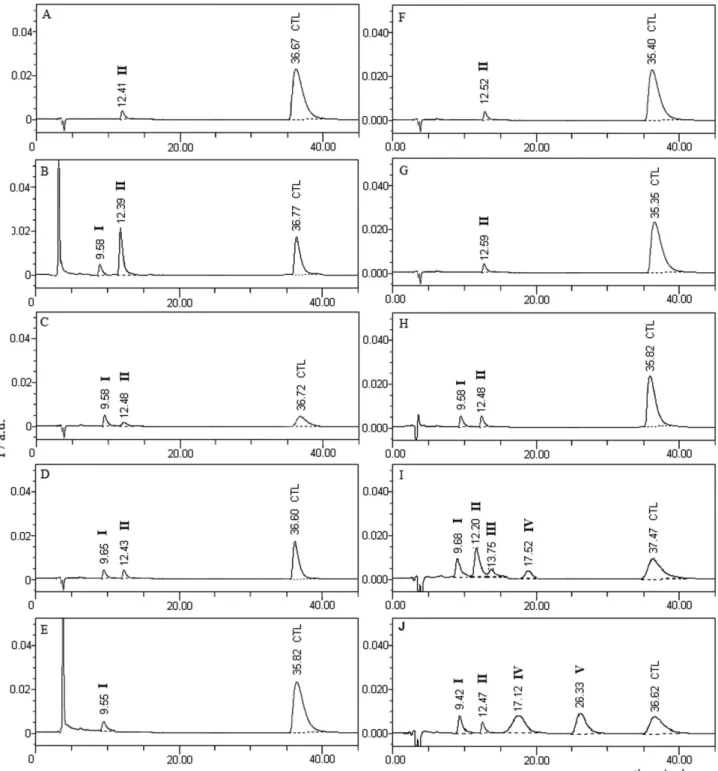
Forced degradation behaviour
In total, ive peaks due to degradation products (I-V) formed under different forced degradation conditions were noted in the chromatograms (Figure 3). Chromatogram of standard solution of drug showed the drug peak (CTL) at 36.67 min along with a small impurity peak (II) at 12.41 min (Figure 3A). The latter was also noted as degradation product in all forced degradation conditions except in oxidative medium. The drug degraded almost completely (98.99%) to product II in 0.1 mol L-1 NaOH
at 85 °C after just 0.5 h. The extent of degradation was significantly decreased in 0.01 mol L-1 NaOH (about
28% after 4 h) and another product I was formed which eluted at 9.58 min (Figure 3B). The rate of degradation was comparatively much lower in acidic medium (about 41% in 2 mol L-1 HCl at 85 °C after 48 h) wherein product II was formed in minute amount along with product I
(Figure 3C). Insigniicant degradation (< 3%) was noted in water at 85 °C (Figure 3D) and in oxidative condition after 48 h (Figure 3E). Exposure of the drug in dry state to temperature of 50 °C (Figure 3F) and UV-Vis light (Figure 3G) resulted in neither any increase in peak area of II nor formation of any other product which suggested that the drug in solid state was stable to heat and light. However, rate and pattern of degradation under photolytic conditions was signiicantly different from that under hydrolytic conditions. The rate of degradation in all media under photolytic condition was accelerated. No product other than I and II was formed in water (Figure 3H) while
products III (RT 13.75 min, i.e. retention time) and IV
(RT 17.52 min) in addition to I and II were formed in alkaline
medium (Figure 3I). A new product V (RT 26.33 min) was
formed along with products I, II and IV in acidic medium (Figure 3J). The peak area of product I in all media under photolytic conditions was greater than under hydrolytic conditions. It suggested that formation of I was accelerated by light. Further, formation of products III-V in acidic and alkaline media upon exposure to light in solution state indicated that the drug is photosensitive.
Characterization of degradation products
The degradation products I, II and IV were characterized (Figure 1) through spectral analyses and LC-MS studies. The major product (II), formed in all forced conditions was isolated from alkali decomposition solution. The comparative FT-IR spectral data of drug and II (Table 1) revealed absence of −C≡N stretching band at 2238 cm-1
in II indicating that nitrile group was absent. Appearance of bands at 3393 cm-1 for N–H stretch, 1601 cm-1 for C=O
stretch (amideIband) and 1559 cm-1 for N–H bend (amide
II band) suggested an amide functionality in II.The C−F stretching and aliphatic C−H bending vibrations were noted in both CTL and II. Comparison of 1H NMR spectra of the
Figure 2. LC chromatogram showing separation of CTL and its all degradation products (I-V) in a single isocratic run.
Table 1. Comparative FT-IR data of CTL and II
Vibrational band Assignment (cm-1)
II CTL
N–H str. (-CONH-) 3393 absent
C–H str. (aromatic) 3067, 3041 3090, 3062
C–H str. (aliphatic) 2956, 2871 2963, 2853
C≡N str. Absent 2238
C=O (-CONH-) 1601 absent
N–H bend 1559 absent
CH2 bend 1482 1487
drug and II (Table 2) revealed that all signals in spectrum of II were almost similarly placed as in that of CTL except an additional 2 proton singlet at δ 7.62 which disappeared upon D2O exchange. It supported the presence of an amide
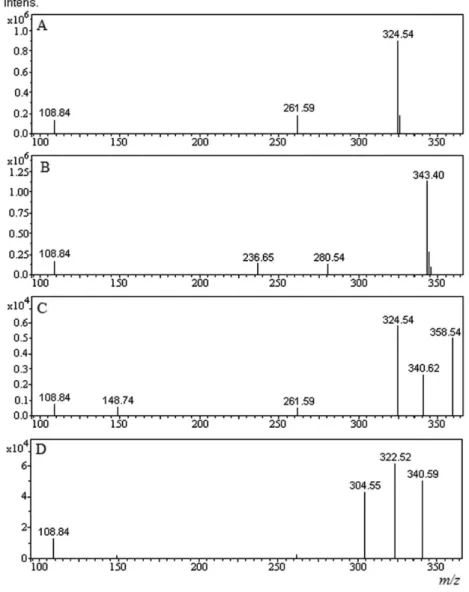
group as also suggested by FT-IR spectra. The mass spectra of CTL and II (Figures 4A and 4B) in +ESI mode showed the parent molecules as M+1 peaks at m/z 324.54 and m/z
343.40 corresponding to molecular masses of 324 and 342,
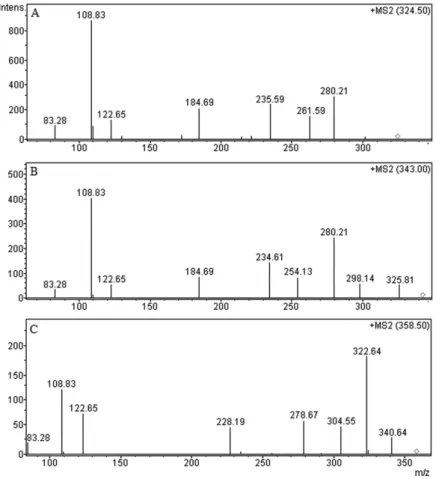
respectively. The even molecular mass of II indicated even number of nitrogen atoms in the molecule similar to the drug. Increase in 18 units in mass of II vis-à-vis drug was attributed to addition of water which was possible under all hydrolytic conditions due to hydrolysis of C≡N group. Further, the MS2 scan of II (Figure 5B) showed a fragment
at m/z 325.81 due to loss of 17 amu which could be formed by loss of NH3 from the parent ion (m/z 343.40). It afirmed
Table 2. Comparative 1H NMR spectral data of CTL and II
Proton* CTL II
δ value Description δ value Description
1 3.14 2H, t, J 7.6 Hz 2.76 2H, t, J 7.6 Hz
2 1.78-1.65 2H, m 2.18-2.14 2H, m
3 2.46-2.30 2H, m 2.30-2.23 2H, m
4,5 7.54-7.50 2H, m 7.49-7.45 2H, m
6,7 7.06-7.01 2H, m 6.97-7.02 2H, m
8 7.57 1H, s 7.34 1H, d, J 8.0
9 7.63 1H, s 7.84 1H, d, J 8.0
10 7.64 1H, d, Jallylic 0.8 Hz 7.64 1H, s
11a 5.27 1H, d, Jgem 13.0 Hz 5.19 1H, d, Jgem 13.0 Hz
11b 5.15 1H, d, Jgem 13.0 Hz 5.09 1H, d, Jgem 13.0 Hz
12 2.76 6H, s 2.47 6H, s
–CONH2 - - 7.62 2H, s
* Refer to Figure 1 for proton assignments.
the presence of a primary amino group in II. Based on these results, the product II was suggested to be formed through hydrolysis of nitrile group to amide without any other change in the drug molecule. It was conirmed by comparative mass fragmentation pattern of CTL and II
(Figure 6) proposed on the basis of their MS and MS2 scans
(Figures 4 and 5). The MS2 scan of CTL (Figure 4A) showed
fragment peaks at m/z 280, 262, 236, 185, 123, 109 and 83. The peaks at m/z 262 and 109 were observed similarly as in a study by Mullera et al.14 The fragmentation pattern
of CTL was conveniently proposed (Figure 6) revealing that fragmentation was triggered by protonation on either nitrogen of dimethylamino or oxygen of benzofuranyl moieties. The heaviest fragment at m/z 280 was formed by loss of dimethylamine (45 amu) from the parent ion (m/z 325) similar to that reported by Raman et al.6 The fragment of m/z
262 was formed either directly from the parent ion6 or from m/z 280 by loss of a H2O molecule through rearrangement.
Loss of an acetylene molecule (26 amu) from tropyllium ion of m/z 262 is proposed to produce fragment of m/z 236, which inally loose CH≡C-C≡N to give fragment of m/z 185. The base peak (m/z 109) and other peaks were proposed to form by another fragmentation pathway involving oxygen of benzofuran. The MS2 scan of product II (Figure 5B) showed
fragment peaks at m/z 298, 280, 254, 235, 185, 123, 109 and 83. The fragment of m/z 298, 280 and 254 were formed from
II (parent ion m/z 343) similarly as fragments of m/z 280, 262 and 236 were formed from the drug. The fragment of
m/z 185 was formed from m/z 236 by loss of CH≡C-C≡N similar to the drug. It supported that the tertiary amino moiety was intact. Formation of fragments of m/z 109, 123 and 83 in both the drug and II by the same fragmentation pathway suggested that no change occurred in the p-luorophenyl ring of the drug molecule. Fragment of m/z 235 which could only be formed by loss of ammonia and subsequent loss of CO (2 amu) to produce fragment of m/z 298 conirmed the presence of –CONH2 group in II. Hence the product II was characterized as 1-(3-dimethylaminopropyl)-1-(4-luorophenyl)-1,3-dihydro-isobenzofuran-5-carboxamide (citalopram carboxamide) which is a known impurity of CTL (Figure 1).
LC-PDA and LC-MS studies
the degradation products. For characterization of degradation products I, III, IV and V, the mixed degraded solution was subjected to LC-MS studies in the +ESI mode. Products
III and V were not detected in the LC-MS chromatogram probably due to poor ionizability or trace concentrations. Change in ionization mode from +ESI to –ESI, numerous variations in ionization conditions including end plate offset, capillary voltage, collision cell RF, nebulizer pressure, dry gas low rate, and dry temperature in both –ESI and +ESI modes, and even use of concentrated degraded solutions did not help detection of these analytes, in LC-MS chromatograms. Hence, these were not characterized in the present study. The line spectra obtained through LC-MS analysis of products I and IV (Figures 4Cand 4D) showed the parent ion peaks (M+1) at m/z 358.54 and 340.59, respectively indicating their molecular masses being 358 and 340, respectively. Their structures were proposed based on their mass values, mass fragmentation pattern, and known chemical reactivities of different functional groups present in CTL in different media.3,4
Figure 6. Proposed common mass fragmentation pattern of CTL and product II.
O F R N O F R N H O F R H H F R OH2 F R F R F R F OH R N F F F
m/z 123 m/z109 m/z83
O F R N H F F
CTL; R = -CN II; R = -CONH2
m/z 325 (M+1); CTL m/z 343 (M+1); II
NH(CH3)2
H2O
m/z 280; CTL m/z 298; II
m/z 262; CTL m/z 280; II
m/z 236; CTL m/z 254; II
m/z 185
HC C R
m/z 325 (M+1); CTL m/z 343 (M+1); II
O
F
N H2N
O O F N O O F N
NH3 CO
m/z 343 (M+1); II m/z 326 m/z 298
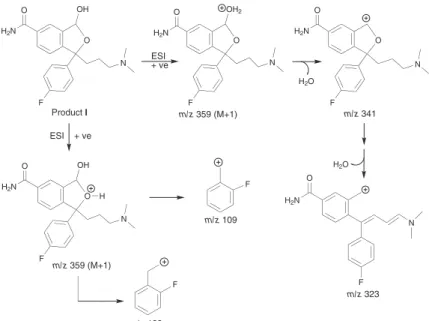
Product I was formed in acidic medium under photolytic as well as hydrolytic conditions. Its even molecular mass (358 amu) indicated even number of nitrogen atoms in it (The Nitrogen Rule). Its structure was characterized through mass fragmentation pattern (Figure 7) proposed through its LC-MS scans. Increase in molecular mass of I by 34 amu with respect to CTL could be attributed to addition of a water molecule (18 amu) and an oxygen atom (16 amu) in the drug molecule. Addition of water was justiied due to hydrolysis of –C≡N group in the drug under hydrolytic conditions to form –CONH2. Formation
of I under photolytic conditions also suggested addition of oxygen atom to form N-oxide in the irst instance. But it is not expected because I is also formed under hydrolytic conditions. The furan ring is reported to be under substitution reaction to form hydroxyfuran through hydroperoxide intermediate in aqueous medium in the presence of air.4 Hence, the lone oxygen atom is suggested
Figure 7. Proposed mass fragmentation pattern of product I.
O
F
N H2N
O
H2O OH
O
F
N
H2N
O OH2
O
F
N H2N
O
F
N H2N
O
m/z 359 (M+1) m/z 341
m/z 323 ESI
+ ve
H2O
F
F
m/z 123
m/z 109
O
F
N H2N
O OH
H
m/z 359 (M+1) ESI + ve Product I
scan of I at m/z 341 which was proposed to form from the parent ion (m/z 358.54) by loss of a H2O molecule (18 amu)
triggered by protonation at –OH group introduced in the furan ring. Further loss of a H2O molecule from m/z 341
through rearrangement was responsible to form another fragment at m/z 323. Fragment peaks at m/z 109 and 123 similarly as in LC-MS scans of CTL and II indicated that the p-luorophenyl moiety is intact. Based on these results and discussions, the most possible structure for
I was proposed to be 1-(3-dimethylaminopropyl)-1-(4- fluorophenyl)-3-hydroxy-1,3-dihydroisobenzofuran-5-carboxylic acid amide (3-hydroxy citalopram carboxamide) (Figure 1).
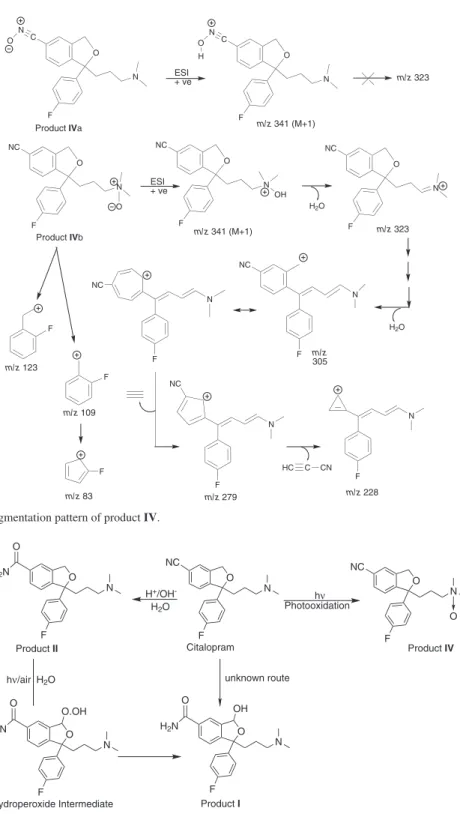
The product IV was formed in acidic medium under photolytic conditions. Its even molecular mass (340 amu) indicated even number of nitrogen atoms in it. Elimination of both the nitrogen atoms from the drug molecule is not possible under the photolytic conditions which implied that both the nitrogen atoms of the drug were intact in IV. Further, a difference of 16 amu with respect to mass of the drug indicated that IV was formed by addition of an oxygen atom to the drug molecule. Under the photolytic conditions, this addition of an oxygen atom is expected to produce an N-oxide product through photoxidation at nitrogen of either the tertiary amino or nitrile group resulting in two possible structures, i.e., citalopram N-oxide (IVa) and citalopram cyano N-oxide (IVb) (Figure 8). IVb seemed to be less probable because nitrogen of C≡N is more electronegative (sp hybridized) in comparison to that of tertiary amine (sp3 hybridized). It makes the photoxidation of C≡N less probable than tertiary amine. The LC-MS2 scan of IV (Figure 5C)
showed fragment peaks at m/z 323, 305, 279, 228, 123, 109
and 83. The mass fragmentation pattern of IV is proposed in Figure 8. The fragment of m/z 323, 305 were possibly formed by loss of two water molecule one after the other from m/z
341 triggered by protonation of oxygen of the N-Oxide at tertiary amine. However, no such fragments can be formed if photoxidation occurs at C≡N group. Further, the peaks at
m/z 123, 109 and 83 were noted similarly as in MS2 scan
of the drug, I and II indicating that the p-luorophenyl ring was intact. Hence, product IV was proposed to be citalopram N-oxide, a known impurity (Figure 1) which is formed by photoxidation of tertiary amino nitrogen of CTL.
Degradation pathways
Based on the above results, the degradation pathways of CTL under hydrolytic and photolytic conditions are outlined in Figure 9. The drug was hydrolysed to product
II through the well-known hydrolytic reaction of nitriles to amides in aqueous media.3 The product I could be
formed from II through substitution reaction at methylene of dihydrobenzofuran ring under the influence of air and light in aqueous environment via a tetrahydrofuran hydroperoxide intermediate.4 Alternatively, the product I could be formed directly from the drug through some unknown route. The drug underwent photoxidation at nitrogen of the tertiary amine to form the product IV.
Method validation
The response for the drug was strictly linear in the concentration range of 5-500 µg mL-1. The mean
Table 3. Intra-day and inter-day precision studies
Actual conc. (µg mL-1)
Measured conc. (µg mL-1); %RSD
Intra-day (n = 6) Inter-day (n = 3)
40 40; 0.58 41; 2.59
80 80; 0.24 80; 1.23
160 159; 0.32 160; 1.12
Figure 8. Proposed mass fragmentation pattern of product IV.
O F NC N O F NC N OH F NC F NC F F F m/z 123 m/z 109 m/z 83 F
Product IVb m/z 341 (M+1)
H2O
m/z 323
m/z 279 m/z 228
HC C CN O
O
F NC
N
H2O
m/z 305 F NC N N N N O F C N
Product IVa m/z 341 (M+1)
N O O F C N N O H
m/z 323 ESI
+ ve
ESI + ve
Figure 9. Degradation pathways of CTL.
NC O F N O F N OH O
H2N
NC O F N O Citalopram Hydroperoxide Intermediate unknown route
Product II Product IV
Product I
H+/OH
H2O
hν Photooxidation O F N O
H2N
O
F
N O.OH O
H2N
hν/air H2O
were found to be 1 µg mL-1 and 5 µg mL-1, respectively. The
resolution of the drug peak from the nearest resolving peak was always > 5 indicating the method speciic to the drug. The method was also selective to degradation products as all the peaks were pure, which was proved through PDA purity studies. Good separations and recoveries were always achieved during robustness studies, indicating that minor deviations in chromatographic conditions do not affect quantiication of CTL.
Conclusions
A systematic forced degradation study on citalopram hydrobromide was performed under the conditions of hydrolysis, oxidation, dry heat and photolysis. Subsequently, an isocratic stability-indicating HPLC-UV method was developed to study the degradation behaviour of the drug under various forced conditions. The drug was found unstable in hydrolytic and photolytic conditions in all media. However, it proved stable to heat and light in solid state. In total ive degradation products (I-V) were formed. The product II was isolated and characterized as citalopram carboxamide which is a known impurity. The products I and
IV were characterized on the basis of mass fragmentation pattern outlined through LC-MS and LC-MS2 studies.
The product IV was characterized as citalopram N-oxide which also a known impurity. However, the product I was characterised as 3-hydroxy citalopram carboxamide. The products III and V were not characterized due to their poor ionization in mass detector. However, characterization of these products may be assisted by use of more advanced techniques like preparative HPLC or preparative LC-MS. Based on the results, degradation pathways were proposed. The method was validated in accordance with the ICH guidelines for determination of the drug. The method proved linear, precise, accurate and robust for quantiication of citalopram with suficient sensitivity. It was speciic to the drug and selective for each degradation product.
Acknowledgement
The authors are thankful to Prof. Saranjit Singh, Head of Department of Pharmaceutical Analysis, National Institute
of Pharmaceutical Education and Research, SAS Nagar, India of for facilitating photodegradation and LC-MS studies and to Ind-Swift Laboratories, Panchkula (India) for providing citalopram hydrobromide as a generous gift to conduct the study.
References
1. Hyttel, J.; Prog. Neuro-Psychoph. 1982, 6, 277; Pallanti, S.; Quercioli, L.; Paiva, R. S.; Koran, L. M.; Eur. Psych. 1999, 14, 101.
2. Egashira, N,; Matsumoto, Y.; Mishima, K.; Iwasaki, K.; Fujioka, M.; Matsushita, M.; Shoyama, Y.; Nishimura, R.; Fujiwara, M.;
Pharmacol. Biochem. Behav.2006, 83, 161.
3. March, J.; Advanced Organic Chemistry: Reactions, Mechanisms and Structure, 4th ed., Wiley Interscience: New
York, 1992, pp. 887.
4. Badger, G. M.; The Chemistry of Heterocyclic Compounds, 1st ed., Academic Press: New York, 1961.
5. Molcan Corporation, available: www.molcan.com/impurity.htm accessed in October 2007; LGC Standards - Global quality management solutions for the laboratory, available: www. lgcstandards.com Pharmaceutical Reference Substance and Impurities Newsletter 2007, 3.
6. Raman, B.; Sharma, B. A.; Ghugare, P. D.; Karmuse, P. P.; Kumar, A.; J. Pharm. Biomed. Anal.2009, 50, 377.
7. ICH Q3A(R2) Impurities in New Drug Substances, In
International Conference on Harmonization, IFPMA, Geneva,
2006; ICH Q3B(R2) Impurities in New Drug Products. International Conference on Harmonization, IFPMA, Geneva,
2006.
8. ICH Q1A(R2) Stability Testing of New Drug Substances and Products, In International Conference on Harmonization,
IFPMA, Geneva, 2003.
9. Kwon, J.-W.; Armbrust, K. L.; Environ. Toxicol. Chem. 2005, 24, 1618; Narasa, A.; thesis available: www.eprints. csirexplorations.com/46/1/Abstract.docx, 2008, chapter 3. 10. Meng, Q. H.; Gauthier, D.; Clin. Biochem. 2005, 38, 282; Zhang, R.; Xiao, S.; Xu, H.; Huang, R.; Xia, Z.; Chinese J. Anal. Chem. 2006, 34, 1384; Kosel, M.; Eap, C. B.; Amey, M.; Baumann, P.;
J. Chromatogr. B: Biomed. Sci. Appl. 1998, 719, 234; Greiner, C.; Hiemke, C.; Bader, W.; Haen, E.; J. Chromatogr. B 2007,
848, 391; Andersen, S.; Halvorsen, T. G.; Pedersen-Bjergaard,
S.; Rasmussen, K. E.; Tanum, L.; Refsum, H.; J. Pharm. Biomed. Anal. 2003, 33, 263; Nevado, J. J. B.; Llerena, M. J. V.; Cabanillas, C. G.; Robledo, V. R.; J. Chromatogr. A 2006, 1123, 130; Pistos, C.; Panderi, I.; Atta-Politou, J.; J. Chromatogr. B 2004, 810, 235; Rao, R. N.; Raju, A. N.; Nagaraju, D.; J. Pharm. Biomed. Anal.2006, 41, 280; Juan, H.; Zhiling, Z.; Huande, L.;
J. Chromatogr. B 2005, 820, 33; Kristoffersen, L.; Bugge, A.;
Lundanes, E.; Slørdal, L.; J. Chromatogr. B: Biomed. Sci. Appl. Table 4. Recovery studies
Fortiied conc. (µg mL-1)
Calculated conc. (µg mL-1); %RSD (n = 6)
Recovery (%)
40 35; 2.34 88
80 73; 0.77 91
1999, 734, 229; Macek, J.; Ptacek, P.; Klíma, J.; J. Chromatogr.
B: Biomed. Sci. Appl. 2001, 755, 279.
11. European Pharmacopoeia,6th ed., 2009, Suppl. 6.4, pp. 4605; United States Pharmacopoeia2005, 31, 1778.
12. ICH Q1B Photostability Testing of New Drug Substances and Products, In International Conference on Harmonization,
IFPMA, Geneva, 1996.
13. ICH Q2(R1) Validation of Analytical Procedures: Text and Methodology, In International Conference on Harmonization,
IFPMA, Geneva, 2005.
14. Mullera, C.; Vogta, S.; Goerkea, R.; Kordonb, A.; Weinmanna, W.; Forensic Sci. Int. 2005, 113, 415.
Submitted: July 1, 2010