Introduction
The effects of the use of the mask for gas analysis
on the submaximal and maximal physiological
and perceptual variables in response to an incremental test
CDD. 20.ed. 796.022 796.426
http://dx.doi.org/10.1590/1807-55092016000300533
Danilo Fernandes Da SILVA* Fábio Yuzo NAKAMURA**
Fabiana Andrade MACHADO*
*Centro de Ciências da Saúde, Universidade Estadual de Maringá, Maringá, PR, Brasil. **Centro de Educa-ção Física e Esporte, Universidade Estadual de Londrina, Londrina, PR, Brasil.
Th e maximum aerobic velocity (MAV) predicts running performance of middle and long distance athletes1-2. Moreover, it can be used in the control and prescription of exercise training3. Th e MAV represents the minimum velocity associated with the maximum oxygen consumption (VO2max)1 and, it is an indicative of the individual aerobic power.
In the 80th and 90th diff erent methodologies have been proposed to determine the MAV. However, these methods have resulted in contradictory results (i.e., diff erences in velocity values)9. Moreover, the protocol selection can infl uence this measure10-11. Noakes et al.2 demonstrated that the Scrimgeour et al.7 method, based on peak velocity (Vpeak), performed with an incremental protocol on a treadmill, is capable to
predict runners’ performance in long distance races (10 to 90 km). Additionally, the authors suggested that muscular factors related to power capacity, and not the cardiovascular system, limited this variable.
Th e use of Vpeak to monitor athletes’ performance during a season has many advantages for coaches and researchers, given that it can be determined without the mask for gas analysis and neither more invasive techniques, such as blood collection (e.g., blood lactate). However, several previous studies have determined the Vpeak with these procedures2,12. To the best of authors knowledge, only one study determined the Vpeak with a “clean” protocol (that is, without the mask) and showed a correlation of 0.89 in a 16 km time-trial1.
Abstract
This study aimed to determine the effects of using the mask to gas analysis on maximal and submaximal physiological and perceptual variables during an incremental test. We assessed 21 recreationally endurance trained runners (VO2max: 54.0 ± 7.6 mL·kg-1·min-1) aged 30 to 49 years. These runners were submitted to two different incremental tests in randomized order to determination of maximum aerobic velocity (MAV), being used in one of them the equipment to gas analysis and not in the other. Peak velocity (Vpeak) was determined based on KUIPERS et al.17 adjustment. It was also analyzed physiological (HR and
%HRmax) and perceptual (RPE) variables in each stage to comparison between protocols. Runners did a 10 and 15 km performance in fi eld track to verify the relationship with maximal aerobic speed obtained in both protocols. The use of the mask for gas analysis reduced Vpeak, but did not modify HRmax and RPEmax. In regard to submaximal variables, HR was infl uenced mainly in initial stages in which values were higher in the test which the mask was used. However, when expressed as %HRmax, runners remained in the majority of submaximal stages in higher percentages during the protocol with mask. For RPE, there was no signifi cant difference, except in the stage of 10 km·h-1, which RPE was higher when the mask was used. MAV is reduced when mask is used to gas analysis and HR and %HRmax in submaximal stages are higher due to the use of this equipment especially in initial stages.
Th e eff ects of the use of a mask for gas analysis on Vpeak are currently not clear; moreover, there are no information of such apparatus/equipment in other variables like heart rate (HR) and rating of perceived exertion (RPE), in submaximal- and maximal-stages during an incremental protocol. Given that these variables are frequently used for aerobic exercise prescription in different physiologic exercise zones13-14, it is important to understand if there are any diff erences between a maximum incremental test with and without the gas analysis mask.
Method
Participants
Thus, the present study aimed to determine the eff ects of the use of a gas analysis mask on physiological and perceptual submaximal and maximal variables in response to an incremental protocol. As individuals could increase the degree of vigilance and activation due to the discomfort caused by the gas analysis mask and, that vigilance, specifically, may affect HR15, our hypothesis is that the use of a gas analysis mask would alter the cardiovascular system response, increasing the individuals’ HR, especially in the submaximal stages.
Twenty-one runners, aged between 30 to 49 years (age: 41.2 ± 6.9 years; body mass: 75.4 ± 11.4 kg; height: 173.9 ± 7.8 cm; body mass index: 24.8 ± 2.4 kg.m-2 and; VO
2max: 54.0 ± 7.6 mL.kg -1. min-1), with running experience in the 5 and 15 km races (average time practice 10.9 ± 11.1 years) participated in the present study. All participants gave their informed consent before the enrollment in the study. Th e study was approved by the local Ethics Committee (n. 539/2011).
Experimental design
Initially, participants were familiarized with the ergometer (automatic ergometer treadmill, IBRAMED Super ATL, Porto Alegre - Brasil). Th en, all participants performed in a randomized order two continuous maximum incremental test, with inclination fi xed at 1%, to determine the MAV. Participants were instructed not to feed two hours before tests, abstain from caff eine or alcohol and do not perform any strenuous physical exercise 48 hours before test. A 48-hour interval was allotted between each test.
Maximum oxygen consumption (VO2max) and peak velocity with the mask
for gas analysis (Vpeak_C)
Firstly, participants warmed-up for three minutes at 7 km.h-1 on a treadmill. Th en, the incremental protocol started at 9 km.h-1 and, the velocity were incremented at 1 km.h-1 every three minutes. Th e protocol was performed to maximum voluntary exertion and participants were verbally encouraged throughout the
test. At the end of each stage, the HR (Polar RS800, Kempele - Finlândia) and RPE on a 6 to 20 Borg scale were recorded16. Th e percentage of maximum heart rate (%HRmax), considered the highest value attained during the incremental test, was also recorded for analysis.
Th e gas analysis was performed with an open ergoespirometry system Fitmate (COSMED®, Roma - Italy), which provide values regarding the ventilatory and respiratory every 15 seconds. VO2max were considered the maximum value attained during the incremental test. All test were performed until voluntary exertion and participants were verbally encouraged to perform the test as long as possible. To be considered valid, participants must have meet a RPE ≥ 19 on the Borg scale16.
The Vpeak_C with the gas analysis mask was considered as the maximum running velocity attained during the incremental test. If participant was not able to reach the last stage, Vpeak was estimated based on the partial time in the last attained stage, with the equation proposed by Kuipers et al.17:
Vpeak = vcompleted + t/T*incremental velocity vcompleted = velocity (km.h-1) in the last
completed stage;
t = total time (seconds) in the last incomplete stage; T = total duration (seconds) of the completed stage (ex.: 180 s);
Incremental velocity = increase velocity rate in each stage (km.h-1).
Determination of peak velocity without gas analysis mask (Vpeak_S)
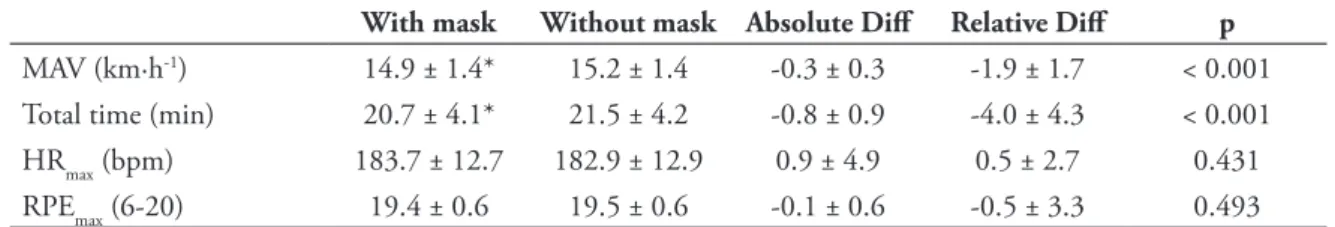
Th e comparison with mask vs. without mask for maximum aerobic velocity (MAV), total incremental test time, maximum heart rate (HRmax) and rating of perceived exertion at the end of the test (RPEmax) are described in TABLE 1. Eighteen out of twenty-one participants showed higher Vpeak_S values as compared with Vpeak_C, just one
Two fi eld test (i.e., practical test) were performed in order to verify the average velocity of the runners in a 10 and 15 km trials. Similar to the laboratory tests, interval between the two fi eld tests were at least 48 hours apart. Th e fi eld tests were performed in an offi cial athletics track (400 m) after a 10
Field test: 10 and 15 km performance
Statistical analysis
Data are present as mean ± standard deviation (SD). All data were analyzed with the Statistical Package for the Social Science 13.0 software (SPSS, Inc., USA). Data normality were verifi ed with the Shapiro-Wilk test. Th e maximum variables (MAV, HRmax and maximum RPE [RPEmax]) as well as the submaximal (HR and RPE in the submaximal stages) were compared with a dependent t-test (i.e., with mask vs. without mask). Th e correlation between Vpeak_C and Vpeak_S with the performance in the 10 and 15 km trials were performed with Pearson correlation test. Signifi cance level was set at p < 0.05.
Results
perform the maximum eff ort as long as possible. Th e criteria for Vpeak_S were the same as for the VO2max with gas analysis mask described above.
Th e Vpeak_S was considered the maximum running velocity attained during the incremental test. If any participant was not able to reach the last stage, the Vpeak_S was calculated with the same criteria adopted for the Vpeak_C according to the Kuipers et al.17 equation.
demonstrated otherwise, while the remaining two presented similar values. Th e statistical analysis showed Vpeak_S were significantly higher as compared with Vpeak_C (1.9 ± 1.7 %), given that participants remained more time in the Vpeak_S protocol. Th ere were no signifi cant diff erences for HRmax neither RPEmax.
TABLE 1 - Mean ± standard deviation (SD), absolute difference (absolute Diff) and relative difference (relative Diff) for the comparison with mask vs. without mask: maximum aerobic velocity (MAV), incremental test total time, maximum heart rate (HRmax) and rating of perceived of exertion at the end of the test (RPEmax) (n = 21).
With mask Without mask Absolute Diff Relative Diff p
MAV (km·h-1) 14.9 ± 1.4* 15.2 ± 1.4 -0.3 ± 0.3 -1.9 ± 1.7 < 0.001
Total time (min) 20.7 ± 4.1* 21.5 ± 4.2 -0.8 ± 0.9 -4.0 ± 4.3 < 0.001
HRmax (bpm) 183.7 ± 12.7 182.9 ± 12.9 0.9 ± 4.9 0.5 ± 2.7 0.431
RPEmax (6-20) 19.4 ± 0.6 19.5 ± 0.6 -0.1 ± 0.6 -0.5 ± 3.3 0.493
*p < 0.05 as compared with the without mask group.
minutes warm-up. Th e mean velocity was calculated according to the total time to complete the test.
TABLE 2, 3 and 4 describes the comparison for submaximal variables: HR, percentage of HR (%HR) and RPE. Data are presented for all stages up to 18 km.h-1, as this represents the last velocity
that more than one participant attained.
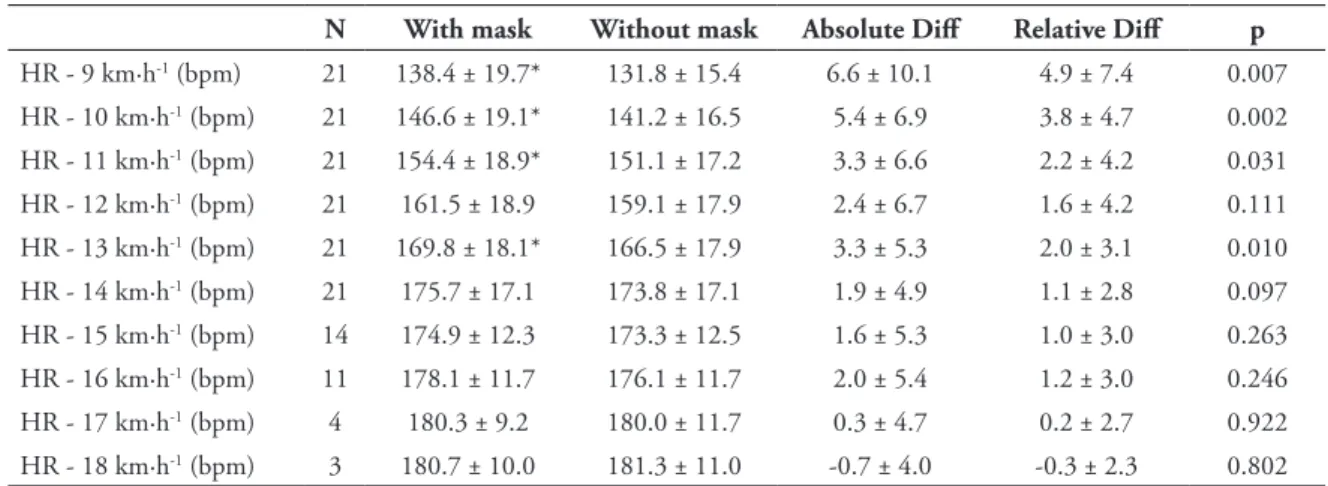
Th e with mask group showed higher HR values than the without mask one at stages 9, 10, 11 and 13 km.h-1, with percentage diff erences for these
velocities between 2.0 ± 3.1 % and 4.9 ± 7.4 %. Th e percentage diff erence between HR reduced as the test velocity increased, except for the transition between 12 and 13 km.h-1 and 15 and 16 km.h-1.
Th e comparison for %HR at submaximal stages showed, similar to the HR, signifi cantly higher values for the with mask group as compared with the clean one (i.e., without the mask). However, the diff erences were observed in more velocities (9, 10, 11, 13, 14, 16 and 17 km.h-1). Th e percentage diff erences in
%HR between protocols at velocities in which there were statistical diff erences varied between 0.6 ± 1.3 % and 4.4 ± 7.0 %, whereas the initial stages showed the higher percentage diff erences.
TABLE 2 - Mean ± standard deviation (SD), absolute difference (absolute Diff) and relative difference (relative Diff) for the comparison with mask vs. without mask at stages 9 to 18 km.h-1.
*p < 0.05 as compared with the without mask group.
N With mask Without mask Absolute Diff Relative Diff p
HR - 9 km·h-1 (bpm) 21 138.4 ± 19.7* 131.8 ± 15.4 6.6 ± 10.1 4.9 ± 7.4 0.007
HR - 10 km·h-1 (bpm) 21 146.6 ± 19.1* 141.2 ± 16.5 5.4 ± 6.9 3.8 ± 4.7 0.002
HR - 11 km·h-1 (bpm) 21 154.4 ± 18.9* 151.1 ± 17.2 3.3 ± 6.6 2.2 ± 4.2 0.031
HR - 12 km·h-1 (bpm) 21 161.5 ± 18.9 159.1 ± 17.9 2.4 ± 6.7 1.6 ± 4.2 0.111
HR - 13 km·h-1 (bpm) 21 169.8 ± 18.1* 166.5 ± 17.9 3.3 ± 5.3 2.0 ± 3.1 0.010
HR - 14 km·h-1 (bpm) 21 175.7 ± 17.1 173.8 ± 17.1 1.9 ± 4.9 1.1 ± 2.8 0.097
HR - 15 km·h-1 (bpm) 14 174.9 ± 12.3 173.3 ± 12.5 1.6 ± 5.3 1.0 ± 3.0 0.263
HR - 16 km·h-1 (bpm) 11 178.1 ± 11.7 176.1 ± 11.7 2.0 ± 5.4 1.2 ± 3.0 0.246
HR - 17 km·h-1 (bpm) 4 180.3 ± 9.2 180.0 ± 11.7 0.3 ± 4.7 0.2 ± 2.7 0.922
HR - 18 km·h-1 (bpm) 3 180.7 ± 10.0 181.3 ± 11.0 -0.7 ± 4.0 -0.3 ± 2.3 0.802
TABLE 3
-TABLE 4 - Mean ± standard deviation (SD), absolute difference (absolute Diff) and relative difference (relative Diff) for the comparison with mask vs. without mask: rating of perceived exertion (RPE) at stages 9 up to 18 km.h-1.
Mean ± standard deviation (SD), absolute difference (absolute Diff) and relative difference (relative Diff) for the comparison with mask vs. without mask: maximum heart rate percentage (%HR) at stages 9 up to 18 km.h-1.
*p < 0.05 as compared with the without mask group.
N With mask Without mask Absolute Diff Relative Diff p
%HRmax - 9 km·h-1 21 75.1 ± 7.0* 72.0 ± 5.4 3.2 ± 4.9 4.4 ± 7.0 0.008
%HRmax - 10 km·h-1 21 79.6 ± 6.3* 77.1 ± 5.5 2.5 ± 3.3 3.3 ± 4.3 0.002
%HRmax - 11 km·h-1 21 83.9 ± 6.1* 82.5 ± 5.5 1.4 ± 2.6 1.7 ± 3.1 0.025
%HRmax - 12 km·h-1 21 87.8 ± 6.2 86.8 ± 5.8 0.9 ± 2.3 1.1 ± 2.7 0.083
%HRmax - 13 km·h-1 21 92.3 ± 5.3* 90.9 ± 5.9 1.3 ± 2.0 1.6 ± 2.4 0.006
%HRmax - 14 km·h-1 21 95.5 ± 4.7* 95.0 ± 5.1 0.6 ± 1.2 0.6 ± 1.3 0.048
%HRmax - 15 km·h-1 14 96.8 ± 3.4 96.2 ± 4.1 0.6 ± 1.2 0.7 ± 1.2 0.074
%HRmax - 16 km·h-1 11 98.6 ± 2.1* 97.7 ± 3.4 0.9 ± 1.3 1.0 ± 1.4 0.048
%HRmax - 17 km·h-1 4 99.3 ± 1.0* 98.0 ± 1.8 1.3 ± 0.8 1.3 ± 0.8 0.046
%HRmax - 18 km·h-1 3 100.0 ± 0.0 99.8 ± 0.3 0.2 ± 0.3 0.2 ± 0.3 0.423
N With mask Without mask Absolute Diff Relative Diff
p
RPE - 9 km·h-1 21 9.2 ± 1.5 8.8 ± 1.6 0.4 ± 1.2 5.4 ± 14.1 0.162
RPE - 10 km·h-1 21 10.6 ± 1.8* 9.9 ± 1.8 0.7 ± 1.5 8.3 ± 14.8 0.036
RPE - 11 km·h-1 21 12.1 ± 2.1 11.6 ± 2.2 0.4 ± 1.3 4.7 ± 11.9 0.154
RPE - 12 km·h-1 21 13.4 ± 2.5 13.5 ± 2.5 -0.1 ± 1.5 -0.2 ± 10.9 0.883
RPE - 13 km·h-1 21 15.6 ± 3.0 15.2 ± 3.0 0.4 ± 1.5 3.2 ± 10.7 0.268
RPE - 14 km·h-1 21 17.3 ± 2.7 17.2 ± 3.0 0.1 ± 1.5 1.5 ± 10.8 0.771
RPE - 15 km·h-1 14 17.9 ± 3.1 17.5 ± 3.3 0.4 ± 1.4 2.6 ± 9.0 0.373
RPE - 16 km·h-1 11 18.8 ± 1.7 18.4 ± 1.9 0.5 ± 0.7 2.7 ± 4.3 0.053
RPE - 17 km·h-1 4 19.5 ± 0.6 19.0 ± 1.4 0.5 ± 1.0 2.9 ± 5.9 0.391
RPE - 18 km·h-1 3 19.7 ± 0.6 20.0 ± 0.0 -0.3 ± 0.6 -1.7 ± 2.9 0.423
*p < 0.05 as compared with the without mask group.
observed was at the 10 km.h-1, in which the
perception of eff ort was higher for the gas analysis mask. Th e range for diff erences were -1.7 ± 2.9 %
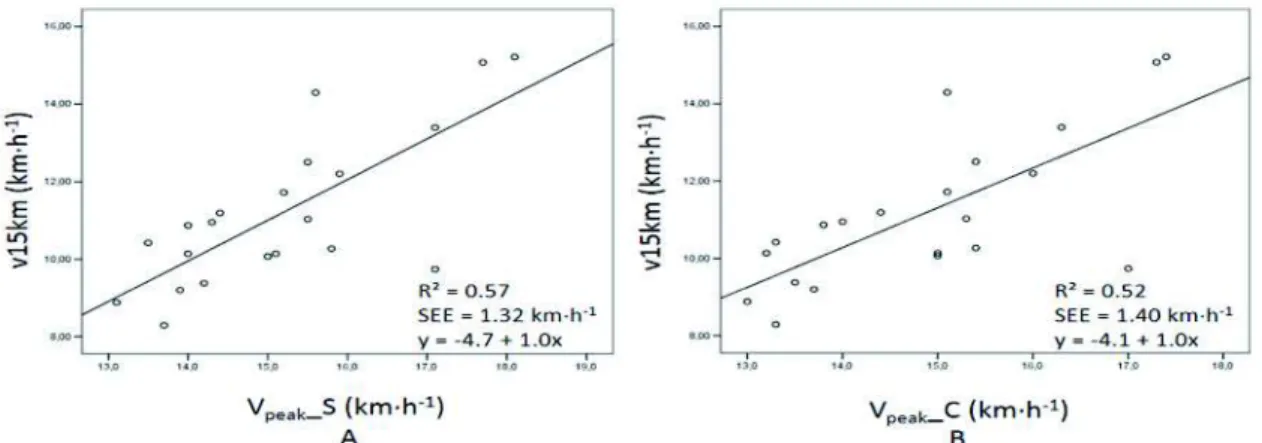
Th e correlation between Vpeak_C and Vpeak_S protocol was 0.98 (p < 0.05). FIGURES 1 and 2 presents the correlation between Vpeak_C and Vpeak_S with the 10 and 15-km performance
trials, respectively. It was observed a slightly lower correlation for the Vpeak_C when compared with the Vpeak_S, for the 10 km (r = 0.75 and r = 0.77) and the 15 km trial (r = 0.72 and r = 0.75).
FIGURE 1 - Correlation between the Vpeak_S and performance in the 10 km (A) an between the Vpeak_C and the same trial (B) in 21 subjects.
FIGURE 2 - Correlation between the Vpeak_S and performance in the 15 km (A) an between the Vpeak_C and the same trial (B) in 21 subjects.
Discussion
The present study aimed to determine the eff ects of the use or not of the gas analysis mask on physiological and perceptual submaximal and maximal variables in response to an incremental test. Th e main result was the use of the gas analysis mask reduced Vpeak (i.e., MAV) values, however, it did not infl uence neither HRmax nor RPEmax. Regarding submaximal variables, HR was mostly infl uenced at initial stages, in which the gas analysis mask group showed higher HR values. However, expressing HR as percentage (%HR) showed participants remained mostly with higher values at submaximal stages when the gas analysis mask were used. For RPE, there was no signifi cant diff erence between protocols, except to stage 10 km.h-1, in
which the RPE showed higher values for the gas analysis mask as compared with the without mask group. It seems important to highlight RPE values were systematically higher with the use of the mask at all stages, except to stage 12 km.h-1. In addition, Vpeak_S demonstrated a slightly higher correlation with the performance test of 10 and 15 km when compared with Vpeak_C.
any equipment for gas analysis neither blood samples1
and, to the best of authors knowledge, the specifi c impact of the use of such equipment associated with Vpeak had not been studied. In light with the results from the present study, it seems interesting to suggest gas analysis mask induce a discomfort to participants, anticipating test interruption, on average, 0.8 ± 0.9 minutes earlier.
It is possible that this discomfort increases the degree of surveillance and participants’ activation. Specifi cally, surveillance seems to alter %HR15; thus, the responses induced by the discomfort associated with the use of the mask could explain the HR and %HRmax during submaximal stages of the incremental test. Apparently, the use of the gas analysis mask stimulates the cardiovascular response, increasing participants’ HR and %HRmax, particularly at the initial submaximal stages of the incremental test. Th e diff erences in %HRmax during the fi nal submaximal stages may be explained by diff erences in HRmax response between protocols. Although not statistically signifi cant, the average HRmax was 0.9 ± 4.9 bpm lower without the mask as compared with the use of the mask.
Albeit HR during exercise be determined by neural mechanism related to the sympathetic nervous system activity21, the mechanisms associated with the earlier effort interruption, due to the uncomfortable perception induced by the mask, needs further elucidation. Although the perceived of exertion during exercise be regulated by central mechanisms22, Smirmaul23 suggests that other unpleasant sensations, such as temperature and pain, may infl uence the aff erent sensorial response. Th us, it is possible that the discomfort induced by the mask was associated with an eff erent sensorial response.
Previous studies suggest that HR at submaximal stages has a high reliability; however, their values tend to be lower in the re-test20,24-26, possibly due to a subjects’ familiarization to the protocol25. Nevertheless, in the present study, the tests protocols (i.e., with or without the mask) were performed in a randomized order, reducing potential bias associated with this factor.
On the other hand, except for the 10 km.h-1 stage, RPE responses were not statistically diff erent
between protocols. Given that RPE has some reliability issues as previously demonstrated25, 27-28, it is hard to drawn precise conclusions regarding the eff ects of the use or not of the mask on this variable. We highlight, however, that for most of the submaximal loads, the RPE values tended to be higher in the mask protocol as compared with the without mask one.
Previous studies demonstrated that the Vpeak predicts performance in middle and long distance races1, 12, 29, especially if evaluated with a three minutes protocol29. In the present study, V
peak_S assessed with a “clean” protocol (no mask for gas analysis) showed slightly higher correlations with the 10 and 15 km trials performance when compared with the Vpeak_C, highlighting the importance to use protocols with similar characteristics to evaluate the MAV.
Although the lactate concentrations is considered the gold-standard method to determine the anaerobic threshold30, the present study could not verify the eff ects of the mask on this parameter. Th is was mainly due to the characteristics of the clean protocol to assess Vpeak used herein. In this sense, the analysis of the lactate threshold would compromised the protocol characteristics. Even though, future studies should investigate the eff ects of the gas analysis mask on the lactate concentrations, as well as its respective threshold, given that this is a common practice utilized to optimize participants’ assessment. We also suggest the necessity to investigate the possible eff ects of the mask between the running velocity and HR and, its precision on training prescription, that usually is performed without the mask. In other words, training velocity determined without the mask may underestimate the velocity at a specifi c HR target zone, if prescription was based on a protocol with the gas analysis mask.
References
1. McLaughlin JE, Howley ET, Bassett Jr DR, Th ompson DL, Fitzhugh EC. Test of classic model for predicting endurance running performance. Med Sci Sports Exerc. 2010;42:991-7.
2. Noakes TD, Myburgh KH, Schall R. Peak treadmill running velocity during the VO2max test predicts running perfor-mance. J Sports Sci. 1990;8:35-45.
3. Buchheit M, Chivot A, Parouty J, et al. Monitoring endurance running performance using cardiac parasympathetic function. Eur J Appl Physiol. 2010;108:1153-67.
4. Billat V, Renoux JC, Pinoteau J, Petit B, Koralsztein JP. Times to exhaustion at 100% of velocity at VO2max and modeling of the time-limit / velocity relationship in elite long-distance runners. Eur J Appl Physiol. 1994;69:271-3.
5. Lacour JR, Padilla-Magunacelaya S, Barthélémy JC, Dormois D. Th e energetics of middle-distance running. Eur J Appl Physiol. 1990;60:38-43.
6. di Prampero PE. Th e energy cost of human locomotion on land and in water. Int J Sports Med. 1986;7:5-72. 7. Scrimgeour AG, Noakes TD, Adams B, et al. Th e infl uence of weekly training distance on fractional utilization of
maximum aerobic capacity in marathon and ultramarathon runners. Eur J Appl Physiol. 1986;55:202-9.
8. Daniels J, Scardina N, Hayes J, Foley P. Elite and subelite female middle- and long- distance runners. In: Landers DM. Sport and elite performers. Champaign: Human Kinetics; 1984.
9. Hill DW, Rowell AL. Running velocity at VO2max. Med Sci Sports Exerc. 1996;28:114-9.
10. Machado FA, Kravchychyn AC, Peserico CS, da Silva DF, Mezzaroba PV. Eff ect of stage duration on maximal heart rate and post-exercise blood lactate concentration during incremental treadmill tests. J Sci Med Sport. 2013;16:276-80. 11. Kuipers H, Rietjens G, Verstappen F, Schoenmakers H, Hofman G. Eff ects of stage duration in incremental running
tests on physiological variables. Int J Sports Med. 2003;24:486-91.
12. Scott BK, Houmard JA. Peak running velocity is highly related to distance running performance. Int J Sports Med. 1994;15:504-7.
13. Cunha FA, Farinatti PTV, Midgley AW. Methodological and practical application issues in exercise prescription using the heart rate reserve and oxygen uptake reserve methods. J Sci Med Sport. 2011;14:46-57.
Resumo
Efeitos do uso da máscara para análise de gases sobre variáveis fi siológicas e perceptuais máximas e submáximas durante um teste incremental
Este estudo teve como objetivo determinar os efeitos do uso da máscara para análise de gases sobre variáveis fi siológicas e perceptuais máximas e submáximas durante um teste incremental. Foram ava-liados 21 corredores recreacionais de “endurance” (VO2max: 54,0 ± 7,6 mL·kg-1·min-1) com idade entre 30 e 49 anos. Os mesmos foram submetidos a dois diferentes testes incrementais em ordem aleatória para determinação da MVA, sendo utilizado em um deles o equipamento para análises de gases e no outro não. A velocidade pico em esteira foi determinada com base no ajuste de KUIPERS et al.17. Foram também
analisadas variáveis fi siológicas (FC e %FCmax) e perceptuais (PSE) a cada estágio para comparação entre os protocolos. Os corredores realizaram uma performance de 10 e 15 km em pista de atletismo para verifi car a relação com a máxima velocidade aeróbia obtida nos dois testes. O uso da máscara para a análise de gases reduziu a Vpico, mas não modifi cou a FCmax e a PSEmax. Em relação às variáveis submáximas, a FC foi
infl uenciada principalmente nos estágios iniciais em que os valores foram maiores no teste em que a análise de gases foi feita. Porém, quando expressa em %FCmax, os atletas permaneceram na maioria dos estágios submáximos em percentuais maiores durante o protocolo com o uso da máscara. Para a PSE, não houve diferenças signifi cativas, com exceção do estágio a 10 km·h-1, em que a PSE foi maior quando se utilizou a máscara. A Vpico é reduzida devido à utilização da máscara para análise de gases e a FC e o %FCmax em estágios submáximos são maiores devido ao uso desse equipamento, especialmente nos estágios iniciais.
14. Tanaka H, Monahan KD, Seals DR. Age-predicted maximal heart rate revisited. J Am Coll Cardiol. 2001;37:153-6. 15. Tremayne P, Barry RJ. Elite pistol shooters: physiological patterning of best vs. worst shots. Int J Psychophysiol.
2001;41:19-29.
16. Borg GA. Psychophysical bases of perceived exertion. Med Sci Sports Exerc. 1982;14:377-81.
17. Kuipers H, Verstappen FT, Keizer HA, Geurten P, van Kranenburg G. Variability of aerobic performance in the labo-ratory and its physiological correlates. Int J Sports Med. 1985;6:197-201.
18. Bosquet L, Gamelin FX, Berthoin S. Reliability of postexercise heart rate recovery. Int J Sports Med. 2008;29:238-43. 19. Harling SA, Tong RJ, Mickleborugh TD. Th e oxygen uptake response running to exhaustion at peak treadmill speed.
Med Sci Sports Exerc. 2003;35:663-8.
20. Coen B, Urhausen A, Kindermann W. Individual anaerobic threshold: methodological aspects of its assessment in running. Int J Sports Med. 2001;22:8-16.
21. European Society of Cardiology. North American Society of Pacing and Electrophysiology. Heart rate variability: standards measurement, physiological interpretation and clinical use. Task Force of the European Society of Cardiology and the North American Society of Pacing and Electrophysiology. Circulation. 1996;93:104-6.
22. Marcora S. Perception of eff ort during exercise is independent of aff erent feedback from skeletal muscles, heart, and lungs. J Appl Physiol. 2009;106:2060-2.
23. Smirmaul BPC. Sense of eff ort and other unpleasant sensations during exercise: clarifying concepts and mechanisms. Br J Sports Med. 2012;46:308-11.
24. Strupler M, Mueller G, Perret C. Heart rate-based lactate minimum test: a reproducible method. Br J Sports Med. 2009;43:432-6.
25. Grant S, McMillan K, Newell J, et al. Reproducibility of the blood lactate threshold, 4 mmol.l marker, heart rate and ratings of perceived exertion during incremental treadmill exercise in humans. Eur J Appl Physiol. 2002;87:159-66. 26. Heitkamp H, Holdt M, Sceib K. Th e reproducibility of a 4 mmol.L-1 lactate threshold in trained and untrained
women. Int J Sports Med. 1991;12:363-8.
27. Roff ey DM, Byrne NM, Hills AP. Eff ect of stage duration on physiological variables commonly used to determine
maximum aerobic performance during cycle ergometry. J Sports Sci. 2007;25:1325-35.
28. Lamb KL, Eston RG, Corns D. Reliability of ratings of perceived exertion during progressive treadmill exercise. Br J Sports Med. 1999;33:336-9.
29. Machado FA, Kravchychyn AC, Peserico CS, da Silva DF, Mezzaroba PV. Incremental test design, peak ‘aerobic’ running speed and endurance performance in runners. J Sci Med Sport. 2013;16:577-82.
30. Beneke R, Leithäuser RM, Ochentel O. Blood lactate diagnostics in exercise testing and training. Int J Sports Physiol Perform. 2011;6:8-24.
ADDRESS Danilo Fernandes da Silva Departamento de Educação Física Universidade Estadual de Maringá Av. Colombo, 5700 - Bloco M 06 - sala 6 87020-900 - Maringá - PR - BRASIL e-mail: [email protected]
Submitted: 03/15/2014 Accepted: 06/09/2015