Quim. Nova, Vol. 36, No. 9, 1430-1433, 2013
N
o
ta
T
é
c
ni
c
a
*e-mail: [email protected]
SIMULTANEOUS ANALYSIS OF SATURATED AND UNSATURATED FATTY ACIDS PRESENT IN PEQUI FRUITS BY CAPILLARY ELECTROPHORESIS
Patrícia M. de Castro Barraand Marcone A. L. de Oliveira*
Departamento de Química, Universidade Federal de Juiz de Fora, Cidade Universitária, 36036-330 Juiz de Fora – MG, Brasil Bárbara Nery-Enes, Leandro de M. Cardoso, Cristiane do C. Cesário, Ana V. B. Moreira, Helena M. Pinheiro-Sant’Ana and Maria do C. G. Peluzio
Departamento de Nutrição e Saúde, Universidade Federal de Viçosa, Avenida PH Rolfs, 36571-000 Viçosa – MG, Brasil
Recebido em 26/3/13; aceito em 29/5/13; publicado na web em 2/8/13
In the current study, an alternative method has been proposed for simultaneous analysis of palmitic, stearic, oleic, linoleic, and linolenic acids by capillary zone electrophoresis (CZE) using indirect detection.The background electrolyte (BGE) used for the analysis of these fatty acids (FAs) consisted of 15.0 mmol L−1 NaH
2PO4/Na2HPO4 at pH 6.86, 4.0 mmol L
−1 SDBS, 8.3 mmol L−1 Brij 35, 45% v/v acetonitrile (can), and 2.1% n-octanol. The FAs quantiication of FAs was performed using a response factor approach, which provided a high analytical throughput for the real sample. The CZE method, which was applied successfully for the analysis of pequi pulp, has advantages such as short analysis time, absence of lipid fraction extraction and derivatization steps, and no signiicant difference in the 95% conidence intervals for FA quantiication results, compared to the gas chromatography oficial method (AOCS Ce 1h-05).
Keywords: pequi fruit; gas chromatography; capillary zone electrophoresis.
INTRODUCTION
Brazil is the most diverse country in the planet in terms of its vegetation types, and interest for its native fruits is increasing worl-dwide. Its large geographic area has a great variety of vegetation; several of its fruits have not yet been studied well. The Cerrado biome is an important Brazilian vegetation area, covering about 21% of the country’s land territory, and harbors a great diversity of fauna and lora.1 Pequi tree is one of the typical species found in Brazilian
Cerrado and its fruit, the pequi (Caryocar brasiliense Camb.), is one of the most commercialized fruits of this biome. It has many applications in food, medicine, and cosmetic industries because of its high contents of carotenoids, and oleic and palmitic fatty acids (FAs).2 Pequi pulp has a high lipid content, and the fruit also is an
important source of micronutrients essential to human health, such as carotenoids, which have antioxidant and provitamin A activities. However, there is little information about its oil composition and content of vitamins, in particular vitamin E.3
Composition of the FAs present in pequi oil varies according to the region of their production, climate condition, and time of harvest.1 Regardless of this variation, oleic acid ( -9) is the major
component of the oil, followed by palmitic acid.1,3 Pequi oil is used
as an ingredient in preparation of food; substituting other oils such as soya and dendê oils with pequi oil will account for 50.9% and 22.6% of the recommended daily amount for children and adults, respectively (considering consumption of 9 g of oil, as recommended by the Food Pyramid).4 Therefore, determination of FAs is important
for chemical characterization of edible oils and fats and for quality control of several products.
The most common procedures used to measure FA concentration involve the following steps: irst, extraction of lipids from a sample, generally based on the Folch or modiied Folch method; second, iso-lation of FAs from the rest of the lipids by thin-layer chromatography (TLC) and/or solid-phase extraction (SPE); next, derivatization of
FAs to fatty acid methyl esters (FAMEs); and inally quantiication of FAMEs by gas chromatography (GC).5 Chromatographic
deter-mination of FAMEs and their separation into individual components are mostly performed using capillary GC5 and, less frequently, using
high-performance liquid chromatography (HPLC).6
In the past decade, capillary electrophoresis (CE) has been used as a rapid, alternative technique for the analysis of FAs present in oils and fats because of the following advantages: easy sample preparation (no derivatization or methylation steps) and the use of nonspeciic columns, simple background electrolytes (BGEs), and a small volu-me of reagents that can be purchased easily and are of low cost.7–14
The analysis by CE is performed in a counter-electro-osmotic mode (electrophoretic and electro-osmotic mobilities in opposite directions) using alkaline buffers (the species are analyzed as anions), where FAs with longer chains elute irst and are detected by indirect UV measurement.10 However, based on the current analytical scenario,
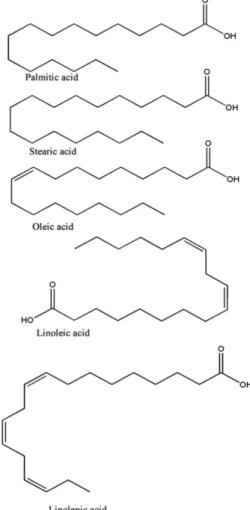
there is considerable room for improvement in FA separation by CE. In this context, a rapid and eficient method for the analysis of usual saturated and unsaturated long-chain FAs (such as stearic (C18:0), oleic (C18:1 9c), palmitic (C16:0), linoleic (C18:2cc), and linolenic (C18:3) acids) under indirect UV detection using CE, without carrying out the derivatization and lipid fraction extraction steps, has been proposed and compared with the corresponding GC oficial method. Figure 1 shows the structures of these FAs.
EXPERIMENTAL
Chemicals and materials
Simultaneous analysis of saturated and unsaturated fatty acids 1431
Vol. 36, No. 9
benzene sulfonate (SDBS) were purchased from Sigma-Aldrich (St. Louis, MO, USA), and KOH, H2SO4, NaOH, NH4Cl, and HCl from
Merck (Rio de Janeiro, Brazil).
Standard FAs (C13:0, C15:0, C16:0, C18:0, C18:1 9c, C18:1 9t, C18:2cc, and C18:3ccc) were purchased from Sigma-Aldrich (St. Louis, MO, USA). Individual FA stock solutions at a concentration of 20.0 mmol L−1 were prepared by dissolving appropriate amounts of the
above-mentioned standard FAs in MeOH; they were stored in a freezer until analysis. A mixture of all the standard FAs was prepared at a concentration of 0.5 mmol L−1 by appropriate dilutions with MeOH.
A mixture of FAME standards containing 37 FAMEs having between 4 and 24 carbon atoms (Supelco Inc., Bellefonte, PA, USA), with certiicated quantities of each compound; a mixture of cis/trans FAME isomers of 18:2 (cc, ct, tc, tt) and 18:3 (ccc, cct, ctt, tcc, ttc, tct, ctc, ttt) (Sigma Chemical Co, St Louis, MO, USA); individual FAME standards of about 99% purity (Sigma Chemical Co, St Louis, MO, USA): elaidic (18:1 9t), 18:1 7c, 18:1 12c, and conjugated linoleic (18:2 9c11t and 18:2 10t12c) acids; and an internal standard (IS) C13:0 were used for the experiment.
An aqueous Brij 35 stock solution (50.0 mmol L−1 concentration)
was prepared by weighing an appropriate amount of the reagent and dissolving it in a 100.0 mL volumetric lask. For preparing a sodium hydroxide (NaOH) solution of 0.5 mol L−1 concentration, corresponding
amount was weighed and dissolved in a 100.0 mL volumetric lask and the volume was made up with MeOH. An aqueous SDBS stock solution was prepared by weighing an amount corresponding to a concentration of 100.0 mmol L−1and dissolving it in a 100.0 mL volumetric lask.
Aqueous buffer stock solutions at concentrations of 100.0 mmol L−1 were prepared using appropriate amounts of monobasic sodium
phosphate (NaH2PO4); in addition, solutions of dibasic sodium
phos-phate (Na2HPO4) at a concentration of 50.0 mmol L
−1 were prepared
by weighing the corresponding amount and dissolving in a 250.0 mL volumetric lask. Phosphate buffers and the Brij 35 stock solutions were kept in a freezer to prevent mold formation. Fresh working electrolyte solutions were prepared by appropriate dilutions of stocks through incorporation of solvents.
Pequi fruits were purchased from the local market of Belo Horizonte city, Minas Gerais, Brazil.
Instrumentation
CE system
Separation optimization experiments were conducted using a CE system (HP3d CE, Agilent Technologies, Palo Alto, CA, USA) equi-pped with a diode-array detector (with indirect detection), a temperature control device (set at 25 °C), and a data acquisition and treatment software (HP ChemStation, rev A.06.01). Samples were injected hydrodynamically (12.5 mbar for 5 s) and the electrophoretic system was operated under normal polarity and constant voltage (+19 kV); manual integration was performed by adjusting peaks and baselines. For all the experiments, a fused-silica capillary tube with luoropolymer (TSH) external coating (Polymicro Technologies, Phoenix, AZ, USA) was used; the tube was 48.5 cm long (40 cm effective length), with an inner (id) and an outer (od) diameter of 75 and 375 μm, respectively. Gas chromatography
FAMEs, prepared according to the Hartman and Lago15 procedure,
were analyzed by GC on a Shimadzu gas chromatograph (GC17A model), equipped with a lame ionization detector (FID), using a fused-silica capillary column with a cyano propyl polysiloxane sta-tionary phase (CP 7420, 100 m, 0.25 mm, 0.25 μm; Varian, USA). The analysis was carried out under the chromatographic conditions established by the AOCS oficial method Ce 1h-05:16 an isothermal
column temperature of 180 ºC, injector and detector temperature of 250 ºC, use of hydrogen as the carrier gas, and column pressure of 170 kPa. The compounds were identiied by comparison of their retention times with FAME 13:0 (IS). Appropriate response factors were employed to convert the area percentage of FAME into true weight percentage. FAs were determined by adding FAME 13:0 as an IS (Sigma Aldrich®) and expressed as g/100 g of the sample. The precision of the method was evaluated by relative standard deviation (%RSD) (two genuine replicates).
Sample preparation
Capillary electrophoresis
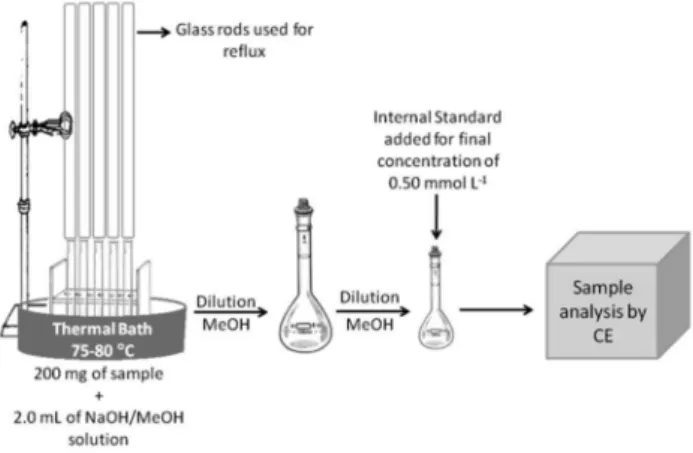
Approximately 200 mg pequi fruits were ground, homogenized, and then saponiied in 2.0 mL of methanolic NaOH solution (0.5 mol L−1) in a hot water bath (75–80 °C) for 25 min. Saponiication contents
were then diluted in a 10.0 mL volumetric lask. Before CE injection, samples were diluted in MeOH (1:10v/v). The mass of any solid resi-due remaining in the saponiication lask was weighed before the inal calculation and was subtracted from the original mass. Analyses were performed in duplicate; the saponiication scheme is shown in Figure 2. Official method by GC
Lipid fraction of pequi fruits was extracted by the Folch method;17
next, the extracted sample was saponiied in 2.0 mL of methanolic NaOH solution (0.5 mol L−1) at 75–80 °C for 25 min in a hot aqueous
bath, followed by methylation according to the method of Hartman and Lago.15 All the samples were ground and homogenized before
the preparation steps, and they were analyzed in genuine duplicate.
Barra et al.
1432 Quim. Nova
Statistical analysis
The analyses were performed in duplicate. Data were expressed as mean ± standard deviation. For comparison among means obtained by different methods, normality test was performed and the paired t test was conducted; no signiicant difference was observed in the 95% conidence levels (p > 0.05) between GC and CE methods. Pearson correlation was used to test the correlation between GC and CE methods used for the characterization of lipid proile.18
Analytical procedures
Prior to use, new capillaries were conditioned by pressure lushing with 1.0 mol L−1 NaOH (30 min), deionized water (5 min),
and electrolyte solution (10 min). In between runs, capillaries were regenerated by washing with 0.2 mol L−1 NaOH (2 min), deionized
water (2 min), and fresh electrolyte solution (3 min, pressure lush). This conditioning procedure was found to be critical for ensuring peak area and migration time repeatability, and for preventing the deleterious effect of solute adsorption onto the capillary wall. RESULTS AND DISCUSSION
The use of a BGE for FA analysis of pequi pulp was according to the method described in a previously published paper.19 Consequently,
the BGE consisted of 15.0 mmol L−1 NaH
2PO4/Na2HPO4 at pH 6.86,
4.0 mmol L−1 SDBS, 8.3 mmol L−1 Brij 35, 45% v/v can, and 2.1%
n-octanol.
On the other hand, FA quantiication of the real sample was based on a statistical study that involved response factor (Ri) calculation
using C13:0 as an IS. To calculate Rf, a random experiment was
per-formed in genuine replicates using C18:0, C18:1 9t, C18:1 9c, C16:0, C18:2cc, and C18:3ccc standard solutions at varying concentrations of 0.15, 0.30, 0.50, 0.70, 0.90, and 1.10 mmol L−1, and C13:0 at a
ixed concentration of 0.5 mmol L−1.19
The Ri was calculated just once for each standard FA in the
preliminary experiment (under controlled operational conditions), taking into account a rigorous statistical evaluation of the regression models by performing normality, homoscedasticity, and independence tests in residues and evaluation through the lack of it test (ANOVA) in data set. If these tests did not present signiicant evidence for the considered interval (in the present case, all values obtained in the statistical tests were considered to be within the 95% conidence interval), the slopes obtained could be used as the response factors for sample quantiication. On the other hand, if the analysis had been
performed using the same concentration of IS and same operational conditions (capillary dimensions, wavelength, cartridge temperature, etc.) as in the preliminary experiment, and there had been no violation of assumptions in the statistical tests (normality, homoscedasticity, independence, and lack of it), response factors would be calculated for each FA, instead of performing experiments to obtain their values.
The Ri values calculated for quantiication were 0.477, 0.555,
0.589, 0.626, and 0.818 for C18:0, C18:1c, C16:0, C18:2cc, and C18:3ccc, respectively.19 These R
i values were calculated using the
following mathematical expression:
(1)
where AFAi is the FA area, AC13:0 is the IS area, [FAi] is the FA
con-centration in mmol L−1, and [C13:0] is the IS concentration ixed at
0.5 mmol L−1. Subscript i represents the different FAs: C18:0, C18:1
9c, C16:0, C18:2cc, and C18:3ccc.
Since the regression model diagnosis was considered satisfactory, the slope could be used as Rf in equation (1), as long as the C13:0
was used at a concentration of 0.5 mmol L−1, while concentrations
of other FAs remaining unknown. Percentage for each FA (%FAi)
in the samples was calculated using equation (2), obtained after rearranging equation (1):
(2)
where AFA is the area of each FA, AC13:0 is IS area, %FA is the
per-centage of each FA, [C13:0] is the IS concentration that is ixed at 0.5 mmol L−1, V is the volume in liters, m is the sample mass in
milligrams, Rf is the response factor (itted model slope), and MWFA
is the molecular weight of each FA.
Figure 3 shows the electropherograms obtained from the analysis of the standards and pequi samples. The BGE contained 15.0 mmol L−1 NaH
2PO4/Na2HPO4 at pH 6.86, 4.0 mmol L
−1 SDBS, 8.3 mmol
L−1 Brij 35, 45% v/v can, and 2.1% n-octanol. It is noteworthy that
indirect UV detection was applied for FA analysis and peak integra-tion was observed at a wavelength of 224 nm.
Comparison between CE and GC methods
To check the reliability of the CE method used for FA analysis, the pequi fruit samples were analyzed in genuine duplicate and the
Figure 2. Preparation of pequi sample using CE method
Figure 3. (A) Standard FA electropherograms of (1) C18:0, (2) C18:1 9t, (3) C18:1 9c, (4) C16:0, (5) C18:2, (6) C18:3, and (7) C13:0 (IS), all at a con-centration of 0.50 mmol L−1. (B) Pequi sample electropherogram. Operational conditions: injection for 4 s at 12.5 mbar, +19 kV applied voltage, and 25°C cartridge temperature, and indirect detection at 224 nm. Electrolyte: 15.0 mmol L−1 NaH
2PO4/Na2HPO4 at pH 6.86, 4.0 mmol L
−1 SDBS, 8.3 mmol L−1
Simultaneous analysis of saturated and unsaturated fatty acids 1433
Vol. 36, No. 9
results were compared with the AOCS oficial GC method Ce 1h-05.16
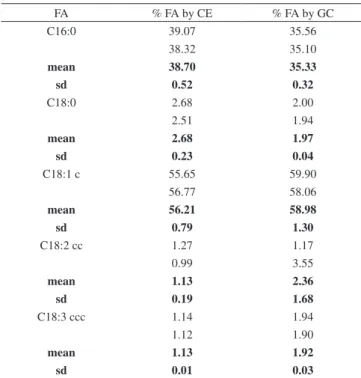
Table 1 shows the statistical results obtained during genuine duplicate analyses, expressed in mean values (Shapiro–Wilk normality test and paired sample t test) for CE and GC. For normality test, no signii-cant difference was found for the 95% conidence interval because p-values were found to be higher than 0.05 (p = 0.905). According to the paired sample t test, no signiicant difference was observed in the 95% conidence interval (p = 0.989) between the two methodologies, and Pearson correlation coeficient was equal to 0.956.
The results are satisfactory, indicating that the CE method can be used successfully for the determination of FA levels in this sample, without carrying out the steps of derivatization and lipid fraction extraction used in the classical method.
A scheme comparing the attractive CE method and the AOCS oficial GC method Ce 1h-05, in terms of analysis time, amount of chemical reagents necessary, and analytical throughput, is shown in Figure 4.
CONCLUSION
Pequi fruits have a high content of unsaturated FAs, with oleic acid being the major component, followed by palmitic acid. No statistical difference was observed in the 95% conidence intervals between capillary zone electrophoresis (CZE) and GC oficial method for FA analysis. Besides, the optimized CE method presents certain advan-tages, including short running time, response factor approach for FA quantiication, simple steps for sample preparation (that is, absence of methylation reaction), reduction in costs with the use of organic rea-gents, and short total analysis time (higher throughput), in comparison with the classical GC oficial method. The CZE method reported in the present work is simple, easy, “ecofriendly,” and it as an attractive method for application in screening or quality control of food products. ACKNOWLEDGMENTS
The authors wish to thank the Conselho Nacional de Desenvolvimento Cientíico e Tecnológico (CNPq – 475055/2011-0 and 3475055/2011-01689/2475055/2011-011-3), Fundação de Amparo à Pesquisa do Estado de Minas Gerais of Brazil (FAPEMIG-CEX APQ 02420-11 and CEX-PPM 00205-11), and Coordenação de Aperfeiçoamento de Pessoal de Nível Superior (CAPES) for fellowships and inancial support. REFERENCES
1. Oliveira, M. N. S. D.; Gusmão, E.; Lopes, P. S. N.; Simões, M. O. M.; Ribeiro, L. M.; Dias, B. A. S.; Revista Brasileira de Fruticultura2006,
28, 380.
2. Silva, E. C.; Soares, I. C.; Helou, J. H.; Cosmet. Toiletries1993, 5, 31. 3. Lima, A. D.; Silva, A. M. D. O. E.; Trindade, R. A.; Torres, R. P.;
Mancini-Filho, J.; Revista Brasileira de Fruticultura2007, 29, 695. 4. IOM. Dietary reference intakes. Proposed deinition of dietary iber,
National Academies Press, 2001.
5. Delmonte, P.; Rader, J. I.; Anal. Bioanal. Chem. 2007, 389, 77. 6. Delmonte, P.; Yurawecz, M. P.; Mossoba, M. M.; Cruz-Hernandez, C.;
Kramer, J. K. G.; J. AOAC Int. 2004, 87, 563.
7. Oliveira, M. A. L.; Solis, V. S.; Gioelli, L. A.; Polakiewicz, B.; Tavares, M. F. M.; Electrophoresis2003, 24, 1641.
8. Otieno, A. C.; Mwongela, S. M.; Anal. Chim. Acta2008, 624, 163. 9. Barra, P. M. C.; Barra, M. M.; Azevedo, M. S.; Fett, R.; Micke, G. A.;
Costa, A. C. O.; Oliveira, M. A. L.; Food Control2012, 23, 456. 10. Castro, P. M.; Barra, M. M.; Ribeiro, M. C. C.; Aued-Pimentel, S.; Silva,
S. A.; Oliveira, M. A. L.; J. Agric. Food Chem.2010, 58, 1403. 11. Oliveira, M. A. L.; Lago, C. L. ; Tavares, M. F. M.; Silva J. A. F. Quim.
Nova 2003, 26, 821.
12. Balesteros, M.R.; Faria, A.F.; Oliveira, M.A.L. ; J. Braz. Chem. Soc. 2007, 18, 554.
13. Porto, B.S.L.; Souza, M.V.N.; Oliveira, M.A.L.; Anal. Sci. 2011, 27,
541.
14. Castro, R.J.C.; Sobrinho, F.S.; Gama, M.A.S.; Barra, P.M.C.; Antoniassi, R.; Oliveira, M.A.L.; Cent. Eur. J. Chem. 2013, 11, 286.
15. Hartman, L.; Lago, R. A. C.; Laboratory Practice1973, 22, 475. 16. AOCS, Oficial Methods And Recommended Practices of the AOCS.
Additions and revisions 1999-2006. Method Ce 1h-05, Champaign (IL)
2006.
17. Folch, J.; Lees, M.; Sloane-Stanley, G. H.; J. Biol. Chem.1957, 226, 497.
18. Massart, D. L.; Vandeginste, B. G. M.; Buydens, L. M. C.; De Jong, S.; Lewi, P. J.; Smeyers-Verbeke, J; Handbook of chemometrics and qualimetrics: part A, Elsevier: New York, 1997.
19. Barra, P. M. C.; Castro, R. J. C.; Oliveira, P. L.; Aued-Pimentel, S.; Silva, S. A.; Oliveira, M. A. L.; Food Res. Int.2013, 52, 33.
Table 1. Fatty acids analysis statistical results for CE and GC methods
FA % FA by CE % FA by GC
C16:0 39.07 35.56
38.32 35.10
mean 38.70 35.33
sd 0.52 0.32
C18:0 2.68 2.00
2.51 1.94
mean 2.68 1.97
sd 0.23 0.04
C18:1 c 55.65 59.90
56.77 58.06
mean 56.21 58.98
sd 0.79 1.30
C18:2 cc 1.27 1.17
0.99 3.55
mean 1.13 2.36
sd 0.19 1.68
C18:3 ccc 1.14 1.94
1.12 1.90
mean 1.13 1.92
sd 0.01 0.03
Normality test: p-value; 0.905; Paired test: p-value: 0.372; Pearson correla-tion: 0.996.