Article
J. Braz. Chem. Soc., Vol. 24, No. 1, 85-91, 2013. Printed in Brazil - ©2013 Sociedade Brasileira de Química 0103 - 5053 $6.00+0.00
A
*e-mail: [email protected]
HPLC/DAD Determination of Rosmarinic Acid in
Salvia officinalis
:
Sample Preparation Optimization by Factorial Design
Karina B. de Oliveiraa and Brás H. de Oliveira*,b
aUniversidade Federal do Paraná, Departamento de Farmácia, Av. Pref. Lothário Meissner, 632, 80210-170 Curitiba-PR, Brazil
bUniversidade Federal do Paraná, Departamento de Química, CP19081, 81531-990 Curitiba-PR, Brazil
A sálvia (Salvia officinalis) contém altos teores de ácido rosmarínico (RA), uma substância bioativa, bem como outros polifenóis. RA é facilmente oxidável e pode sofrer degradação durante a preparação da amostra para análise. O objetivo deste trabalho foi desenvolver e validar um método analítico para a determinação do RA em sálvia, usando planejamento fatorial para a otimização da preparação de amostras. Inicialmente foram determinadas as variáveis estatisticamente significativas para melhorar o rendimento da extração do RA, as quais foram depois otimizadas usando planejamento composto central (CCD). O método analítico foi validado e aplicado na análise de amostras comerciais de sálvia. O procedimento otimizado consistiu na extração com metanol aquoso (40%) contendo uma mistura antioxidante (ácido ascórbico e ácido etileno diamino tetracético (EDTA)), com sonicação a 45 oC por 20 min. As
amostras foram injetadas em um sistema contendo coluna C18, usando metanol (A) e ácido
fosfórico aquoso 0.1% (B) em gradiente (45A:55B, 0-5 min; 80A:20B, 5-10 min) com fluxo de 1.0 mL min−1 e deteção em 330 nm. Utilizando estas condições, as concentrações do RA foram
50% maiores quando comparadas com extração na ausência de antioxidante (recuperação de 98,94 ± 1,07%). Auto-oxidação do RA durante a preparação da amostra foi evitada pelo uso de antioxidante levando a resultados analíticos mais confiáveis. O método foi então aplicado na análise de amostras comerciais de sálvia.
Sage (Salvia officinalis) contains high amounts of the biologically active rosmarinic acid (RA) and other polyphenolic compounds. RA is easily oxidized, and may undergo degradation during sample preparation for analysis. The objective of this work was to develop and validate an analytical procedure for determination of RA in sage, using factorial design of experiments for optimizing sample preparation. The statistically significant variables for improving RA extraction yield were determined initially and then used in the optimization step, using central composite design (CCD). The analytical method was then fully validated, and used for the analysis of commercial samples of sage. The optimized procedure involved extraction with aqueous methanol (40%) containing an antioxidant mixture (ascorbic acid and ethylenediaminetetraacetic acid (EDTA)), with sonication at 45 oC for 20 min. The samples were then injected in a system
containing a C18 column, using methanol (A) and 0.1% phosphoric acid in water (B) in step gradient
mode (45A:55B, 0-5 min; 80A:20B, 5-10 min) with flow rate of 1.0 mL min−1 and detection at
330 nm. Using this conditions, RA concentrations were 50% higher when compared to extractions without antioxidants (98.94 ± 1.07% recovery). Auto-oxidation of RA during sample extraction was prevented by the use of antioxidants resulting in more reliable analytical results. The method was then used for the analysis of commercial samples of sage.
Introduction
Salvia officinalis L. (sage) is an aromatic plant widely used for food flavoring. Many of its pharmacological properties have been associated with polyphenolic antioxidants.1 One of them, rosmarinic acid (RA, Figure 1), has also been found in other plants.2 Important biological activities such as neuroprotective,3 antioxidant,4 anti-inflammatory,5 immunomodulatory,6 photoprotection,7 and melanogenic8 have been attributed to RA. These bioactivities have prompted the development of analytical methods for the determination of RA in plant materials.
The analysis of RA in sage and other species by high performance liquid chromatography (HPLC) has been reported in a number of occasions.9-13 A study of RA variation in sage collection describes sample preparation by solid-liquid extraction using 50% aqueous methanol with sonication, followed by analysis using a C18 column and elution with mixtures of acetic acid, water, methanol and acetonitrile.14 However, no special attention has been given to the evaluation and prevention of possible RA auto-oxidation during the extraction procedure. The effects of variables such as solvent, temperature and time, on extraction yield are usually studied one at a time. This traditional monovariate experimental design approach is time consuming and may not lead to optimum conditions. Procedures that are more efficient are available for this purpose.
The optimization of many processes can be achieved using statistical factorial design of experiments.15 The technique is characterized by the simultaneous evaluation of multiple variables (factors) potentially significant for a given response in a process under study. The optimization can be accomplished more quickly and interactions among variables may be detected. The optimization of chromatographic separation and sample preparation have benefited from this technique.16
Considering the importance of RA and its high content in S. officinalis, our group decided to develop and validate an analytical HPLC/DAD (diode array detection) procedure for its determination in the plant. Special attention was given to sample preparation by solvent extraction presuming its possible degradation by auto-oxidation. The
sample extraction was optimized using factorial design of experiments and the method was then used for the analysis of commercial samples of sage.
Experimental
Instrumentation and analytical conditions
1H and 13C nuclear magnetic resonance (NMR) spectra
were acquired on a Bruker Avance 200 spectrometer using tetramethylsilane (TMS) as an internal standard. A Varian HP 920 series HPLC system with quaternary pump, autosampler, thermostatted column compartment and photodiode array detector (PDA) was used for analysis. Rosmarinic acid was quantified by HPLC as described previously with some modifications.10 The chromatographic analysis was performed with C18 column (Agilent Eclipse C18, 150 mm × 4.6 mm × 5 µm) at 25 °C, using methanol (eluent A) and 0.1% phosphoric acid in water (eluent B) in step gradient mode (45:55, 0-5 min; 80:20, 5-10 min). The flow rate was 1.0 mL min−1 and detection at 330 nm. The concentration of rosmarinic acid was determined using external standard calibration. Analytical curves were constructed with five solutions of standard RA (6.25-100 µg mL−1) injected at 0, 7, 15 and 30 day intervals. Sample solutions were prepared using the optimized extraction procedure and analyzed at 0, 3 and 7 day intervals. In both cases, between injections, the solutions were stored in the dark at 6 oC. The data were then statistically analyzed.
Plant material and rosmarinic acid isolation
Sage leaves were purchased in a local market and identified by macro and microscopic analysis.17 Isolation of RA was carried out from hydroalcoholic extract (10 g) which was dissolved in water (300 mL) at 80 °C. After cooling, the solution was filtered, acidified to pH 2-2.5 with 25% HCl and centrifuged. The supernatant was then extracted with diethyl ether (5 × 100 mL). The organic fractions were combined and the solvent evaporated. Portions of the extract were then fractionated in a Chromatotron (centrifugal thin-layer chromatograph) (Harrison Research Chromatotron model 7924) using silica gel rotors (Aldrich, 346446) and the elution was made with ethyl acetate/hexane/acetic acid (30:60:10). Fractions containing RA were combined, the solvent evaporated and the residue stored under nitrogen, in the dark. The isolated compound was characterized by spectroscopic methods (UV, 1H and 13C NMR) and its purity was also determined by HPLC/DAD.
Optimization of sample preparation
The screening of statistically significant factors for RA extraction was made with a 24 factorial design with duplicates (32 experiments). The four factors and their respective levels are shown in Table 1. Dried powdered plant material was sieved (310-740 µm), weighed (100 mg) and extracted with sonication with appropriate solvent (10 mL). The experiments with antioxidant were carried out with extracting solutions containing ascorbic acid (1 mg mL−1) and EDTA (ethylenediaminetetraacetic acid, 0.3 mg mL−1).
The extraction optimization was carried out using two consecutive central composite design (CCD) and all experiments were carried out with added antioxidant. In the first CCD, the significant parameters determined in the screening step (solvent, time and temperature) were used. The factors and their respective levels are summarized in Table 2. In the second CCD, the temperature was fixed at 45 oC and solvent and time were varied (Table 3). Solutions were filtered, diluted in 50% methanol (1:10) and injected into the chromatographic system. The data were then statistically analyzed and plotted.
Final optimized extraction method
Dried powdered (310-740 µm) plant material was weighed (100 mg) and extracted with sonication with 40% methanol in water (10 mL), containing ascorbic acid (1 mg mL−1) and EDTA (0.3 mg mL−1), at 45 oC for 20 min. Samples were then filtered, diluted (1:10) with 50% methanol in water, and analyzed.
Stability of standard and samples solutions
Analytical curves were constructed with five solutions of standard RA (6.25-100 µg mL−1) injected at 0, 7, 15 and 30 day intervals. Sample solutions were prepared using the optimized extraction procedure and analyzed at 0, 3 and 7 day intervals. In both cases, between injections, the solutions were stored in the dark at 6 oC. The data were then statistically analyzed.
Selectivity
Selectivity was evaluated by the peak purity function of the chromatography software and by direct inspection of the UV spectra at upslope, apex and downslope portions of the peak of RA in HPLC-PDA chromatograms.
Linearity
Linearity was determined for standard and sample solutions. RA solutions (6.25-100 µg mL−1) were prepared and injected in 3 consecutive days into the HPLC system. Plant material (80, 90, 100, 110 and 120 mg) was extracted as described above and analyzed. The solutions were stored in the dark at 6 oC. Data were then statistically evaluated for correlation coefficient (r), coefficient of determination (R2) and residuals of regression analysis.
Accuracy
The RA concentration was determined using an integrated calibration method.18 Standard addition calibration curve was made with plant material (100 mg) spiked with 0, 100, 200, 300 and 400 µL of RA solution (10 mg mL−1). After extraction as described above, the samples, with final concentrations increased by 0, 10, 20 30 and 40 µg mL−1, were analyzed. The data were plotted in the same regular calibration graph prepared as described in the previous section. The concentration of RA was determined by extrapolating the value of the linear coefficient of the equation for spiked sample solutions into that of the standard equation. Extract samples with 80, 100 and 120% of theoretical values were then prepared in triplicate, under the same conditions used for linearity tests. The samples were then analyzed and recovery calculated.
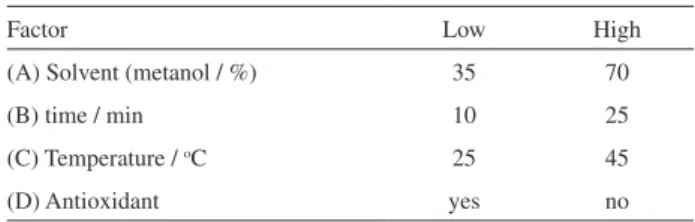
Table 1. Factors and respective low and high values used for screening of significant variables for extraction of rosmarinic acid from S. officinalis
Factor Low High
(A) Solvent (metanol / %) 35 70
(B) time / min 10 25
(C) Temperature / oC 25 45
(D) Antioxidant yes no
Table 2. Central composite design factors and respective values used for optimization of extraction of rosmarinic acid from S. officinalis. (n = 5 at center point; α = 1.68179)
Factor Experimental domain
a
−α −1 0 1 α
Solvent (metanol / %) 39.8 50 65 80 90.2
time / min 16.6 20 25 30 33.4
Temperature / oC 29.9 35 42.5 50 55.1
aDesign points: center (0), cubic (−1, 1), axial (−α, α).
Table 3. Central composite design factors and respective values used for optimization of extraction of rosmarinic acid from S. officinalis. (n = 5 at center point; α = 1.68179)
Factor Experimental domain
a
−α −1 0 1 α
Solvent (metanol / %) 15.9 20 30 40 44.1
time / min 17.9 20 25 30 32.1
Precision
Within-day precision (repeatability) was evaluated by repeated analyses of plant material (n = 6), and between-day precision (reproducibility) was evaluated by two analysts in two consecutive days (n = 6). The concentration of RA was determined and the relative standard deviation (RSD) calculated and compared.
Limits of detection and quantitation
The limits of detection and quantitation (LOD and LOQ, respectively) were calculated according to the equations LOD = 3.3δ/S, LOQ = 10δ/S, where δ is the standard
deviation of responses and S is the slope of the analytical curve.19 Appropriate dilutions were then prepared and analyzed in order to confirm those limits.
Statistical analysis
Student’s t-test or analyses of variance (ANOVA), followed by Tukey test where necessary, were carried out using Graph Pad-Prism 5 software. Data were expressed as the mean ± standard deviation (SD).
Results and Discussion
Rosmarinic acid isolation and characterization
The chromatographic procedure used for RA isolation was efficient producing 450-550 mg per 10 g of dry hydroethanolic extract. The product was characterized by spectrometric methods and its 1H and 13C NMR spectra were compared with literature data.20,21 Using HPLC/DAD analysis the purity of RA was determined as 97.25%.
HPLC analysis optimization
The analysis of RA in plant materials has been described in a number of ocasions. The procedures usually involve the use of C18 columns.
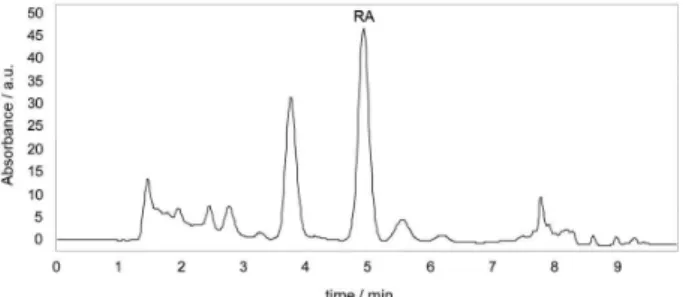
10 Initial attempts using Reselut
column (Varian, 150 mm × 4.6 mm × 5 µm) were unable to provide a base-line separation. Another C18 column (Eclipse (Agilent)) with the same dimensions provided a sucessful separation of RA (Figure 2) This column was, therefore, used for method development. Mobile phase was methanol (eluent A) and 0.1% phosphoric acid in water (eluent B) in step gradient mode (45:55, 0-5 min; 80:20, 5-10 min).
Optimization of sample preparation
The sample preparation for polyphenolic analytes may require special attention due to the possible oxidation of these compounds. Solid-liquid extractions involving
heating and/or sonication may further increase the possibility of degradation. The study of the effect of these and other variables on extraction efficiency, one at a time, is more time consuming and may not provide adequate results because some variables may interact with each other. These interactions are not easily detected unless statistical designs of experiments are used. Statistical multivariate design of experiments usually involves an initial screening step in order to identify statistically significant factors followed by an optimization step using a surface response method.16 All factors are evaluated simultaneously and possible interactions among are detected. This two-step methodology was used for the optimization of sample preparation for RA analysis.
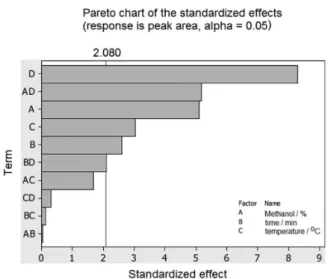
In the initial step, solvent (methanol, %), time, temperature and antioxidant (with or without) were selected for initial screening of the statistically significant variables (Table 1). In order to minimize RA degradation, an antioxidant mixture containing ascorbic acid and EDTA was also tested. The results showed that all factors significantly affected RA extraction (Figure 3). The influence of the antioxidant mixture was the most significant. When ascorbic acid and EDTA are present in the extraction mixture, there is a 50% increase in the RA content of the extract, indicating that oxidation of the analyte was taking place during extraction when they are not present.
the presence of antioxidant mixture, there was no difference in the extraction yield. When ascorbic acid and EDTA were not present in the extraction mixture, the yield was drastically reduced with smaller concentration of methanol. The third interaction was between time and antioxidant. When antioxidant was present in the extraction mixture, there was a very small difference in the yield with different extraction times. Without antioxidant, RA yields increase with time but to a smaller degree when compared with the increase in methanol concentration. All these interactions among variables would be difficult to detect by monovariate experimental designs.
The next step, the optimization of the variables for maximum extraction yield, was planned using CCD. Solvent, time and temperature were chosen since they were previously determined as statistically significant (Table 2). All experiments were carried out in the presence of antioxidants. Initial results showed that the highest extraction yields were obtained with temperatures above
40 oC, and methanol concentration in the range 40-50%. However, as the highest extraction yield results are located at the left side of the contour map (40% methanol), the optimum concentration of methanol could be below 40%. Another optimization step was, therefore, carried out this time keeping the temperature at 45 oC.
The results of the second optimization step (Figure 5) show that, in fact, extraction time could be reduced to less than 20 min as long as the methanol concentration was in the range 32.5-45%. The final method, therefore, consisted of extraction of plant material with 40% methanol in water, containing ascorbic acid and EDTA, at 45 oC for 20 min with sonication.
Method validation
After optimization of sample preparation, the analytical method was validated according to international22 and Brazilian23 guidelines. Selectivity was confirmed by the spectral purity of RA using the peak purity function of the PDA detector. The stability of RA, in standard solutions, was evaluated by comparison of five-point analytical curves obtained after storage of solutions in the dark and at 6 oC. The data for standard RA showed that the 4 curves obtained within 30 days were superimposable and linear (r ≥ 0.9997, slopes 0.5055 ± 0.0027, 0.5120 ± 0.0040, 0.5091 ± 0.0069 and 0.4998 ± 0.0047 at 0, 7, 15 and 30 days, respectively) indicating negligible RA degradation. Results for extract solutions showed that after 3 days, there was a small, but not significant decrease in RA concentration. After 7 days, however, the decrease was significant (6.5%). Therefore, sample extracts are stable for 3 days when stored as described. The results of other validation parameters are summarized in Table 4.
Figure 3. Pareto chart for the screening of parameters for extraction of RA from S. officinalis. Measured response was peak area.
Figure 4. Interaction effect plot for the screening of parameters for extraction of RA from S. officinalis. Response is peak area (y-axis).
Figure 5. Contour map for the optimization of factors for RA extraction from S. officinalis. Extractions were carried out at 45 oC in the presence
Linearity was evaluated for both standard RA and extract solutions. The analytical curve obtained from standard RA (6.25-100 µg mL−1) was linear and residual plots indicated random distribution (homoscedasticity)24 without bias or outliers. In order to detect possible matrix effects, calibration curves were also prepared with sample extracts with RA concentration in the 15.08-22.62 µg mL−1 range. Again, a good linearity was obtained showing insignificant interference from matrix components.
The evaluation of accuracy in plant material analysis is more difficult to accomplish because there is no sample matrix free from the analyte. In order to overcome this drawback, the RA concentration was determined using the integrated calibration method. This procedure involves the combination of the regular calibration plot with that prepared by the method of standard addition in which increased amounts of standard analyte is added to sample solutions (Figure 6).18 The RA concentration in the sample was determined by extrapolating the value of the linear coefficient of the equation for spiked sample solutions into that of the standard equation (dashed lines in Figure 6). After correction for dilution and sample size, the concentration of 18.85 mg g−1 was found. Accuracy was finally determined after analysis of sample solutions containing 80, 100 and 120% of theoretical RA values, in triplicate. The results are shown in Table 4.
The matrix effect could also be estimated from the slope ratio (SR) of both curves (Figure 6). It was calculated by
SR = S1/S2, where S1 and S2 are the slopes for the plots of spiked extract samples and standard RA, respectively. The result (0.96) indicated a very small influence of matrix effect.18
Commercial sample analysis
The optimized method was then used for the analysis of two commercial samples of sage. The results (5.07 ± 0.71 and 20.70 ± 0.29 mg g−1, n = 3) confirmed the precision of the method and showed the considerable variability in RA concentration in commercial sage samples. Table 4. Method validation data for rosmarinic acid determination in S. officinallis
Parameter Result
Linearity (standard) function y = 0.5053 x + 0.000834
r 0.9999
R2 0.9998
residuals (homoscedasticity) random distribution
range 6.25-100 µg mL−1
Linearity (extract) function y = 0.4640 x + 0.6512
r 0.9991
R2 0.9982
residuals (homoscedasticity) random distribution
range 15.08-22.62 µg mL−1
Precision intra day RSD < 3.25% (n = 6)
intermediate RSD < 4.05% (n = 12)
Accuracy recovery 80% theoretical concentration 101.39 ± 1.31% (n = 3)
recovery 100% theoretical concentration 98.94 ± 1.07% (n = 3)
recovery 120% theoretical concentration 98.50 ± 1.84% (n = 3)
Limit of detection (LOD) 0.005 µg mL−1
Limit of quantitation (LOQ) 0.017 µg mL−1
RSD: relative standard deviation; r: correlation coefficient; R2: coefficient of determination.
This variability, which depends on plant source and many other factors, justifies the need for determination of active components in medicinal plants.
Conclusions
Our results showed that the determination of rosmarinic acid from S. officinallis is severely affected by auto-oxidation of that analyte unless preventive measures are taken during extraction. Our results showed that the concentration of RA in extracts were 50% higher when antioxidants were added to extraction solvent. The protection of the analyte against degradation provides more accurate analytical results. The variability in RA contents found in commercial S. officinallis samples may result from many factors including seasonal and geographic influences.
Supplementary Information
The 1H NMR and 13C NMR spectra, HPLC/DAD chromatogram of RA (and corresponding UV spectrum), as well statistical plots (the main effects, contour plots of preliminary extraction optimization, residuals of linear regression, stability of calibration solutions) are available free of charge at http://jbcs.org.br as a PDF file.
Acknowledgments
T h e fi n a n c i a l s u p p o r t o f C o o r d e n a ç ã o d e Aperfeiçoamento de Pessoal de Nível Superior (CAPES, Ministry of Education, Brazil) is greatly acknowledged.
Reference
1. Lu, Y. R.; Foo, L. Y.; Phytochemistry2002, 59, 117.
2. Petersen, M.; Simmonds, M. S. J.; Phytochemistry2003, 62, 121.
3. Iuvone, T.; De Filippis, D.; Esposito, G.; D’Amico, A.; Izzo, A. A.; J. Pharmacol. Exp. Ther.2006, 317, 1143.
4. Zheng, W.; Wang, S. Y.; J. Agric. Food Chem.2001, 49, 5165. 5. Sahu, A.; Rawal, N.; Pangburn, M. K.; Biochem. Pharmacol.
1999, 57, 1439.
6. Kang, M. A.; Yun, S. Y.; Won, J. W.; Blood2003, 101, 3534.
7. Sanchez-Campillo, M.; Gabaldon, J. A.; Castillo, J.; Benavente-Garcia, O.; Del Bano, M. J.; Alcaraz, M.; Vicente, V.; Alvarez, N.; Lozano, J. A.; Food Chem. Toxicol.2009, 47, 386. 8. Lee, J.; Kim, Y. S.; Park, D.; Biochem. Pharmacol.2007, 74,
960.
9. Bonoli, M.; Pelillo, M.; Lercker, G.; Chromatographia2003,
57, 505.
10. Wang, H. F.; Provan, G. J.; Helliwell, K.; Food Chem.2004,
87, 307.
11. Bandoniene, D.; Murkovic, M.; Venskutonis, P. R.;
J. Chromatogr. Sci.2005, 43, 372.
12. Troncoso, N.; Sierra, H.; Carvajal, L.; Delpiano, P.; Gunther, G.; J. Chromatogr., A2005, 1100, 20.
13. Xu, J. Z.; Shen, J.; Cheng, Y. Y.; Qu, H. B.; J. Zhejiang Univ. Sci. B2008, 9, 728.
14. Lamien-Meda, A.; Nell, M.; Lohwasser, U.; Börner, A.; Franz, C.; Novak, J.; J. Agric. Food Chem.2010, 58, 3813. 15. Montgomery, D. C.; Design and Analysis of Experiments, 5th
ed.; Wiley: New York, USA, 2001.
16. Ferreira, S. L. C.; Bruns, R. E.; da Silva, E. G. P.; dos Santos, W. N. L.; Quintella, C. M.; David, J. M.; de Andrade, J. B.; Breitkreitz, M. C.; Jardim, I. C. S. F.; Neto, B. B.;
J. Chromatogr., A2007, 1158, 2.
17. Wichtl, M.; Herbal Drugs and Phytopharmaceuticals, 3rd ed.;
Medpharm Scientific Publishers: Stuttgart, Germany, 2004. 18. Miller, J. N.; Analyst1991, 116, 3.
19. Miller, J. C.; Miller, J. N.; Statistics for Analytical Chemistry, 2nd ed.; Ellis Horwood: Chichester, UK, 1988.
20. Kelley, C. J.; Mahajan, J. R.; Brooks, L. C.; Neubert, L. A.; Breneman, W. R.; Carmack, M.; J. Org. Chem.1975, 40, 1804. 21. Kelley, C. J.; Harruff, R. C.; Carmack, M.; J. Org. Chem.1976,
41, 449.
22. International Conference on Hormonisation (ICH) of Technical Requirements for Registration of Pharmaceuticals for Human Use, Q2(R 1), Validation of Analytical Procedures, Methodology, 1996, London, Complementary Guideline on Methodology incorporated in November 2005.
23. Agência Nacional de Vigilância Sanitária (ANVISA); Guia para Validação se Métodos Analíticos e Bioanalíticos, Resolução RE No. 899, Anvisa, Brasil, 2003.
24. Analytical Methods Committee; Analyst1994, 119, 2363.