Artigo
*e-mail: [email protected]
SYNTHESIS AND CHARACTERIZATION OF HDTMA-ORGANOCLAYS: INSIGHTS INTO THEIR STRUCTURAL PROPERTIES
Pablo M. Naranjoa,*, José Molinab, Edgardo Ling Sham a,c and Elsa M. Farfán Torresa,b
aInstituto de Investigaciones para la Industria Química, Consejo Nacional de Investigaciones Científicas y Técnicas, Av. Bolivia 5150 (A4408FVY) Salta, Argentina
bFacultad de Ciencias Exactas, Universidad Nacional de Salta, A4408FVY Salta, Argentina cFacultad de Ingeniería, Universidad Nacional de Salta, A4408FVY Salta, Argentina
Recebido em 13/03/2014; aceito em 16/09/2014; publicado na web em 13/11/2014
This study aims to synthesize and characterize organoclays developed from an Argentinian montmorillonite (Bent) using hexadecyltrimethylammonium bromide (HDTMA-Br) as the intercalation agent. Subsequently, an adsorption mechanism is proposed. The obtained organoclays were more hydrophobic than the starting clay. Surfactant molecules were adsorbed initially through cation exchange in sites placed in the interlayer space of the clay. Adsorption in such sites continued until the interlayer space was saturated. Depending on the surfactant loading introduced during the intercalation process, different organizations of surfactant in the interlayer were obtained. Further adsorption of surfactant occurred in the mesopores generated by tactoids in the “house of cards” organization. This process kept surfactant molecules relatively free and out of the interlayer space.
Keywords: nanoclay; surfactant; adsorption; cation exchange.
INTRODUCTION
Organic Pillared clays, also known as organoclays or nanoclays, are obtained by cation exchange of interlayer cations, component of 2:1 type clay minerals, with quaternary ammonium cations. This process leads to the formation of materials with hydrophobic charac-teristics that can be applied in a variety of processes, such as catalytic processes, rheological control agents in paintings and lubricants; polymer and plastics matrix reinforcing; adsorbents for effluent treatments, oil spilling, releasing active matrix, etc.1-6
The application of these materials depends strongly on the ob-tained structure, which, at the same time, conditions its properties. Therefore, understanding the relation between both the method and synthesis parameters used, and the developed structure, is of the utmost importance.
Among variables that affect the synthesis process, the properties of the employed clay must be considered: chemical composition, cation exchange capacity (CEC), charge density, specific surface area, etc.; and also those related to the synthesis process itself: kind and concentration of surfactant, time of contact, temperature, etc.
Some authors have demonstrated that the structure and properties developed by these materials are correlated directly with the organiza-tion of organic caorganiza-tions in the interlayer space,3 showing the importance of determining the type of arrangement developed in organoclays.
The purpose of this work was to synthesize and characterize organoclays from an Argentinian montmorillonite (Bent) with he-xadecyltrimethylammonium bromide (HDTMA-Br) as intercalation agent. The influence of the amount of intercalated hexadecyltri-methylammonium cation (HDTMA+) characterizing the obtained products was evaluated. Their structures were correlated with models of distribution and ordering of HDTMA+ molecules intercalated in the intra and extra layer space.
EXPERIMENTAL Materials
The used clay was an Argentinian bentonite sample (Bent) from Rio Negro Province, with mineralogy: 84% Na-montmorillonite, 4% quartz and 12% feldspars, determined by Rietveld method;7 the CEC was 0.837 mol kg-1, determined by the Cu(EDA)
22+ method.8 HDTMA-Br was supplied by Merck, (99%), used without further purification. All solutions and dispersions were prepared using deionized water obtained with SQC 3 Reverse Osmosis, from Water Factory System® equipment.
Samples preparation
Organoclays were obtained by putting in contact a 5% w/v sus-pension of starting clay with a determined volume of HDTMA-Br 5 × 10⁻³ mol L-1 solution for 2 h with orbital shaking at room temperature.“Surfactant loading” (SL) is defined as the x fraction of the CEC that is replaced by HDTMA+:
SL = (mol HDTMA+ / mol exchange cations) CEC = x CEC To obtain different SL, different volumes of HDTMA-Br 5 × 10⁻³ mol L-1 solution were used. Solid products were isolated by centrifugation and repeatedly washed with distilled water until they were free of bromide ions (determined by AgNO3 test). Furthermore, the solids were dried at 60 ºC over night, milled in agate mortar, kept under conditions of controlled humidity, and denoted as Bent followed by the SL (Bent-0.4; Bent-0.8, etc.).
Materials characterization
Differential thermal analysis (DTA) was performed with a Rigaku TAS 1100 from room temperature to 1200 °C, using about 20 mg samples, with a heat temperature rate of 20 °C min-1 in static air atmosphere.
X-ray diffraction (XRD) studies were obtained on oriented sam-ples by spreading the sample suspension on glass slides and further drying (48 h) at room temperature with a relative humidity of 0.47. Analyses were performed using a Philips PW 1710 diffractometer using CuKα radiation (0.154 nm). Measuring conditions were: a power supply of 40 kV and 30 mA; 1° (2θ) divergence and detector slits, 0.02° (2θ) step size, counting time of 10 s step-1 and patterns collected from 3° to 70° (2θ). In cases where overlapping peaks were detected, mathematical deconvolutions were performed with OriginPro 8 software. The positions and peak areas were calculated using the Gaussian functions, applying a fitting algorithm for non-linear least squares.
KBr pressed discs of dried montmorillonite and organoclays with a sample to KBr relationship of 1:100 approximately, ground in agate mortar and pressed at a pressure of 3 ton, were analyzed by FTIR in a Spectrum GX Perkin Elmer Infrared spectrometer, between 4000 and 400 cm-1.
N2 adsorption isotherms were obtained on a Micromeritics sorp-tometer ASAP 2020 V3.03 E, at -196 °C, previously outgassing solids at 100 ºC for 10 h (or until a pressure lower than 8 × 10⁻⁶ mmHg was reached). BET surface was calculated with at least 5 points with a minimum linear correlation coefficient of 0.999. Micropore Volume (VµP) was calculated with the t-plot method using Harkins-Jura-Boer equation; Total Pore Volume (VTP) by Gurvitch method, interpolat-ing at p/p0 = 0.98; and the Mesopore Volume (VmP) by the difference between VTP and VµP. Pore size distribution was conducted using Halsey equation over desorption branch.
Using Mopac 2009 software, a computational simulation of the surfactant molecule in all-trans conformation was performed. A semi-empirical method with a PM6 base was used for its optimization. In this way, molecular dimensions and surface area were calculated. Thickness values for the multilayer structures were also calculated through techniques of computational calculation.
RESULTS AND DISCUSSION TGA
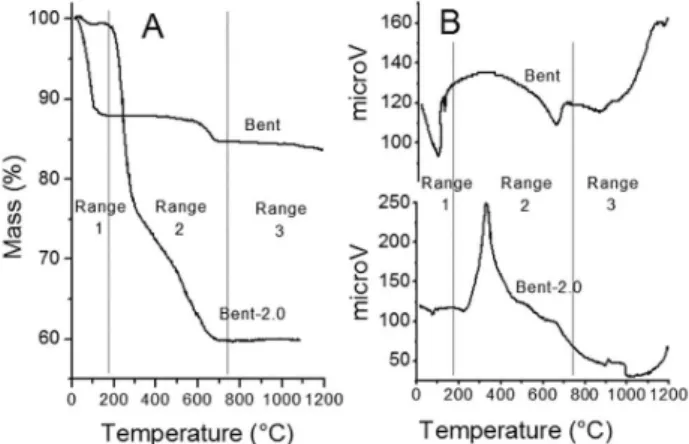
Thermal analysis of Bent samples showed the two typical re-gions associated with water-loss in smectites (Figure. 1).9 The water adsorbed by external surfaces and hydration water of the interlayer cations were removed between 80 and 150 °C, while structural water was released at temperatures higher than 500 °C. Thermal treatment of organoclays samples produced further mass loss at temperatures of 180 to 780 °C,10,11 corresponding to organic matter oxidation and charcoal formation.12 Temperature ranges were directly related with the SL of each sample.
To determine the mass loss scheme in each sample, ∆mi,α was defined as the mass loss produced in the α temperature range for the organoclays with an i surfactant load.
Range 1: Room Temperature – 180 ºC. Within this range of temperatures, physisorbed and interlayer water and/or of water of hydration of exchangeable cations (non structural water) were eliminated,13 both in the starting clay and in the organoclays. This mass loss was associated with the presence of endothermic peaks in the DTA curve.
Range 2: 180 °C – 800 °C. In this range, a mass loss of 3% was
observed in Bent clay that corresponds to dehydroxylation of clay layers.10,14,15
For organoclays, three mass losses in this range of temperatures were observed, associated with several (from 3 to 5) exothermic events (Figure 1). Initial and final temperatures of each one of these mass losses varied with the surfactant loading, but fell among the following subdivisions of range 2 (Table 1).
Range 2-a: Mass loss was associated with a very important exothermic event (Figure 1-B); its position depends on the SL. The amount of mass eliminated in this stage increased with the SL up to 2.0 CEC (∆m0.4,2-a = 2.5%, ∆m0.8,2-a = 4.0% and ∆m2.0,2-a = 22.5%) and then kept constant (∆m3.0,2-a = 22.0%).
Range 2-b: The second stage of mass loss was associated with various exothermic events, whose positions depended on the SL (Figure 1). The amount of mass eliminated in this stage increased with surfactant loading up to 0.8 CEC (∆m0.4,2-b = 4.5%, ∆m0.8,2-b = 8.2%,) and kept constant up to 2.0 CEC, whereas for higher SL mass, loss decreased slightly (∆m2.0,2-b = 8.5% and ∆m3.0,2-b = 7.5%). This slight decrease could be attributed to the fact that as SL increased, a higher amount of heat was released by combustion of organic groups in the 2-a range, which provided enough energy for the combustion of molecules that should be eliminated in range 2-b.
Range 2-c: A mass loss associated with a weak exothermic peak was observed (Figure 1). In this stage, mass loss due to dehydro-xylation of layers and the third stage of mass loss associated with surfactant combustion were overlapped.
To calculate the mass of organic compounds eliminated in this stage, the fact that mass corresponding to dehydroxylation of layers represents a 3% of Bent clay mass was taken into account.
The amount of organic compounds eliminated in this stage follows the same trend that the one observed in Range 2-b. The proportion of mass loss at this range of temperatures corresponding only to com-bustion of organic compounds (after subtracting the contribution of the dehydroxylation of layers) was 3.6%, 6.6%, 6.9% and 6.8% for Bent-0.4, Bent-0.8, Bent-2.0 and Bent-3.0 respectively.
Range 3: 800 ºC – 1200 ºC. For Bent sample, an endothermic maximum at 867 °C and two exothermic maximums at 906 and 1145 °C were found, all of them without any associated mass loss (Figure 1). These peaks were attributed to structural rearrangements and/or formation of new phases such as spinel, cristobalite or mullite.10
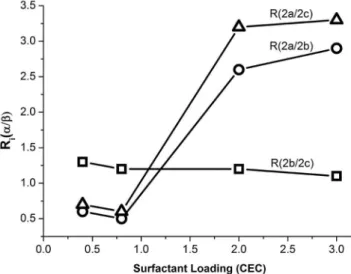
To perform a deeper analysis of the processes of mass loss observed at the different temperature ranges, the relation Ri(α/β)=(∆mi,α)/( ∆mi,β) was defined, where i and ∆mi,α have the meaning indicated in section 3-1, and β is a range of temperatures different from α.
Ri(2-a/2-b) and Ri(2-a/2-c), increased with the surfactant loading, whereas Ri(2-b/2-c) kept practically constant (Figure 2). The slight decrease of Ri(2-b/2-c) with SL was due to the strong release of heat that took place in stage 2-a, which was discussed before.
Thermograms of leached organoclays were also obtained. In general, they showed a similar behavior to starting organoclays. For surfactant loadings up to 0.8 CEC, values of ∆m2-a, ∆m2-b and ∆m2-c were not modified with leaching treatments. For superior SL, the ∆m2-a decreased with the lecheates, whereas ∆m2-b and ∆m2-c kept constant (Figure 3).
Taking into account Figures 2 and 3, ∆m2-b and ∆m2-c showed the same behavior. To facilitate the discussion of the results, stages 2-b and 2-c will be analyzed together, and be named as stage 2-(b+c).
The surfactant mass that was eliminated in stage 2-a decreased with lecheates and led to the conclusion that the ∆m2-a corresponds to molecules of surfactant weakly attached to the clay. On the other hand, in stage 2-(b+c), the loss of surfactant molecules more strongly attached to the surface was produced, as ∆m2-(b+c) did not decrease with lecheates.
XRD studies
X-ray diffraction patterns (Figure 4) of different organoclays showed values of the X-Ray diffraction peak corresponding to d(001) distance that increased from 12.1 Å for the starting clay up to 19.2 Å for the organoclay with higher SL (3.0 CEC). This increase (Table 2) indicated that at least a fraction of the cationic surfactant has replaced the hydrated interlayer cations.7
In Bent-0.8 the X-Ray diffraction peak d(001) was actually com-posed by the overlapping of more than one component. In Bent-2.0
and in Bent-3.0 the presence of other X-Ray diffraction peaks of lower intensity was also observed. This behavior is an indicator of interstratification. The area of those peaks is related to the amount of layers with a determined value of d(001).
In table 2, the positions of d(001) X-Ray diffraction peaks obtained by deconvolution of XRD pattern are shown. From these distances, the basal spacing was calculated, taking into account that the thick-ness of the layer was 9.5 Å.16 In the cases in which there are more than one d(001) line, the percentages of the area of each one of them in respect to the total area were calculated.
Table 1. Temperatures of the different steps observed in TG, and position of the centre of the ATD peaks related to the steps
Sample Limits (°C) Maximum T (°C)
Range 2-a Range 2-b Range 2-c Range 2-a Range 2-b Range 2-c
Bent - - 448 – 690 - - 662*
Bent 0.4 220 - 343 343 - 573 573 – 784 291 322 655
Bent 0.8 212 - 321 321 - 560 560 - 779,5 311 329, 401, 534 650
Bent 2.0 184 - 334 334 - 554 554 – 758 300 346, 417, 516 668
Bent 3.0 185 - 313 313 - 544 544 – 782 282 342, 548 648
*Endothermic event that corresponds to dehydroxylation of layers.
Figure 2. Ri(α/β) (equation 4) in function of surfactant loading. (): Ri(2--a/2-b), (): Ri(2-a/2-c), (): Ri(2-b/2-c)
Figure 3. Washing effect from a Bent-2.0 sample. Squares indicate mass loss in range 2-a, circles in range 2-b and triangles in range 2-c
To determine the type of structure developed by the surfactant intercalated within clay layers, the molecule of HDTMA+ was mod-elled in an all-trans conformation.
Considering both the computational models and the interlaminar distances experimentally obtained, different structures that the surfac-tant could present in the interlamelar space were proposed (Table 2).
N2 adsorption
For expandable clays, N2 adsorption studies give a sub-evaluation of the specific surface area value because they only provide informa-tion about the external surface.7,17 They also provide information about the meso and macropores that could be generated by the ordering of tactoids in the structures of the “house of cards” type18 or, in the case of mixture of clays with other materials of bigger grain size, by the spatial ordering of particles.19
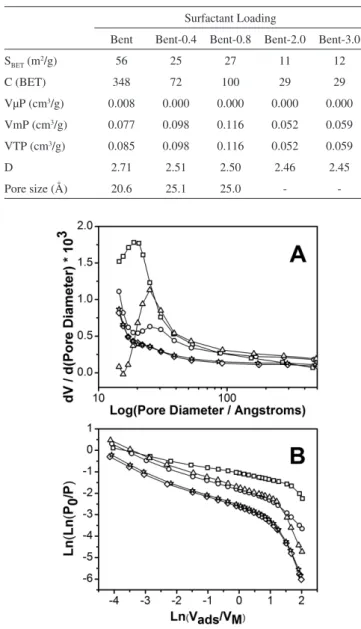
The N2 adsorption isotherm of Bent sample presented a hysteresis loop type B, indicating mesopores presence (Figure 5).20 This hys-teresis loop decreased with the SL until it disappeared for Bent-2.0 and Bent-3.0 samples. Pore size distribution (Figure 6-A) displayed a maximum of pore size of 20.6 Å for Bent sample, increasing up to 25.1 Å for Bent-0.4 and Bent-0.8 samples. A maximum in the curve
of pore size distribution for Bent-2.0 and Bent-3.0 samples was not observed. The value of BET surface area decreased from Bent (56 m2 g-1) to almost 10 m2 g-1 for clays with higher SL (Table 3).
Total pore volume (VTP) increased with the SL from Bent to Bent-0.8, and then decreased for organoclays with higher SL (Table 3). Studies of scanning electron microscopy (not shown) have shown that the starting clay presents a rather compact structure with a great fraction of the layers presenting a face to face ordering. On the other hand, organoclays present a more opened structure called “corn flakes”. This change in the structure generated the biggest porosity detected in organoclays. When the SL exceeded a certain value, the excess of surfactant occupied mesopores or blocked their entries, and, in this way, porosity decreased.
XRD results indicated that the interlayer space was never higher than 10 Å, so that observed mesopores (within 20.6 and 25.1 Å) corresponded to the pores generated by the “house of cards” order-ing type of tactoids. This indicate that, apart from the amount of Table 2. Peak position, basal spacing and structure proposed for the surfactant
in the interlayer space. Values obtained by XRD analyses
Sample (2θ) d(001)
(Å) l (Å)
a
(%) Stucture
Bent 7.3 12.1 2.6 100
-Bent-0.4 6.22 14.2 4.7 100 Monolayer
Bent-0.8 6.08 14.5 5.0 33 Monolayer
5.27 16.8 7.3 67 Ps. Bilayer/Bilayer
Bent-2.0
9.28 9.5 0.0 4 Collapsed
6.54 13.5 4.0 4 Monolayer
4.78 18.5 9.0 92 Bilayer/Ps. Trilayer
Bent-3.0
9.06 9.8 0.3 6 Collapsed
6.30 14.0 4.5 2 Monolayer
4.60 19.2 9.7 92 Bilayer/Ps. Trilayer
l = Basal spacing; a = % of X-Ray diffraction peak area.
Figure 5. N2 adsorption-desorption isotherms. Symbols indicate: () Bent; () Bent-0.4; () Bent-0.8; () Bent-2.0 and () Bent-3.0 samples
Table 3. BET surface area, C constant, micropore (VµP), mesopore (VmP) and total pore (VTP) volume and fractal dimension of indicated samples. Values obtained by N2 adsorption/desorption isotherms
Surfactant Loading
Bent Bent-0.4 Bent-0.8 Bent-2.0 Bent-3.0
SBET (m2/g) 56 25 27 11 12
C (BET) 348 72 100 29 29
VµP (cm3/g) 0.008 0.000 0.000 0.000 0.000
VmP (cm3/g) 0.077 0.098 0.116 0.052 0.059
VTP (cm3/g) 0.085 0.098 0.116 0.052 0.059
D 2.71 2.51 2.50 2.46 2.45
Pore size (Å) 20.6 25.1 25.0 -
-Figure 6. Pore size distribution (A) and Fractal dimension (B). Symbols
HDTMA+ adsorbed in the interlayer space, there was another frac-tion of surfactant adsorbed in the external surface, occupying and/or blocking the mesopores.
To examine if an effect of surface coverage was present, frac-tal dimensions (D) were calculated using equations developed by Frenkel, Halsey and Hill (FHH Theory).21 D can be considered as an operational measure of surface roughness. Generally, D is placed be-tween 2 (soft and regular surface) and 3 (surface extremely irregular). In this work, as the starting solid (Bent) presents hysteresis, the equation used for calculating the fractal dimension was D = 3 – 1/m, where (1/m) was the absolute value of the slope obtained in the Ln(Ln(P0/P)) vs Ln(Vads/VM) graph (Figure 6-B).
Starting clay presented a high value for the fractal dimension (DBent = 2.71), similar to the value obtained by Wang for Saz-1 clay (DWang = 2.74),21 indicating a very irregular surface. The D value of organoclays decreased as surfactant loading increased. This decrease was produced in two stages: the first stage for Bent-0.4 and Bent-0.8 (DBent-0.4 = 2.51, DBent-0.8 = 2.50), that depends on the elimination of micropores as well as on the “softness” of the surface by the surfactant and the second stage for Bent-2.0 and Bent-3.0 (DBent-2.0 = 2.46, DBent-3.0 = 2.45) due to the increase in the amount of molecules of surfactant in the organoclay and the blocking of mesopores.
As the fractal dimension decreased and Total Pore Volume in-creased together with the SL for Bent-4.0 and Bent-0.8 solids, the un-intercalated surfactant covered the external surface as well as the internal surfaces of the walls of pores formed by tactoids grouping in “house of cards” type structures.
Consequently, from nitrogen adsorption isotherms it could be concluded that cationic surfactant, besides intercalating within clay layers, was adsorbed over the external surface and over the internal walls of mesopores, coating and decreasing surface roughness. It also fills or blocks mesopores, decreasing hysteresis and making it disappear from organoclays with higher SL.
FTIR
IR spectra of samples (Figure 7) showed that the absorption bands corresponding to the starting clay were also seen in organoclays, ap-proximately in the same positions.
Symmetric bending bands, rocking bands, and symmetric and asymmetric stretching of methylene (νs(CH2) and νas(CH2) respec-tively) were observed in all organoclays. ν(N-H) peak starts to be seen
from a SL of 2.0 CEC, as corresponds to free HDMTA+ molecules.22 This result agrees with the results obtained in N2 adsorption studies, indicating that for Bent-2.0 and Bent-3.0 organoclays, part of the surfactant is adsorbed out of the interlayer space, filling or blocking mesopores.
The more intense bands in the spectrum of surfactant correspond to symmetric (νs (CH2)) and asymmetric (νas (CH2)) stretching of methylene groups of the carbon chain of surfactant. As SL increases, the intensity of the bands increases and the frequency decreases, ac-cording to literature.21,23-27
Modelling the developed structures
Molecular modelling calculation showed that the wider surface that a HDTMA+ molecule can cover is of approximately 100 Å2. Thermogravimetry indicates the amount of molecules that were absorbed for each SL, and from DRX results the structure of the interlayer space of each organoclay was obtained. Using these data, the surface that can cover those surfactant molecules (SHDTMA+) could be calculated in the following way:
SHDTMA+ (m2/g) = f*n
HDTMA+ (mol)*NA*sHDTMA+ (Å2)*10-20 (m2Å-2) /
Mclay (g) (1)
where SHDTMA+ is the specified surface (in m2 g-1) that n moles of adsorbed surfactant (nHDTMA+) can cover, taking into account the surfactant structure in the interlayer space (monolayer, bilayer, etc); NA is the Avogadro number; sHDTMA+ is the surfactant molecule area (Å2); 10-20 is the conversion factor between m2 and A2; M
clay is the clay mass (g), and f is a factor that takes into account the amount of surfactant layers present in the interlayer space of the clay. The f factor is obtained knowing that, for example, if a bilayer is formed, the surface covered by the surfactant will be equivalent to the clay surface, as the surface of the inferior layer and the superior layer will both be considered, and therefore fbilayer = 1. In the same way, if a monolayer is formed the factor must be fmonolayer = 2, and for a trilayer ftrilayer = 2/3. For the intermediate structures, factors are calculated as the average of the structures that make them up. So, fps-bilayer = (2+1)/2 = 1.5, and fps-trilayer = (1+2/3)/2 = 5/6.
In the case of Bent-0.4 organoclays, the structure that was formed is a monolayer and the factor that was applied is fmonolayer = 2. For the other cases, the structures were interstratified, so that the factor that was applied is a weighted average, taking into account the percentages of the different structures present in each organoclay. For Bent-2.0 and Bent-3.0 cases the percentage of collapsed layers were also taken into account (Table 2).
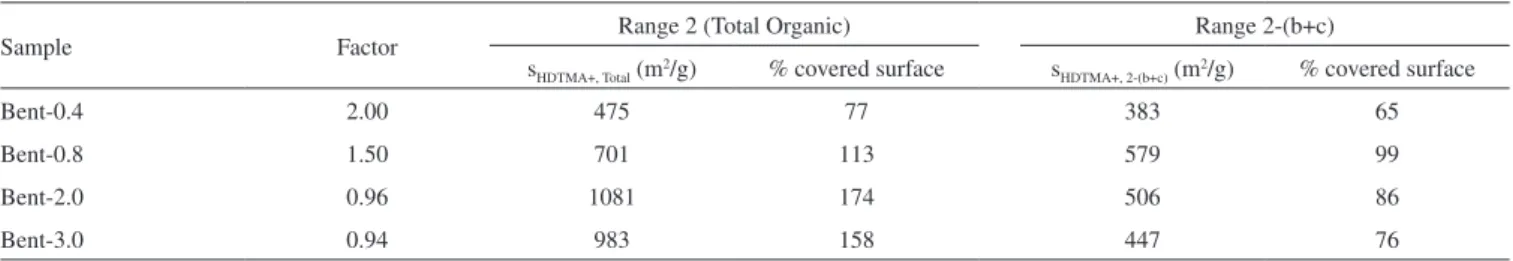
Equation (1) can be used with the total mass of absorbed organic compounds or with the mass of any of the fractions determined by thermogravimetry. In each case, the surface that the surfactant mol-ecules of the employed range can cover will be obtained. The results obtained employing the total amount of the adsorbed organic com-pounds are shown as SHDTMA+, Total, and the amount absorbed in range 2-(b+c) as SHDTMA+, 2-(b+c) (Table 4). The percentage that this surface represents in respect to the total surface of starting clay (621 m2 g-1)10 is also indicated.
For SL higher than 0.8, SHDTMA+, Total exceeded 100% of covered surface, which corroborated the fact that a fraction of surfactant is adsorbed out of the interlayer surface in the mesopores generated by tactoids ordering, causing the decrease of the pore volume and the elimination of the hysteresis loop that was observed in the N2 adsorption isotherm. On the other hand, SHDTMA+, 2-(b+c) never exceeded 100%, achieving 99% of surface covering for a SL of 0.8. The result confirmed that the surfactant corresponding to stage 2-(b+c) was
Table 4. Covered surface (%) obtained applying equation 1
Sample Factor Range 2 (Total Organic) Range 2-(b+c)
sHDTMA+, Total (m2/g) % covered surface s
HDTMA+, 2-(b+c) (m2/g) % covered surface
Bent-0.4 2.00 475 77 383 65
Bent-0.8 1.50 701 113 579 99
Bent-2.0 0.96 1081 174 506 86
Bent-3.0 0.94 983 158 447 76
adsorbed between layers. SHDTMA+, 2-(b+c) decreased for the organoclays with higher SL (2.0 and 3.0) which could be due to the excessive release of heat that was generated by the combustion of surfactant in range 2-a, as was explained before.
CONCLUSIONS
Obtained organoclays resulted to be more hydrophobic than the starting clay.
Surfactant, both in molecular and cationic form, was adsorbed in the Bent clay in at least two kinds of different sites, indicated by the different thermal stabilities.
From characterization results and molecular modelling calcula-tion, a mechanism of adsorption is proposed. The surfactant was adsorbed initially, in his cationic form, in sites placed in the interlayer space of the clay through cation exchange. Adsorption in these kind of sites continued until the interlayer space was saturated. Depending on the quantity introduced in the intercalation process, different organizations of surfactant in the interlayer, both in molecular and cationic form, were obtained, varying from monolayer in Bent-0.4 to Bilayer/Pseudo-trilayer in Bent-3.0.
Further adsorption of surfactant, principally in molecular form, occurred in the mesopores generated by tactoids ordered in the “house of cards” type structure. This process left surfactant molecules relati-vely free, out of the interlayer space. This fact could be favourable or unfavourable, and must be analyzed for each potential application in particular (catalytic processes, rheological control agents in paintings and lubricants; polymer and plastics matrix reinforcing; adsorbents for effluent treatments, oil spilling, releasing active matrix, etc.).
ACKNOWLEDGEMENTS
The funding for this work was granted by “Consejo de Investigación de la UNSa” (Project Nº 1632) and SECyT FONCyT-ANCyP (Project 1360). Authors acknowledge Lic. L. Davies, Ing. S. Locatelli, Dra. D. Acosta and Ing. J. Villarroel Rocha for their technical assistance and clarifying discussions. Pablo Naranjo thanks CONICET and Chubut Province for their fellowships.
REFERENCES
1. Azejjel, H.; del Hoyo, C.; Draoui, K.; Rodríguez-Cruz, M. S.; Sánchez-Martín, M. J.; Desalination2009, 249, 1151.
2. Carrado, K. A.; Appl. Clay Sci.2000, 17, 1.
3. de Paiva, L. B.; Morales, A. R.; Valenzuela Díaz, F. R.; Appl. Clay Sci. 2008, 42, 8.
4. Delbem, M. A.; Valera, T. S.; Valenzuela-Díaz, F. R.; Demarquette, N. R.; Quim. Nova2010, 33, 309.
5. Cavalcanti, J. V. F. L.; de Abreu, C. A. M.; Sobrinho, M. A. M.; Baraúna, O. S.; Portella, L. A. P.; Quim. Nova2009, 32, 2051.
6. Teixeira-Neto, E.; Teixeira-Neto, A. A.; Quim. Nova2009, 32, 809. 7. Reid-Soukup, U.; SSSA Book Series: 7 Soil Mineralogy with
Environ-mental Applications, Soil Science Society of America, Inc.: Madison, 2002.
8. Bergaya, F.; Vayer, M.; Appl Clay Sci.1997, 12, 275.
9. Hedley, C. B.; Yuan, G.; and Theng, B. K. G.; Appl. Clay Sci.2007, 35,
180.
10. Xi, Y.; Frost, R. L.; He, H.; J. Colloid Interface Sci. 2007, 305, 150.
11. Yariv, S.; Lapides, I.; J. Therm. Anal. Calorim.2005, 80, 11. 12. Mackenzie, R. C.; Differential Thermal Analysis, Academic Press:
Lon-don, 1970.
13. Moronta, A.; Solano, R.; Ferrer, V.; Sánchez, J.; Choren, E.; Ciencia 2003, 11, 130.
14. Xie, W.; Gao, Z.; Pan, W. P.; Hunter, D.; Singh, A.; Vaia, R.; Chem. Mater.2001, 13, 2979.
15. Magnoli, A. P.; Tallone, L.; Rosa, C. A. R.; Dalcero, A. M.; Chiacchiera, S. M.; Torres Sanchez, R. M.; Appl. Clay Sci.2008, 40, 63.
16. He, H.; Frost, R. L.; Bostrom, T.; Yuan, P.; Duong, L.; Yang, D.; Xi, Y.; Kloprogge, J. T.; Appl. Clay Sci.2006, 31, 262.
17. Michot, L. J.; Villieras, F. In Handbook of Clay Science; Bergaya, F.;
Theng, B. K.; Lagaly, G., eds.; Elsevier: Amsterdam, 2006, chap. 12.9. 18. Tessier, D.; Doctoral Thesis, Institut National de la Recherche
Agronomique, France, 1984.
19. Přikryl, R.; Weishauptová, Z.; Appl. Clay Sci.2010, 47, 163.
20. Gregg, S. J.; Sing, K. S. W.; Adsorption, Surface Area and Porosity, Academic Press: London, 1982.
21. Wang, C. C.; Juang, L. C.; Hsu, T. C.; Lee, C. K.; Lee, J. F.; Huang, F. C.; J. Colloid Interface Sci.2004, 273, 80.
22. Wang, C. C.; Juang, L. C.; Lee, C. K.; Hsu, T. C.; Lee, J. F.; Chao, H. P.; J. Colloid Interface Sci.2004, 280, 27.
23. Mandalia, T.; Bergaya, F.; J. Phys. Chem. Solids2006, 67, 836. 24. Patel, H. A.; Somani, R. S.; Bajaj, H. C.; Jasra, R. V.; Appl. Clay Sci.
2007, 35, 194.
25. Praus, P.; Turicová, M.; Študentová, S.; Ritz, M.; J. Colloid Interface Sci.2006, 304, 29.
26. Zhu, J.; He, H.; Zhu, L.; Wen, X.; Deng, F.; J. Colloid Interface Sci. 2005, 286, 239.