Quim. Nova, Vol. 33, No. 8, 1790-1793, 2010
N
ota
T
éc
ni
ca
*e-mail: [email protected]
TERBINAFINE: OPTIMIZATION OF A LC METHOD FOR QUANTITATIVE ANALYSIS IN PHARMACEUTICAL FORMULATIONS AND ITS APPLICATION FOR A TABLET DISSOLUTION TEST
Monika P. Tagliari*, Gislaine Kuminek, Sílvia H. M. Borgmann, Charise D. Bertol e Simone G. Cardoso
Departamento de Ciências Farmacêuticas, Universidade Federal de Santa Catarina, Campus Universitário Trindade, Bl. K, 88040-900 Florianópolis - SC, Brasil
Hellen K. Stulzer
Departamento de Ciências Farmacêuticas, Universidade Estadual de Ponta Grossa, Campus Uvaranas, Av. General Carlos Cavalcanti, 4748, 84030-900 Ponta Grossa – PR, Brasil
Recebido em 1/12/09; aceito em 25/3/10; publicado na web em 29/6/10
A simple liquid chromatographic method was optimized for the quantitative determination of terbinaine in pharmaceutical hydroalcoholic solutions and tablets, and was also employed for a tablet dissolution test. The analysis was carried out using a RP-C18 (250 mm × 4.6 mm, 5 μm) Vertical® column, UV-Vis detection at 254 nm, and a methanol-water (95:5, v/v) mobile phase at a
low-rate of 1.2 mL min-1. Method validation investigated parameters such as linearity, precision, accuracy, robustness and speciicity,
which gave results within the acceptable range. The tablets dissolution was quite fast: 80% of the drug was dissolved within 15 min. Keywords: terbinaine formulations; method validation; dissolution test.
INTRODUCTION
Terbinaine hydrochloride (TBF) (Figure 1), chemically known as (E)-N-(6,6-dimethyl-2-hepten-4-ynyl)-N-methyl-1-naphthalene me-thanamine hydrochloride, is an allylamine derivative with antifungal activity. TBF is a slightly water soluble drug, showing a solubility of 5.32 μg mL-1.1
TBF affects dermatophytes and some yeast, it is used orally for the treatment of dermatophyte infections of the skin and nails. It is also applied to the skin in the occurrence of dermatophytoses, pityriasis versicolor, and cutaneous candidiasis occurrence or su-pericial fungal infections, like seborrheic dermatitis, tinea capitis, and onychomycosis especially for its short duration therapy. TBF is commercially available in the pharmaceutical forms of creams, gels, tablets, sprays and solutions.2-4
There is an oficial method to quantify TBF raw material through titrimetry.5 However, TBF pharmaceutical formulations are not yet oficial in any pharmacopoeia. On the other hand, the literature descri-bes several methods to quantify TBF raw material, like, non-aqueous titrimetry, voltametry, UV derivative, capillary electrophoresis and high performance liquid chromatography (HPLC).6-10 Also, TBF has been determined in biological luids by HPLC technique and microbiological bioassays.11-15 Another HPLC method has been used to determine the drug in tablets and creams.16
However, there is a lack of information concerning both the
quantitation of TBF in pharmaceutical solution dosage forms and the dissolution test of TBF from tablet dosage forms.
Drug dissolution testing is an integral part of pharmaceutical development and routine quality control monitoring of drug release characteristics. The proiles, obtained from dissolution rate studies, have also been used in an attempt to characterize the in vivo behaviour of drugs with success. They have to be performed under precisely speciied conditions (i.e., temperature, volume, and stirring rate) that mimic processes in the human gastrointestinal tract.17 TBF is a poorly water soluble drug, so its dissolution is a critical parameter to be analyzed, especially from tablets, where there are excipients that could interfere with its release.
The method validation is necessary to quantify the TBF in phar-maceutical formulations and dissolution test because of the data that are generated, will only be trustworthy if the method used to generate the data is reliable.
In this way, an accurate, simple, reproducible, and sensitive liquid chromatographic method previously described,16 was applied with some modiications for TBF quantiication in hydroalcoholic solution and tablet dosage forms. This work also aimed at the determination of TBF after a tablet dissolution test.
EXPERIMENTAL
Chemicals
The TBF reference standard with stated purity of 99.8% was obtained from Galena (São Paulo, Brazil). The TBF formulations (hydroalcoholic solutions and tablets with 1% and 250 mg of TBF, respectively) analyzed were supplied by local drugstores. Ultrapure water was provided by a Milli-Q® puriication system (Millipore, USA). Methanol of HPLC grade was purchased from Vetec®. Other solvents and reagents used were of analytical grade.
Preparation of stock standard solution
A stock standard solution of 1000 μg mL-1 was prepared by dissolving 25 mg of TBF reference standard in 2 mL of methanol
Terbinaine: optimization of a LC method 1791 Vol. 33, No. 8
in a 25 mL volumetric lask. The volume was completed with the mobile phase.
Preparation of sample solutions
Amounts equivalent to 25 mg of TBF from pharmaceutical solu-tions and tablets were quantitatively transferred to 25 mL volumetric lasks, diluted with 2 mL of methanol and the volume was completed with the mobile phase. The obtained solutions were stirred in an ul-trasonic bath for 10 min and iltered through quantitative ilter paper. Subsamples of these solutions were diluted with mobile phase to provide inal concentrations of 150.0 μg mL-1. The samples were il-tered through 0.45 μm nylon membrane before injection in the HPLC.
HPLC instrumentation and chromatographic conditions
The HPLC analysis was performed on a Shimadzu LC-10A sys-tem (Kyoto, Japan) equipped with a LC-10AD pump, SPD-10AV UV detector (set at 254 nm), SCL-10Avp controller unit, and the sample injection was performed via a Rheodyne 7125 valve with a 20 μL loop. A reversed phase C18 Vertical® column (250 mm × 4.6 mm i.d. - 5 μm) maintained at 40 ± 1 ºC was employed. The mobile phase consisted of methanol and water (95:5 v/v) and was eluted isocratically at a low-rate of 1.2 mL min-1. The injection volume was 20 μL for all standards and samples. The peak areas were integrated automatically by computer using a Shimadzu Class VPV 6.14 software program.
Method validation
The method validation was based on the International Conference on Harmonization guidelines Q2 (R1),18 for validation of analytical procedures. The parameters used were required for the assay of a dosage form: linearity, range, quantiication and detection limits, accuracy, speciicity and precision.
Linearity and range
The linearity response was assessed in the range of 20.0-200.0 μg mL-1. Appropriate amounts of the stock solution were diluted with mobile phase to give concentrations of 20.0, 50.0, 100.0, 125.0, 150.0, 175.0 and 200.0 μg mL-1. On 3 different days each sample was injec-ted in triplicate. The peak areas of the chromatograms were plotinjec-ted against the concentrations of TBF to obtain the calibration curve. The 5 concentrations of the standard solutions were subjected to regression analysis by the least squares method to calculate calibration equation and correlation coeficient.
Determination of limit of quantitation (QL) and limit of detection (DL)
The QL and DL were based on the standard deviation of the response and the slope of the constructed calibration curve. The QL may be expressed as:
(1)
and the DL was expressed by the following equation:
(2)
where σ is the standard deviation of the response and S is the slope
of calibration curve.
Speciicity
The speciicity was evaluated by checking the absence of inter-ference by the excipients which take part in the solution (medium chain triglycerides, polyethylene glycol, propylene glycol, water and alcohol) and tablet formulations (microcrystalline cellulose, cros-povidone, anhydrous colloidal silica, magnesium stearate, talc and lactose). Their concentrations were determined based in Handbook of Pharmaceutical Excipients and calculated for medium weight content.19 Triplicate injections of each formulation were carried out.
Precision
The precision assay was determined by repeatability (intra-day) and intermediate precision (inter-day). The repeatability was eva-luated by assaying 6 samples solutions of TBF from solution and tablet formulations (150.0 μg mL-1)during the same day, under the same experimental conditions. Intermediate precision was evaluated by assaying 3 samples solutions on another day. The peak areas were determined and compared. The precision was expressed as percentage of relative standard deviation (R.S.D.); results must be less than 2% R.S.D.
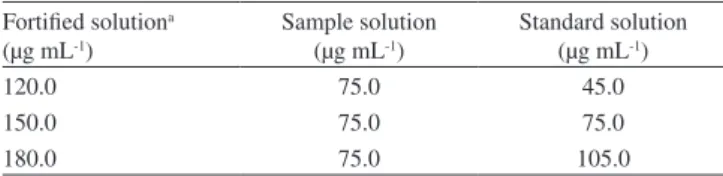
Accuracy
The accuracy of the developed method was evaluated by a reco-vering test. TBF sample solutions containing 75.0 μg mL-1 obtained from solution and tablet formulations were fortiied with 3 known concentrations of reference standard at 3 different levels (Table 1). The recovery of added standard was determined in triplicate analysis and calculated taking by the formula:
(3)
in which R is the recovery, FS is the fortiied solution, SS is the sample
solution and ST is the standard solution.
Robustness
The robustness of the method was determined by analyzing the same samples (150 μg mL-1) under a variety of conditions of the method parameters, such as: low rate (1.0, 1.2 and 1.4 mL min-1), column temperature (35 ± 1,40 ± 1 and 45 ± 1 °C), and variations in the mobile phase composition (methanol:water 93:7, 95:5 and 97:3).
Analysis of TBF pharmaceutical solutions and tablets
For quantitation of TBF in the dosage forms, 20 tablets contain-ing 250 mg of TBF and 6 solution lasks containcontain-ing 1% of TBF were separated. Aliquots of 25 mg of TBF from each tested sample were transferred into individuals 25 mL volumetric lasks containing 10 mL of mobile phase, stirred in an ultrasonic bath for 10 min and diluted to volume with the same solvent, obtaining the inal concentration of 1000 μg mL-1. Appropriate amounts of this solution were diluted with the mobile phase, yielding concentration of 150.0 μg mL-1. Aliquots of 20 μL were injected for the analysis and the amount of drug in the solu-tions and tablets calculated against the respective reference standard. Table 1. The recovery test performed for each formulation
Fortiied solutiona
(μg mL-1)
Sample solution (μg mL-1)
Standard solution (μg mL-1)
120.0 75.0 45.0
150.0 75.0 75.0
180.0 75.0 105.0
Tagliari et al.
1792 Quim. Nova
Method application for a dissolution test of TBF tablets
TBF tablet dissolution test was performed in a multibath (n = 6) dissolution test system Varian (São Paulo, Brazil), in accordance with the United States Pharmacopoeia (USP) general methods.20 The dissolution method was based on the FDA.21 The dissolution apparatus was used with paddles at 50 rpm and bath temperature maintained at 37 ± 0.5 °C. Five hundred millilitres of freshly prepared and degassed citrate buffer solution pH 3.0 was used as the dissolution medium. Dissolution samples (10 mL) were collected at 10, 15, 20, 30 and 45 min and iltered through quantitative ilter. Sample solutions of 2 mL were transferred into a 10 mL volumetric lask, the solution pH was corrected to 6.0 and diluted with mobile phase. The TBF standard solution (100.0 μg mL-1) was prepared in the same way. The solutions were iltered through 0.45 μm membrane ilter and the TBF quantiication was performed by LC-method. The measured peak area of the test samples was compared with the peak area of the TBF standard. The amount of TBF in the tested samples was calculated as percentage dissolved.
RESULTS AND DISCUSSION
Method validation
Since TBF pharmacopoeial monographs are currently not avai-lable in any oficial compendia, the LC-method here employed was based on the previously validated method of Cardoso and Schapoval16 in which a HPLC method for the quantitation of TBF in pharmaceu-tical tablets and creams was developed and validated.
According to ICH, revalidation may be necessary in the circu-mstances that there are changes in the composition of the inished product and/or in the analytical procedure. Besides, the degree of revalidation required depends on the nature of the changes.18 The-refore, the original method suffered some modiications because it was applied for a different purpose. In this work the main objective is to quantify TBF in pharmaceutical solutions and tablets, and to quantify the drug after a dissolution test of tablets. Besides, changes were made in HPLC system temperature, stationary phase, mobile phase low rate, and equipment model which are important parameters that could interfere with the inal results.
In accordance with Cardoso and Schapoval,16 the UV absorption spectrum of TBF had showed an intense absorption at 224 nm, but the detection was monitored at 254 nm since it offered more selectivity.
The TBF retention time with the optimized method was about 6.0 min.
The linearity of detector response was assessed of various solu-tion standards over the range of 20.0-200.0 μg mL-1. The value of the determination coeficient calculated (r2=0.9997, y = 16142x – 854; where, x is concentration and y is the peak absolute area) indicated the linearity of the calibration curve for the method. The validity of assay was veriied by analysis of regression (Fcalculated = 8568.5 > Fcritical= 0.0001; P=5%).
The quantitation and the detection limits calculated were 2.7 and 0.9 μg mL-1 respectively, which indicate the adequate sensitivity of the method.
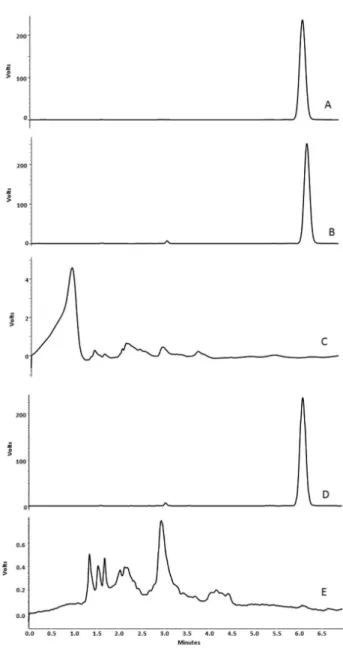
The speciicity of the method was evaluated by analyzing samples of solutions and tablets without TBF (placebo). The chromatograms showed that the method is speciic and there is no interference or overlaps of the excipients with the TBF response at 254 nm detection wavelength (Figure 2).
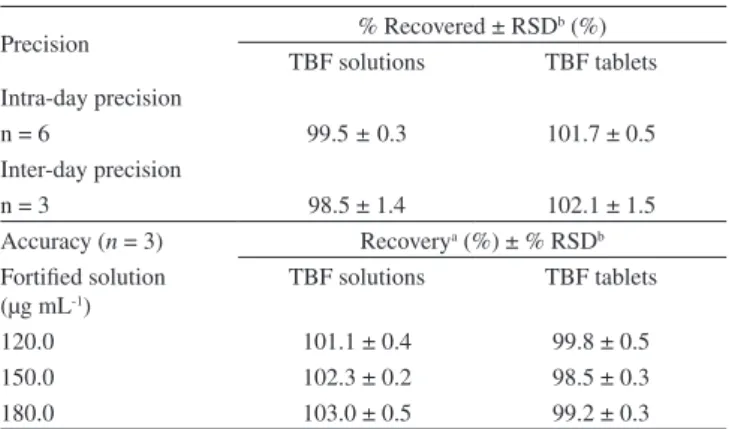
The repeatability (intra-day) and intermediate precision (inter-day) of the method were determined and the obtained results are reported in Table 2. All the data are within the acceptance criteria of
2%, which indicate acceptable precision. The amounts of TBF found on the analysis were equivalent (P < 0.05).
The accuracy of the method was determined by the recovery test. The recovery percentage was calculated from the differences between the peak areas obtained from fortiied and sample solutions. No signiicant differences were observed between amounts of TBF added and the amounts found (P < 0.05). The obtained values were within the range of 98.0-103.0% for solution and tablets, satisfying the acceptance criteria for the study (Table 2).
Robustness is deined as a measure of the method’s capabi-lity to remain unaffected by small, but deliberate variations in method parameters. In this way, it was observed that the column temperature did not affect the drug elution. On the other hand, the mobile phase composition and low rate resulted in changes in drug retention time (ranged from 5.2 to 6.9), because of these parameters are related with the time of interaction between drug and stationary phase. However, these small changes in retention time did not affect drug determination in the pharmaceutical formulations.
Figure 2. Representative chromatograms obtained under the experimental
conditions: (A) TBF standard (150.0 µg mL-1); (B) TBF solution dosage form
(150.0 µg mL-1); (C) placebo pf solution dosage form; (D) TBF tablet dosage
Terbinaine: optimization of a LC method 1793 Vol. 33, No. 8
Analysis of TBF pharmaceutical solutions and tablets
In accordance with the results previously described in this work, the method was successfully revalidated, demonstrating adequate li-nearity, speciicity, precision, accuracy and robustness, and is suitable to quantify TBF in pharmaceutical solutions and tablets.
The quantitative assay of TBF in solution dosage form was within 99.2-99.8%, while for tablet dosage form it was within 100.9-102.1%.
Dissolution test of TBF tablets
Dissolution testing is an essential requirement for the develo-pment, establishment of in vitro dissolution and quality control of solid oral dosage forms.
The LC-method described was applied to quantify TBF in tablets, and the content value was used to correct the dissolution percentage of them.
The drug release proile, determined by the dissolution test at mentioned conditions is given in Figure 3. The results are expressed as TBF concentration dissolved versus time. The proile can be considered satisfactory. The dissolution is quite fast: 80% of the drug was dissolved within 15 min and the drug dissolution was concluded after 45 min.
CONCLUSION
A simple and eficient reversed-phase HPLC method was revali-dated and found to be accurate, precise, robust and linear across the analytical range. The method was speciic for the determination and quantiication of TBF in solution and tablet dosage forms, and in dissolution samples. The method may be used to assess the quality of commercially available TBF pharmaceutical products.
REFERENCES
1. Hector, R. F.; Clinical Techn. Small Anim. Pract. 2005, 20, 240. 2. Evans, E. G.; Dodman B.; Williamson, D. M.; Brown, G. J.; Bowen, R.
G.; Br. Medic. J. 1993, 307, 645.
3. Haugh, M.; Helou, S.; Boissel, J. P.; Cribier, B. J.; Br. J. Dermatol. 2002, 147, 118.
4. Matysová, L.; Solich, P.; Marek, P.; Havlíková, L.; Nováková, L.; Šícha, J.; Talanta 2006, 68, 713.
5. European Pharmacopoeia, 2006, 6th ed., p. 2145.
6. Cardoso, S.; Schapoval, E. E. S.; J. AOAC Int. 1999, 82, 830.
7. Arranz, A.; Betoño, S. F.; Moreda, J. M.; Cid, A.; Arranz, J. F.; Anal. Chim. Acta 1997, 351, 97.
8. El-Saharty, Y. S.; Hassan, N. Y.; Metwally, F. H.; J. Pharm. Biomed. Anal. 2002, 28, 569.
9. Mikuš, P.; Valášková, I.; Havránek, E.; Talanta 2005, 65, 1031. 10. Rani, B. S.; Reddy, P. V.; Babu, G. S.; Sankar, G. G.; Rao, J. V. L. N. S.;
Asian J. Chem. 2006, 18, 3154.
11. Dotsikas, Y.; Apostolou, C.; Kousoulos, C.; Tsatsou, G.; Loukas, Y. L.; Biomed. Chromatogr. 2007, 21, 201.
12. Kovarik, J.; Mueller, E. A.; Zehender, H.; Denouel, J.; Caplain, H.; Millerioux L.; Antimicrob. Agents Chemother. 1995, 39, 2738. 13. Denouël, J.; Keller, H. P.; Schaub, P.; Delaborde, C.; Humbert, H. J.; J.
Chromatogr., B: Anal. Technol. Biomed. Life Sci. 1995, 663, 353. 14. Häusser, M.; Schmitt, M. J.; Bernard, E. M.; Armstrong, D.; Eur. J. Clin.
Microbiol. Infect. Dis. 1988, 7, 531.
15. Kan, L.; Henderson, D. K.; Bennett, J. E.; Antimicrob. Agents Che-mother. 1986, 30, 628.
16. Cardoso, S. G.; Schapoval, E. E. S.; J. Pharm. Biomed. Anal. 1999, 19, 809.
17. Savaser, A.; Goraler, S.; Tasoz, A.; Uslu, B.; Lingeman, H.; Ozkan, A. S.; Chromatographia 2007, 65, 259.
18. International Conference on Harmonization (ICH); Validation of Analyti-cal Procedures: Text and Methodology, Q2 (R1), November 2005. 19. Rowe, R. C.; Sheskey, P. J.; Owen, S. C; Handbook of Pharmaceutical
Excipients, 5th ed., Pharmaceutical Press: Londres, 2006.
20. The United States Pharmacopeia (USP), 30th ed., United States
Pharmacopoe ial Convention: Rockville, 2007, p. 2288.
21. United States Food and Drug Administration, Center for Drug Evalua-tion and Research (CDER); Dissolution methods for drug products, Rockville, 1997.
Table 2. Results from determination of the intra- and inter-day precision, and the accuracy of the method.
Precision % Recovered± RSDb (%) TBF solutions TBF tablets Intra-day precision
n = 6 99.5 ± 0.3 101.7 ± 0.5
Inter-day precision
n = 3 98.5 ± 1.4 102.1 ± 1.5
Accuracy (n = 3) Recoverya (%) ± % RSDb
Fortiied solution (μg mL-1)
TBF solutions TBF tablets
120.0 101.1 ± 0.4 99.8 ± 0.5
150.0 102.3 ± 0.2 98.5 ± 0.3
180.0 103.0 ± 0.5 99.2 ± 0.3
aaverage value obtained from three experiments; bRSD = Relative standard
deviation.