Ar
ti
cl
e
0103 - 5053 $6.00+0.00
*e-mail: [email protected]
Development and Validation of a Multivariate Calibration Model
for Determination of Dipyrone in Oral Solutions by Near Infrared Spectroscopy
Marcus H. Ferreira,a Jorge F. F. Gomesa and Marcelo M. Sena*,b
aIndústria Química do Estado de Goiás SA, IQUEGO, 74450-010 Goiânia-GO, Brazil
bUnidade Universitária de Ciências Exatas e Tecnológicas, Universidade Estadual de Goiás,
CP 459, 75000-000 Anápolis-GO, Brazil
Este trabalho propôs um novo método para a determinação de dipirona (DIP) em soluções orais farmacêuticas, usando medidas de translectância no infravermelho próximo (NIR) e calibração
multivariada. A faixa de estudo foi de 300,0 a 569,2 mg mL-1 de DIP. O melhor modelo PLS foi
obtido com 2 variáveis latentes e apresentou erros médios quadráticos de calibração e de previsão
(RMSEC e RMSEP) iguais a 1,1 e 1,0 mg mL-1, respectivamente. O método foi validado de acordo
com as resoluções da ANVISA e do ICH e foi considerado seletivo, linear, preciso, exato e robusto. Em comparação com as principais alternativas, titulação iodimétrica e CLAE, este método é mais simples, não-destrutivo, não gasta reagentes ou solventes nem gera resíduos. Além disso, a maior vantagem está na rapidez da análise, pois são gastos cerca de 50 s.
This work developed a new method for determination of dipyrone (DIP) in oral pharmaceutical formulations, through the use of near infrared (NIR) translectance measurements and multivariate
calibration. The studied range varied from 300.0 to 569.2 mg mL-1. The best PLS (partial least
squares) model was obtained with two latent variables and the root mean square errors of calibration
and prediction were 1.1 and 1.0 mg mL-1, respectively. The proposed method was validated in
accordance with ANVISA, the Brazilian regulatory agency, and ICH, being considered selective, linear, precise, accurate and robust. By comparison with the main alternatives, iodimetric titration and HPLC, this method is simpler, non-destructive, does not use reagents or solvents and does not produce chemical waste. Besides, its rapidity is considered the major advantage over the other methods, since only about 50 s were spent per assay.
Keywords: multivariate calibration, quality control, PLS, metamizole, near infrared spectroscopy
Introduction
Dipyrone (DIP), the sodium salt of [(2,3-dihydro-1,5-dimethyl-3-oxo-2-phenyl-1H-pyrazol-4yl)methylamino] methanesulfonic acid and also known as methamizole, is a non steroidal anti-inflammatory drug (NSAID) used as analgesic, antipyretic and antispasmodic. Since its introduction in the pharmaceutical market almost one hundred years ago, it has been one of the most consumed drugs in the word. The association of DIP administration with adverse effects, mainly the increased risk of agranulocytosis,1 is controversial and has led
to its banishment in more than ten countries, such as United States, Australian, Denmark, Norwegian and
Venezuela. In Brazil, in spite of restrictions on the sales for some formulations based on DIP,2 it has continued to
be one of the most consumed analgesics. Brazilian3 and
European4 Pharmacopoeias prescribe iodimetric titration
for DIP determination, which is the most frequently method used in Brazilian pharmaceutical industry for the DIP quality control. However, this method has the drawbacks of low precision, long time of analysis and needing of cooling in iced water aiming to avoid loss of iodine by volatizalion. DIP has also been determined in pharmaceutical formulations by HPLC,4,5 UV-Visible
spectrophotometry,6-10 turbidimetry,11 chemilumimetry,12,13
amperometry14 and voltammetry.15,16 The most of these
Nowadays, the great majority of analytical methods for quality control of pharmaceutical products are based on HPLC and univariate determinations. Although these methods are well established and recognized by regulatory agencies, they present the disadvantages of relative high cost and time consumption, spending substantial amounts of solvents and producing chemical waste. In the last years, near infrared spectroscopy (NIRS)17-19 has become
a promising alternative for developing simple and reliable methods, which provide accurate and precise results with less human intervention. Methods based on NIRS are rapid, non-destructive and of wide application, allowing direct recording of spectra for solid and liquid forms with little or no sample pre-treatment. These advantages have turned NIRS attractive for the determination of active pharmaceutical ingredients in recent years.20-24 The key
point for this growing popularity has been its combination with chemometric methodologies of multivariate calibration, since the complex nature of the NIR region seldom permits the use of single wavelength models for quantitative purposes.
Among the methods used for recording NIR spectra, the translectance mode is one suitable alternative for the analysis of liquid and semi-solid samples.17,20 This
measurement mode, frequent when optical bundle probes are employed, was used in this work. In it, the incident light crosses the sample, is relected off a piece of material such as stainless steel, gold or PTFE located on the opposite side, and travels back through the sample before reaching the detector. Thus, the optical path is twice as long as the distance between the entry point and the relector.
Although pharmacopoeias have adopted some NIR spectroscopic methods for the identification of pharmaceuticals, this technique has not yet been oficially endorsed for quantitative analysis. Considering the increasing regulatory pressure faced by the pharmaceutical industry to optimize quality control, a key aspect necessary for a wider acceptance of multivariate NIRS methods is the analytical validation. In Brazil, this aspect is regulated by ANVISA (National Agency of Sanitary Vigilance), which published a speciic resolution for validation of analytical and bioanalytical methods in 2003.25 This resolution is
based on the guidelines of International Conference on Harmonisation (ICH).26,27 The objective of this work
was the development of a simple method for direct determination of DIP in oral pharmaceutical solutions, based on translectance measurements on NIR region and multivariate calibration with partial least squares (PLS).28
The method was validated for using in routine analysis in accordance with ANVISA guidelines.
Experimental
Apparatus and software
NIR spectra were recorded on a Foss NIRSystems 4500 Smart Probe Analyzer spectrophotometer (Silver Spring, USA), equipped with a translectance probe. The reference signal employed for absorbance calculus is obtained from a measure of the empty cell closed to light. The instrument was controlled and data were acquired using the Vision 3.3.0.0 software package, also from Foss. Data were handled using MATLAB software, 6.5 version (The MathWorks, Natick, USA). PLS routine came from “PLS Toolbox”, 3.5 version (Eigenvector Technologies, Manson, USA).
Materials, reagents and solutions
The analyzed oral solution formulation has the following composition per mL: 500 mg of sodic DIP, 0.1 mg of disodic EDTA, 0.1 mg of sodium metabisulite, 100 mg of sorbitol 70% and deionized water. All the solutions were prepared with deionized water from a Millipore Milli-Q system (Bedford, USA). All chemicals were of analytical grade and used without further puriication. Sodic DIP was purchased from Shandong Xinhua Pharm. Co. (Zibo, China) and standardized by iodimetry.4,5 Two stock solutions, both of
569.2 mg mL-1 DIP, were prepared in 2000 mL volumetric
lasks containing appropriate amounts of excipients. These solutions were mixed, bubbled with nitrogen and iltered through cotton. Then, they were diluted accordingly in 50 mL volumetric lasks for the preparation of working solutions from 300.0 to 569.2 mg mL-1 (calibration and
validation sets). Blank (placebo) solutions containing only the excipients were also prepared.
Methodology
The working solutions were placed in polyethylene lasks of about 50 mL and spectra were recorded by immersing the translectance probe. Each spectrum was the average of 32 scans, obtained from 1100 to 2500 nm (step 2 nm), with an optical path of 2 mm. During the measurements, the temperature of the room was maintained at 25 oC.
selectivity evaluation. Six replicates of 500.0 mg mL-1
DIP solution were obtained for precision studies and the analyses were repeated at three different days with three different analysts for intermediate precision evaluation. Triplicates of 400.0, 500.0 and 569.2 mg mL-1 DIP solutions
were obtained for the accuracy study. Robustness was evaluated by varying two conditions, the content of sorbitol and the room temperature. In the irst essay, the interference of sorbitol was evaluated by measuring triplicates of a 490.0 mg mL-1 DIP solution containing three different levels
of this excipient: the standard content (100 mg), less 5% and more 5%. In the second essay, triplicates of another 490.0 mg mL-1 DIP solution were measured at 20, 25 and
30 oC. For the estimation of instrumental noise, ifteen
spectra of a blank solution were recorded in the sequence. For comparison purposes, a diffuse relectance spectrum of a pure solid sample of sodic DIP was recorded using an appropriate accessory. Finally, the obtained multivariate calibration model was applied in the determination of samples of three batches of a DIP pharmaceutical formulation produced by IQUEGO (Goiânia, Brazil). These samples were also analyzed by iodimetry, the oficial method of the Brazilian Pharmacopoeia.3 These
determinations were performed in triplicate.
Results and Discussion
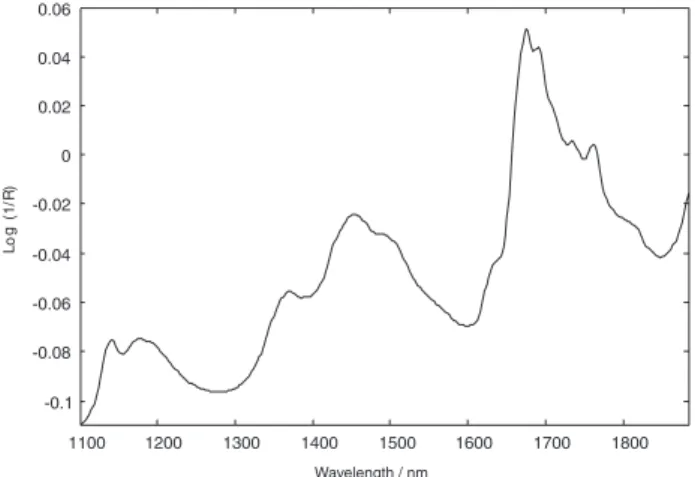
Translectance NIR spectra were originally recorded between 1100 and 2500 nm. A strong and broad absorption band above about 1900 nm was observed and attributed to O-H bond from water. Thus, it was decided to eliminate this region and to restrict the model to the region between 1100 and 1884 nm. Local models selecting parts of this wavelength region were also tried, but the best model was obtained for this whole region.
Since it was not feasible to obtain translectance spectra of pure DIP, a diffuse relectance spectrum of a solid sample of DIP was recorded for peak attribution purposes (Figure 1). Relectance spectra, though not identical to the corresponding absorption ones, are similar in shape and provide the same chemical information.17 By observing
Figure 1, it was possible to attribute the band between 1100 and 1250 nm to the second overtone and the combination of C-H bonds, the bands between 1250 and 1550 nm to the irst overtone and the combination of C-H bonds, and the peak at 1675 nm to the irst overtone of C-H bonds.29
The DIP content of the oral formulations must be between 95 and 105% of the value speciied by the manufacturer.3
Fifty one samples were prepared in the range from 300.0 to 569.2 mg mL-1. The upper limit was adopted because it
was not possible to dissolve more DIP in the conditions of
the analysis. The spectra are showed in Figure 2 and the calibration ones were correlated with reference values of DIP concentration as dependent variables through PLS regression. Thirty six solutions were chosen for the calibration set, in accordance with ASTM guidelines,30 and the remaining
ifteen samples were used for the validation set. The best PLS model was selected with two latent variables and using only mean centering as data pre-treatment, accounting for 94.41 and 99.97% of the data variance in X and Y blocks, respectively. The use of irst and second derivates and multivariate scattering correction (MSC) were tried, but PLS models presented higher errors. This is coherent with the observed absence of baseline deviations and drifts in the obtained spectra. Root mean square errors of calibration (RMSEC) and prediction (RMSEP) were calculated as 1.1 mg mL-1 (0.22%) and 1.0 mg mL-1 (0.20%), respectively.
By observing Figure 2, it is possible to note a spectral region between 1710 to 1820 nm, which could be attributed only to the active principle. Therefore, univariate calibration
Figure 1. Diffuse relectance spectrum of a DIP solid sample recorded
from 1100 to 1884 nm.
Figure 2. Spectra of fifty one DIP samples, corresponding to the
models using only one wavelength from this region were previously tested. Several wavelengths were tried and the best univariate model was obtained at 1790 nm, but the errors of prediction were about eight times larger than the ones obtained by the selected multivariate model. In addition, the obtained correlation coeficient was 0.98, lower than 0.99, the minimum value oficially accepted.25 Thus, the use of a
more complex multivariate model is justiied.
Analytical validation
The determination of figures of merit (FOM) is a fundamental requisite for the validation of multivariate methods, aiming at their acceptance by regulatory agencies in the future and, consequently, their wider application.31,32
The proposed NIR method was validated in accordance with ANVISA25 and ICH26,27 guidelines. Selectivity,
linearity, repeatability, intermediate precision, accuracy, robustness and range were estimated as required by ANVISA. Though not necessary for the oficial validation of this method, limits of detection and quantiication, sensitivity and analytical sensitivity were also estimated.
Selectivity
The terms selectivity and speciicity are considered synonymous by ANVISA25 and their meanings presented
in the guidelines from regulatory agencies are conceived in a univariate way. In contradiction to this, this concept should be applied to multivariate methods in a different way, which remains a challenge for oficial recognition of this kind of methods, in particular NIRS based ones. In this work, selectivity was evaluated by two different ways.
The irst one was based on the NIRS speciic guidelines33
and was established by the use of spectral libraries which allow the identiication of the pharmaceutical preparation as a combination of APIs and excipients, not to the analyte separated. The spectral library was developed containing spectra from ten production samples, which should encompass the normal variability of the productive process. The correlation coeficient was used as criterion and the threshold for positive identiication of the pharmaceutical preparation was set at 0.98, which allowed its identiication as such and differentiation from interferences (excipients).24
The selectivity of the library was assessed with external samples not used in its development. All the production samples studied were positively identiied and the main excipients (deionized water and sorbitol) and a placebo sample were correctly discriminated with identiication values below the threshold. The correlation coeficient values provided by the library are shown in Table 1.
The second way of evaluating selectivity was based on the application of the proposed multivariate model to predict triplicates of a placebo sample.23 Since these
predictions, 51.0 ± 2.9 mg mL-1, were far from the working
range from 300.0 to 569.2 mg mL-1of DIP, the method was
considered selective in the presence of excipients.
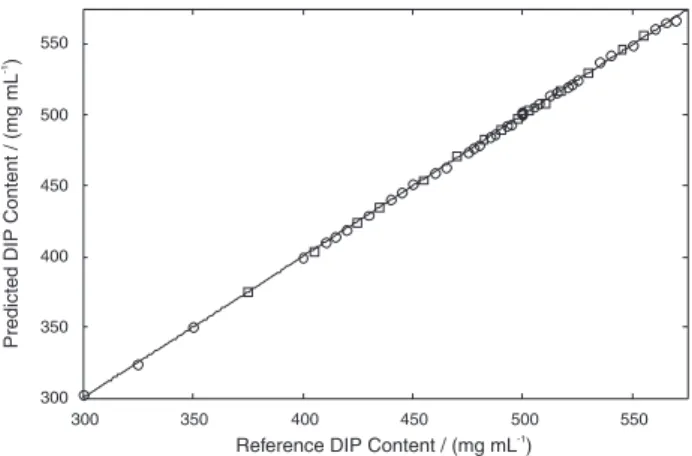
Linearity
For univariate methods, linearity is usually assessed from a signal versus concentration plot. Since multivariate methods do not allow this type of plot to be obtained, reference versus NIRS values plot is used instead. This plot for the proposed model in the range from 300.0 to 569.2 mg mL-1of DIP, corresponding from 60.0 to 113.8%
of the target DIP content in the analyzed formulation, is shown in Figure 3 and the obtained correlation coeficient was 0.9998, conirming the linearity of the method.
Precision
The precision of the method was evaluated at two levels, repeatability and intermediate precision. Repeatability was assessed by the same analyst determining six replicates of a 500.0 mg mL-1 DIP solution on the same day. The obtained
relative standard deviation (RSD) was 0.15% (0.8 mg mL-1),
Table 1. Selectivity. Identiication of the pharmaceutical preparation and
its excipients
Compound Correlation coeficient
Pharmaceutical preparation 0.99
Placebo preparation 0.96
Deionized water 0.96
Sorbitol 70% 0.91
Threshold 0.98 (positive identiication: Id results > 0.98).
Figure 3. Linearity. Plot of reference versus predicted values. Calibration
much lower than the oficially accepted 5% for this type of determination.25
Intermediate precision was assessed by three different analysts determining six replicates of a 500.0 mg mL-1 DIP
solution on three different days. The results are shown in Table 2 and the overall RSD was 0.44% (2.2 mg mL-1),
again much lower than 5%.
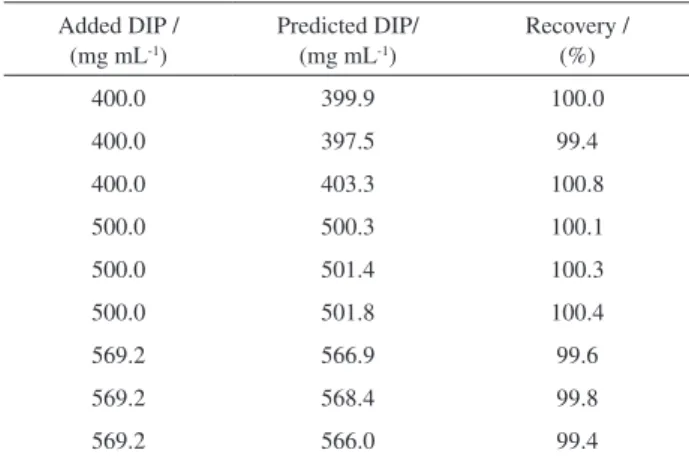
Accuracy
In chemometrics, accuracy is usually expressed through the RMSEP estimation for an independent validation set. Nevertheless, this parameter is not considered by regulatory agencies and the accuracy of the proposed NIR method was estimated in accordance with oficial guidelines25,27 by
applying it to nine synthetic mixtures, triplicates of three DIP concentrations, 400.0, 500.0 and 569.2 mg mL-1. The results
are shown in Table 3 and the recovery varied between 99.4 and 100.8%, assuring the accuracy of the method.
Robustness
The robustness was evaluated by varying two conditions. Firstly, the interference of the excipient sorbitol was evaluated. Triplicates of three samples of a 490.0 mg mL-1
DIP solution were prepared containing 95, 100 and 105 mg of sorbitol, respectively. The results for these predictions
are shown in Table 4 and non-paired t-tests demonstrated that there is no signiicant difference at 95% of conidence level. This result is important, because it indicates that the method is robust to a variation of ± 5% in the content of the main excipient. Since other excipients, such as EDTA and metabissulite, are present in much less quantity, they might show no interference.
Secondly, the robustness was evaluated by comparing predictions for triplicates of another 490.0 mg mL-1 DIP
solution at three levels of controlled room temperature, 20, 25 and 30 oC. The results are shown in Table 5 and t-tests
also demonstrated that there is no signiicant difference at 95% of conidence level. Thus, the method was considered robust in relation to small variations of temperature.
Range
Considering the linearity, precision and accuracy studies, the range of the method was established from 400.0 to 569.2 mg mL-1 of DIP.
Limits of detection and quantitation
According to oficial guidelines,25,26 the characteristics
of the proposed method dispense with the need to determine their limits of detection (LOD) and quantitation (LOQ). Nevertheless, LOD and LOQ were estimated for this method. LOD can be calculated for multivariate methods as follows:
LOD = 3 ||ε|| / ||NAS|| (1)
Table 2. Evaluation of the intermediate precision for the proposed
method, expressed through the RSD of six replicates of a 500.0 mg mL-1
DIP solution
Assay RSD / (%)
Analyst 1/Fist day 0.15
Analyst 2/Second day 0.75
Analyst 3/Third day 0.41
Table 3. Evaluation of the accuracy for the proposed method
Added DIP / (mg mL-1)
Predicted DIP/ (mg mL-1)
Recovery / (%)
400.0 399.9 100.0
400.0 397.5 99.4
400.0 403.3 100.8
500.0 500.3 100.1
500.0 501.4 100.3
500.0 501.8 100.4
569.2 566.9 99.6
569.2 568.4 99.8
569.2 566.0 99.4
Table 4. Evaluation of the robustness of the proposed method through the
determination of a 490.0 mg mL-1 DIP solution at three different levels
of sorbitol, the main excipient
Sorbitol Content / mg Predicted DIP / (mg mL-1)a
95 490.3 ± 1.7
100 489.6 ± 0.9
105 487.1 ± 1.4
aMean values and standard deviations of three determinations.
Table 5. Evaluation of the robustness of the proposed method through
the determination of a 490.0 mg mL-1 DIP solution at three different
temperatures, 20, 25 and 30 oC
Temperature / (oC) Predicted DIP / (mg mL-1)a
20 489.9 ± 1.2
25 491.5 ± 0.9
30 491.0 ± 1.0
where the symbol “|| ||” means the Euclidean norm of a vector, ε contains the estimation of the instrumental noise from ifteen spectra of the blank, and NAS is the net analyte signal. This last term is deined as the part of the signal that is orthogonal to the signal of the interferences present in the sample.34NAS is a vector containing values
for each sample and can be related to the regression vector,
b, from an inverse calibration model, such as PLS, by the following equation:35
||NAS|| = 1 / ||b|| (2)
For this method, LOD was estimated as 1.0 mg mL-1.
Analogously, LOQ could be estimated as 10 ||ε|| /
||NAS||, but NIRS speciic guidelines for the pharmaceutical industry33 indicate that is constrained by the lowest level
available in the sample calibration set. Therefore, LOQ was estimated as 300.0 mg mL-1 for this method.
Sensitivity and analytical sensitivity
The sensitivity (SEN) of a multivariate method can be estimated as the NAS at unit concentration,31,32 according
to equation 3. A more informative FOM is the analytical sensitivity (γ), which is deined, in analogy with univariate calibration,36 as the ratio between SEN and the instrumental
noise, as expressed in equation 4. The inverse of γ is an estimate of the minimum concentration difference that is discernible by the analytical method in the absence of experimental error, independent of the speciic technique employed.
SEN = ||NAS|| (3)
γ = SEN / ||ε|| (4)
The calculated values of SEN and γ were 0.01 and 3.05, respectively. This γ estimate means that the proposed method is able to discern a difference of 0.3 mg mL-1,
corroborating its good quality.
Analysis of real samples
Three batches of an oral pharmaceutical formulation manufactured by IQUEGO were analyzed by the proposed method and the results are shown in Table 6, together with the results obtained by the oficial iodimetric titration method.3 A non-paired t-test with four degrees of freedom
was used to compare the results of the two methods and the estimates show no signiicant difference at 95% conidence level. The observed standard deviations also showed that
the proposed method is more precise than the oficial one, but its main advantage is the rapidity of the analysis: about 50 s per assay versus about 40 min per assay for iodimetry.
Conclusions
A NIR method was developed for direct determination of DIP in oral pharmaceutical formulations. The proposed method is much more rapid than the main alternatives, namely iodimetric titration and HPLC. Besides, it presented other advantages over these methods, such as a simpliied analytical procedure with less human intervention, non-destructivity, no need for reagents or solvents and no production of chemical waste. In the future, this method could be applied to on line measurements. The NIR method was validated in accordance with ANVISA and ICH guidelines and was considered selective, linear, precise, accurate and robust, demonstrating the potential for future acceptance of this kind of method by regulatory agencies.
References
1. Danieli, P.; Leal, B. M.; Rev. Bras. Farm.2003, 84, 17. 2. http://www7.anvisa.gov.br/divulga/noticias/2004/161204.htm,
accessed in February 2007.
3. Farmacopéia Brasileira, 4a. ed., Ateneu Editora: São Paulo, Brasil, 2002.
4. European Pharmacopoeia, 4th ed., Council of Europe:
Strasbourg, 2002.
5. Senyuva, H. Z.; Aksahin, I.; Ozcan, S.; Kabasakal, B. V.; Anal. Chim. Acta2005, 547, 73.
6. Pereira, A. V.; Penckowski, L.; Vosgerau, M.; Sassa, M. F.; Fatibello, O.; Quim. Nova2002, 25, 553.
7. Lima, J. L. F. C.; Sá, S. M. O.; Santos, J. L. M.; Zagatto, E. A. G.; J. Pharm. Biomed. Anal.2003, 32, 1011.
8. Marcolino, L. H.; Sousa, R. A.; Fatibello, O.; Moraes, F. C.; Teixeira, M. F. S.; Anal. Lett.2005, 38, 2315.
9. do Nascimento, A. P.; Trevisan, M. G.; Kedor-Hackmann, E. R. M.; Poppi, R. J.; Anal. Lett.2007, 40, 975.
Table 6. Determination of DIP in three batches of an oral pharmaceutical
formulation by the proposed NIRS-PLS method and by the oficial iodimetric titration method. The label claim of the formulation is 500.0 mg mL-1
Batch number Proposed method / (%)a Oficial method / (%)a
#1 489.6 ± 0.8 490.0 ± 3.0
#2 501.7 ± 1.3 500.5 ± 4.0
#3 491.9 ± 1.0 493.0 ± 3.0
10. Weinert, P. L.; Pezza, L.; Pezza, H. R.; J. Braz. Chem. Soc.
2007, 18, 846.
11. Marcolino, L. H.; Bonifacio, V. G.; Fatibello-Filho, O.; Teixeira, M. F. S.; Quim. Nova2005, 28, 783.
12. Song, Z.; Zhang, N.; Talanta2003, 60, 161.
13. Zhao, L. X.; Li, B. X.; Zhang, Z. J.; Lin, J. M.; Sens. Actuators, B 2004, 97, 266.
14. Munoz, R. A. A.; Matos, R. C.; Angnes, L.; J. Pharm. Sci.2001, 90, 1972.
15. Teixeira, M. F. S.; Marcolino-Junior, L. H.; Fatibello-Filho, O.; Dockal, E. R.; Cavalheiro, E. T. G.; J. Braz. Chem. Soc.2004, 15, 803.
16. Daniel, D.; Gutz, I. G. R.; Anal. Chim. Acta2006, 571, 218. 17. Pasquini, C.; J. Braz. Chem. Soc.2003, 14, 198.
18. Blanco, M.; Villarroya, I.; TrAC, Trends Anal. Chem. 2002, 21, 240.
19. Burns, D. A.; Ciurczak, E. W.; Handbook of Near-Infrared Analysis, 2nd ed., Taylor & Francis: New York, 2001.
20. Blanco, M.; Romero, M. A.; J. Pharm. Biomed. Anal.2002, 30, 467.
21. Dou, Y.; Sun, Y.; Ren, Y.; Ren, Y.; Anal. Chim. Acta2005, 528, 55. 22. Freitas, M. P.; Sabadin, A.; Silva, L. M.; Giannotti, F. M.; do
Couto, D. A.; Tonhi, E.; Medeiros, R. S.; Coco, G. L.; Russo, V. F. T.; Martins, J. A.; J. Pharm. Biomed. Anal.2005, 39, 17. 23. Baratieri, S. C.; Barbosa, J. M.; Freitas, M. P.; Martins, J. A.;
J. Pharm. Biomed. Anal.2006, 40, 51
24. Blanco, M.; Alcalá, M.; Eur. J. Pharm. Sci. 2006, 27, 280.
25. Agência Nacional de Vigilância Sanitária (ANVISA); Guia para Validação de Métodos Analíticos e Bioanalíticos, Resolução-RE No. 899, Brasil, 2003.
26. International Conference on Harmonization; Tripartite Guideline-Q2A Text on Validation of Analytical Procedures, Fed. Regist., 60 FR 11260, USA, 1995.
27. International Conference on Harmonization; Tripartite Guideline-Q2B Validation of Analytical Procedures:
Methodology, Fed. Regist., 62 FR 27464, USA, 1997. 28. Brereton, R. G.; Analyst2000, 125, 2125.
29. Workman Jr., J. J.; Appl. Spectrosc. Rev.1996, 31, 251. 30. Annual Book of ASTM Standards, Standard Practices for
Infrared Multivariate Quantitative Analysis-E1655-00, ASTM International, West Conshohocken: Pennsylvania, USA, 2000. 31. Braga, J. W. B.; Poppi, R. J.; Quim. Nova2004, 27, 1004. 32. Braga, J. W. B.; Poppi, R. J.; J. Pharm. Sci.2004, 93, 2124. 33. Broad, N.; Graham, P.; Hailey, P.; Hardy, A.; Holland, S.;
Hughes, S.; Lee, D.; Prebble, K.; Salton, N.; Warren, P. In Handbook of Vibrational Spectroscopy, Chalmers, J. M.; Grifiths, P. R., eds.; vol. 5, Wiley: Chichester, UK, 2002, p. 34. Lorber, A.; Faber, K.; Kowalski, B. R.; Anal. Chem.1997, 69,
1620.
35. Booksh, K. S.; Kowalski, B. R.; Anal. Chem.1994, 66, 782A. 36. Cuadros-Rodriguez, L.; García-Campaña, A. M.;
Jimenez-Linares, C.; Román-Ceba, M.; Anal. Lett.1993, 26, 1243.
Received: March 15, 2008