Temperature-Dependent Photoluminescence Spectra of GaAsSb/AlGaAs and GaAsSbN/GaAs
Single Quantum Wells under Different Excitation Intensities
S. A. Lourenc¸o1, I. F. L. Dias1, J. L. Duarte1, E. Laureto1, V. M. Aquino1, and J. C. Harmand2 1Departamento de F´ısica, Universidade Estadual de Londrina – UEL, CP6001, CEP 86051-970 Londrina, Paran ´a – Brazil
2Laboratoire de Photonique et de Nanostructures, Centre National de la
Recherche Scientifique (CNRS), Route de Nozay 91460 Marcoussis, France
Received on 12 July, 2007
The mechanism for low-temperature photoluminescence (PL) emissions in GaAsSb/AlGaAs and GaAsSbN/GaAs strained-layer single quantum wells (SQWs), grown by molecular-beam epitaxy, is studied in detail, using PL spectroscopy as a function of temperature and excitation intensity. In all samples, the PL peak energy as well as the full width at half maximum (FWHM), as a function of temperature, present anomalous behaviors,i.e., the PL peak energy shows a successive red/blue/redshift (S-shaped behavior) and the FWHM shows a successive blue/red/blueshift (“inverted S-shaped curve”) with increasing temperature. At sufficiently low excitation intensity and in a narrow temperature interval (50 – 80 K), the nitrogen-containing samples present two clear competitive PL peaks. The low-energy PL mechanism (8 – 80 K) is dominated by localized PL transitions, while the high-energy PL mechanism is dominated by the ground state (e1-hh1) PL transition. Additionally, these PL peaks show different temperature dependence with the low-energy PL peak, showing a stronger redshift than the high-energy PL peak. A competition process between localized and delocalized excitons is used to discuss these PL properties.
Keywords: Diluted III-N-V semiconductors; Photoluminescece; Quantum wells; Exciton localization
I. INTRODUCTION
Diluted III-N-V semiconductor alloys have recently at-tracted a great deal of attention due to its unusual physical properties, such as strong reduction of the band-gap energy [1,2], and its possible use in GaAs-based optoeletronic and photonic devices, operating in the long-wavelength range (1.3 – 1.55µm), which are strategic for telecommunications [3-5]. Among these materials, the InxGa1−xNyAs1−yis an attractive alloy used in active layers of lasers with pulsed and continu-ous wave emission at 1.31µm[6,7]. However, it is difficult to obtain lasers of good quality using InGaNAs alloys at 1.55 µmwavelength emission [5,8]. Recently, an alternate material based on Sb technology – GaAsSbN – grown on GaAs sub-strate has been used to prepare optical devices that emit light at room temperature in the 1.3 – 1.55 µmwavelength range [9]. Particularly, 100- ˚A-thick GaAs0.825Sb0.15N0.025/GaAs quantum wells have demonstrated emission at 1.57µm[5].
Although N dramatically decreases the band-gap energy of N-based alloys, it brings a host of associated defects that make these materials to develop a strong PL property degradation [10-14]. In a previous paper, we showed that two efficient nonradiative channels are responsible for the strong thermal quenching of PL intensity in GaAsSbN/GaAs QW [12]. Many works have demonstrated that the disorder in the III-N-V al-loy has a strong effect on the carrier motion, and that the ra-diative recombinations are generally dominated by localized excitons [10-15]. In addition, with the incorporation of nitro-gen, the PL peak energy exhibits a successive red/blue/redshift with increasing temperature [11,16]. Although the interac-tion of carriers with sub-bands potential fluctuainterac-tions has been used to explain the origin of the strong carrier localization ob-served in III-N-V QWs, this issue is still under discussion in the literature [16-18], and very few works have analyzed the
GaAsSbN/GaAs system.
In this paper, we present an analysis of the excitonic local-ization energy in QWs withmoderate-GaAsSb/AlGaAs and high-GaAsSbN/GaAs potential fluctuation magnitude, using PL as a function of temperature and excitation intensity (under continuous wave excitation). The different PL spectra behav-ior, often observed in systems with different degrees of disor-der, are observed in the GaAsSb/AlGaAs and GaAsSbN/GaAs QWs at different excitation intensities. Additionally, we have fitted the temperature dependence of the PL peak energy, using a theoretical model for the luminescence of localized states, with a Gaussian-type density of states, combined with the temperature dependence of the band gap energy. This model reproduces, quantitatively, the anomalous temperature dependence of the PL peak energy observed in our samples.
II. EXPERIMENTAL DETAILS
In this work, two GaAsSbN/GaAs quantum well struc-tures with 150 ˚A of well width (GaAs0.843Sb0.15N0.007/GaAs and GaAs0.85Sb0.13N0.02/GaAs), as well as one N-free sample (GaAs0.8Sb0.2/Al0.3Ga0.7As) with 100 ˚A of well width, were used. These samples were grown in a conventional molecular-beam epitaxy system, equipped with a radio-frequency plasma cell as the nitrogen radical source on the undoped GaAs sub-strate. Details on the growth conditions and the methods used to determine the alloy compositions are given in Ref. 5.
detected by a thermoelectrically cooled GaInAspin photodi-ode, using a standard lock-in technique.
The PL spectra shown in this paper were obtained after post-growth thermal annealing of the samples. The anneal-ing conditions were 10 min at 6100C. More information on the thermal annealing can be found in Ref. 19.
III. EXPERIMENTAL RESULTS AND DISCUSSIONS
A. Experimental results
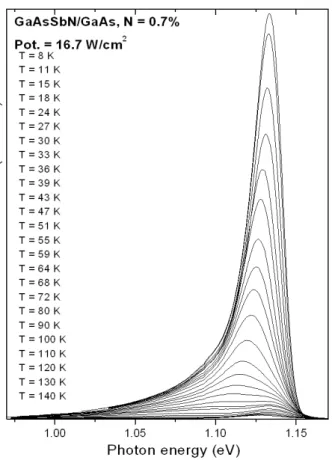
Figure 1 shows the PL spectra of GaAsSbN/GaAs QW with N = 0.7% for different temperatures under low excitation in-tensity (16.7 W/cm2). At low temperatures (8 – 43 K), the PL spectrum is dominated by only one peak, which shows a sig-nificant reduction in the intensity as the temperature increases. This thermal quenching effect was discussed in our previous work [12]. A second peak, at the higher-energy side, is ob-served at T>43 K, and at T>64 K it starts to dominate the spectrum. The PL spectra of the low energy channel present an asymmetric behavior with a long tail of∼130 meV at the
lower-energy side. This PL behavior is consistent with the tail of the DOS, characteristic of localized excitons (LE) [20-21]. However, the PL spectra of the second channel present a sym-metric behavior that is a characteristic of delocalized excitons (DE).
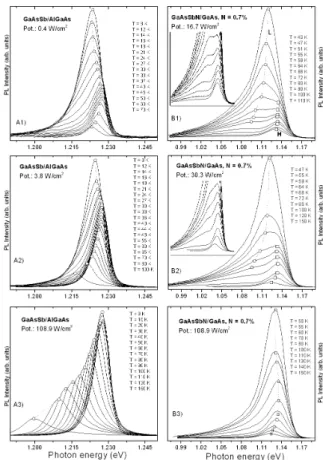
Figure 2 shows the PL spectra for the N-free sample (Fig. A1, A2, and A3) and for the N = 0.7% sample (Fig. B1, B2, and B3) at a narrow temperature interval (were the com-petition process between the luminescence of LE and DE is more intense) and for different excitation intensities. Under low excitation intensity (0.4 W/cm2), the PL spectra of the N-free sample (Fig. A1) present a moderate S-shaped behavior.
However, with higher excitation intensity, this PL spectra present a similar behavior to that observed in regular III-V semiconductor materials, free of potential fluctuation [22] (see Fig. A3). On the other hand, under low excitation, the PL spectra of N-containing sample present two clear competi-tive peaks at temperatures between 51 and 80 K (Fig. B1). These peaks are labeled as L (lower energy) and H (higher energy). With increasing excitation intensity, the H peak is fa-vored more and more so that it becomes impossible to visually separate the peaks L and H (Fig. B3). Then, the resulting PL peak energy (EPL) shows a successive red/blue/redshift dis-playing the so-called S-shaped behavior.
Figure 3 shows the temperature dependence of EPL for all samples. In the 8 – 33 K (Fig. 3A), 8 – 80 K (Fig. 3B), and 8-110 K (Fig. 3C) intervals, the PL peak reveals a strong depen-dence on the excitation intensity. With increasing excitation intensity, there is a gradual reduction in the first redshift and in the blueshift magnitudes for all samples. At sufficiently high excitation intensity, the first redshift and the blueshift disappear and the PL spectra as a function of temperature behave like in the regular III-V materials. The energy dif-ference between the minimum position of the first redshift and the maximum position of the blueshift (∆ET)is some-times cited in the literature as an excitation localization
en-FIG. 1: PL spectra of GaAsSbN/GaAs QW with N = 0.7% for dif-ferent temperatures. The excitation intensity was 16.7 W/cm2.
ergy [23,24]. As Fig. 3 shows, this energy difference depends strongly on the excitation intensity. At low excitation inten-sity (lower than∼30W/cm2for N = 0.7% and∼38W/cm2for
N = 2.0 %) it is not possible to obtain∆ET, showing that this is not a good method to estimate the localization energy in dilute nitrides (III-N-V) semiconductors. With increasing N, there is a gradual reduction of the radiative recombination ef-ficiency. PL efficiency degradation at low N concentration in III–V semiconductor materials has been reported by several research groups [10,25]. Thus, it was not possible to obtain the PL sign for temperatures above 60 K with excitation inten-sity below 38W/cm2in the sample with N = 2.0%. Fig. 3 also shows that the minimum position of the first redshift moves towards higher temperatures as the excitation increases.
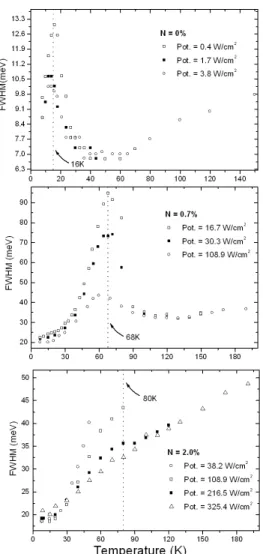
Figure 4 shows the temperature dependence of the full width at half maximum (FWHM) for different excitation in-tensities. At T = 8 K, the FWHM is about 9 meV (N-free) and∼20 meV for N = 0.7% and N = 2.0%. In the low
FIG. 2: PL spectra of GaAsSb/AlGaAs (A – left) and GaAsSbN/GaAs wit N = 0.7% (B – right) to a narrow temperature interval, where the emission process associated to LE and DE is more competitive, and for different excitation intensities. The dotted lines and empty symbols are only guides to the eyes.
and it shows, at sufficiently high excitation intensity, the reg-ular behavior presented by semiconductor materials, free of confinement potential fluctuations.
B. Discussion
The asymmetry observed in the PL spectra of both samples, at low temperatures and low excitation intensities, with an ap-parent exponential tail at the low-energy side, reflects the dis-tribution of the carriers into band-tail state of the DOS, typical of recombinations involving localized excitons [11,20,21,26]. According to this description, the exciton dynamic is deter-mined by the lattice temperature, by the excitation intensity, and by the potential fluctuation magnitude (see Fig. 5). At very low temperatures, the carriers thermalize to local min-ima (incomplete thermalization). For increasing temperature, at low excitation intensity, the excitons have sufficient ther-mal energy to overcome the sther-mall potential barriers in the lo-cal potential (ζ1), and they begin to thermalize and relax to the absolute potential minimum (ζ2). Thus, the EPLshifts to-wards a lower energy (first redshift). With an additional
in-(A)
(B)
(C)
FIG. 4: FWHM as a function of temperature for the GaAsSb/AlGaAs (Fig. 4A) and GaAsSbN/GaAs (Figs. 4B and 4C) QWs.
crease in the temperature, the excitons are thermally trans-ferred to the higher-energy states of the band-tail until reach-ing the conduction-band edge, shiftreach-ing the EPLtoward higher energies (blueshift). With a larger increase in temperature, the thermal energy prevents the exciton localization, and the line shape of the PL spectrum becomes a characteristic line shape of the DE recombination (second redshift). Thus, the S-shaped behavior and the blue-redshift of the EPL(T), as well as the inverted S-shaped temperature dependence of the FWHM, can be qualitatively interpreted by a competition process be-tween the recombination of localized and delocalized exci-tons. In this work, we show that the temperature for which this process of competition is maximum can be obtained from the positions of the FWHM peaks (Fig. 4) which are 16 K to N-free, 68 K to N = 0.7%, and∼80 K to N = 2.0%. Samples with
stronger potential fluctuation magnitude, such as III-V1−x-Nx, need higher thermal energy to detrap the excitons. Thus, the temperature for which the competition between the LE and
DE recombinations is maximum increases with the degree of potential disorder, as observed in our samples. In addition, as the energy of localization is greater for the N-samples the LE and DE recombination peaks in the PL spectrum are enough separated so that they can be observed in a narrow temperature interval at low excitation intensities.
A difference among the shifts of the EPL vs. T of Al-GaAs/GaAs [27,28], AlAl-GaAs/GaAsSb and Al-GaAs/GaAsSbN QWs with potential fluctuations, at low excitation intensity, is that the first redshift for AlGaAs/GaAs samples is missing. In this system, the potential fluctuation is small, which means that, even at low temperature (8 K), the carriers get sufficient thermal energy to detrap from weakly localized states (ζ1)and the thermalization is practically complete.
Figures 3B and 3C show that the L peak presents a stronger temperature-induced redshift than the H peak. This effect can be explained by the different origin of the temperature depen-dence of L and H peaks. The first redshift (L peak) arises from acarrier-redistribution process,i.e., the transfer of thermally activated excitons from a higher- to a lower-energy band-tail state. The second redshift (H peak) is due to the band-gap temperature dependence,i.e., a cumulative effect of thermal lattice expansion and electron-phonon interaction [22]. Re-cently, T. Khee Nget al.[16] detected a similar anomalous temperature-dependent photoluminescence characteristic of as-grown GaInNAs/GaAs QW, with two-segmented trend in the PL peak energy vs. temperature. They fitted the two-segmented temperature dependence of the PL peak energy us-ing the Varshni expression [29]. In this study, we show that the anomalous temperature-dependent photoluminescence char-acteristic is also observed in post-growth thermal annealing GaAsSbN/GaAs QWs, at low excitation intensity, and that the lower energy PL peak can be fitted using a thermal carrier re-distribution model.
FIG. 5: Schematic representation of confinement potential, Vcon f,
for two samples with different confinement potential fluctuations, sample A and sample B. Empty circles represent the delocalized ex-citons. The arrows indicate the relaxation process to the local or absolute potential minima. Filled circles represent the localized ex-citons at these minima. Dotted line represents the profile of con-finement potential to the sample with bigger magnitude of the poten-tial fluctuation (sample B).ζ1andζ2represent the potential barrier
heights for wells of the local minima and of the absolute minima, respectively.
re-sponsible for the decrease of the blueshift observed in Fig. 3. For sufficiently high-excitation intensities, the transitions re-lated to the band-tail states saturate, and the recombination of the DE becomes more efficient. Thus, the relative intensity of the DE recombination continues to increase with increasing excitation density, and the blueshift of the PL peak saturates. These trends (behavior of PL peak with excitation intensity) are confirmed by our samples as well as in GaAsN/GaAs [30] and InGaAsN/GaAs [24] QWs. The blueshift of the PL peak energy, caused by an increase in the excitation intensity, as well as saturation behavior at higher levels of excitation inten-sity, has been observed in alloys containing dot-like localized states [31].
The nature of the disorders in III-V1−x-Nxsemiconductors materials that lead to a band-tail states in the DOS can be in-terpreted as an inhomogeneous distribution of nitrogen atoms in alloy. In highly diluted III-V-N alloys (N<0.2%), the N in-sertion gives rise to discrete eletronic levels related to isolated single N atoms and to N-N pairs or clusters [32-37]. Within such limit, the low temperature PL spectra are characterized by a number of sharp lines (line width∼ 0.5 meV) due to
the recombination of excitons localized in N complexes [37]. The strongly localized character of the N isoeletronic traps leads to a strong local potential fluctuation for electrons and holes, resulting therefore in a semiconductor quantum dot be-havior [33,36]. Indeed, fluctuations of N compositions at 1% only leads to an∼180 meV change in the band-gap energy of
GaAs1−xNx[38-40]. The localization of excitons on quantum-dot-like composition fluctuations has been directly observed in temperature-dependent near-field photoluminescence spec-tra of InGaAsN [41] and GaNAs [42]. For increasing N con-centration, the PL from pairs states becomes an asymmetric line shape with a sharp high-energy cut-off and a long low-energy tail [25,36,37,43]. In a quaternary material such as GaInNAs and GaAsSbN, the situation is even more complex. The presence of a fourth element- In or Sb- at the proxim-ity of N atoms can significantly alter the energy of N-related localized states. Therefore, the QW structures based on
III-V1−x-Nxpresent avery highpotential fluctuation resulting in
a complex band tailing.
C. Theoretical approach
As shown in previous discussions, the emission spectra, in our materials, are composed of a radiative recombination of localized and delocalized states. Considering the radiative re-combination, the thermal escape, and the re-capture of the ex-citons in a localized state ensemble Liet al. [45,46] derive a distribution function of localized carries from a rate equation under quasi-steady state. Assuming that the localized state has a Gaussian-type energetic distribution of density of states, the luminescence spectrum of the localized excitons can be found. According to this model, the temperature dependence of the PL peak position is given by:
E(T) =E0−x(T)KBT (1)
The second term represents the effect of thermal redistrib-ution of localized carriers, andkBis the Boltzmann constant. The dimensionless coefficientx(T) can be obtained by solving numerically the following equation:
xex= "
µ σ
KBT ¶2 −x # µτ r τtr 
e(E0−Ea)/KBT (2)
whereE0andσare the central energy and broadening parame-ter for the distribution of the localized states, respectively.τtr is the carrier transfer time andτris the carrier recombination time. Like the Fermi level in the Fermi-Dirac distribution,Ea gives a special energy level below which the localized states are occupied by the excitons at 0 K. It shows that the mag-nitude and sign of (Ea−E0)affects strongly the temperature dependence of the PL peak [45,46].
In a high-temperature region, where (τr/τtr)exp[(E0−
Ea)/kBT]>>1, the approximated solution of Eq. (2) is
(σ/KBT)2, and the Eq.(1) becomes:
E(T)≈E0− σ
2 kBT
(3) which is the band-tail model proposed by Eliseevet al.[47].
On the other hand, the temperature dependence of the band gap energy in semiconductor materials can be described through the following relation proposed by P¨assler [48]:
Eg(T) =Eg(T =0)−αΘ
2 " p s 1+ µ 2T Θ ¶p −1 # (4)
whereEg(T =0)is the energy gap at zero Kelvin tempera-ture,α≡S(∞)≡ −(dE(T)/dT)T→∞is the high-temperature limit value for the forbidden gap entropy,Θ is a character-istic temperature parameter of the material representing the effective phonon energy~w=kBΘin units of absolute tem-perature, andpis an empirical parameter related to the shape of the electron-phonon spectral functions [48]. This expres-sion shows better fitting for the temperature dependence of the band-gap energy for several semiconductor materials, par-ticularly at the low temperature region, where the Varshni [29] model did not show good results.
Introducing the expressions (1) or (3) in equation (4), it is possible to obtain functions that fit the temperature depen-dence of the PL peak energy, in situations where the potential fluctuations are relevant. These relations are given by:
EPL(T) = (
E0−αΘ
2 " p s 1+ µ 2T Θ ¶p −1 #)
−x(T)kBT
(5)
EPL(T) = (
E0−αΘ
2 " p s 1+ µ 2T Θ ¶p −1 #) − σ 2 E KBT
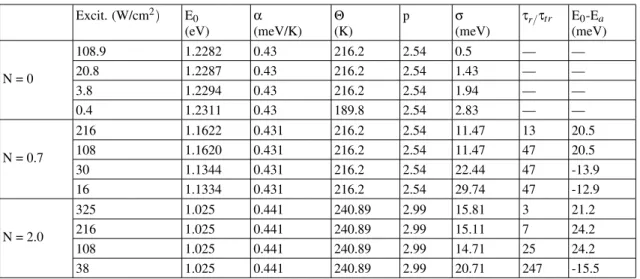
TABLE I: The parameters after fitting the experimental data on basis of Equations (5) and (6).
Excit. (W/cm2) E0
(eV)
α
(meV/K)
Θ
(K)
p σ
(meV)
τr/τtr E0-Ea
(meV)
N = 0
108.9 1.2282 0.43 216.2 2.54 0.5 — —
20.8 1.2287 0.43 216.2 2.54 1.43 — —
3.8 1.2294 0.43 216.2 2.54 1.94 — —
0.4 1.2311 0.43 189.8 2.54 2.83 — —
N = 0.7
216 1.1622 0.431 216.2 2.54 11.47 13 20.5 108 1.1620 0.431 216.2 2.54 11.47 47 20.5 30 1.1344 0.431 216.2 2.54 22.44 47 -13.9 16 1.1334 0.431 216.2 2.54 29.74 47 -12.9
N = 2.0
325 1.025 0.441 240.89 2.99 15.81 3 21.2 216 1.025 0.441 240.89 2.99 15.11 7 24.2 108 1.025 0.441 240.89 2.99 14.71 25 24.2 38 1.025 0.441 240.89 2.99 20.71 247 -15.5
Based on expression (6), the best numerical fit for our ex-perimental data (GaAsSb/AlGaAs) is represented by the line-symbol curves in the inset of Fig. (3A), and the best numerical fit, based on expression (5), is represented by the solid curves in the Figs. (3B) and (3C) for GaAsSbN/GaAs samples with N = 0.7% and N = 2.0%, respectively. The parameters obtained after fitting the experimental data are shown in Table 1.
WhenE0−Eatakes a positive value, the S-shaped temper-ature behavior of the PL peak energy can be well reproduced, as shown in figures 3B and 3C. Similar result was obtained for the InGaAsN material [46]. In low excitation regions, where it is possible to follow separately the energy variation of the L peak with the temperature (EPLL (T)and the energy variation of the H peak (EPLH(T)), the dependence ofEPLL (T)was obtained taking into consideration the negative values forE0−Ea. The
negative value for E0−Ea is in agreement with the results obtained by Li et al.[45] for InGaN alloy with In-rich clus-ters and by Xuet al. [49] for self-organized InAs quantum dots. WhenE0−Eais negative, the PL peak energy decreases rapidly as the temperature increases. This effect is produced by the thermal redistribution of the carriers in localized states. The inset of Fig. 3A shows that the EPL, obtained from a sample with N = 0, behaves differently with the excitation intensity, depending on the temperature of the sample. For T<33 K, the EPLincreases with increasing the excitation in-tensity, whereas for T=33 K the EPLremains practically con-stant. For T>33 K, the EPLdecreases with increasing the ex-citation intensity. This EPLversusexcitation intensity behav-ior can be understood as a competition process between the band-gap energy renormalization (at sufficiently high carrier densities the band-gap energy decreases with increasing exci-tation intensity [50]) and the blueshift of EPLdue to potential fluctuations. The fittings of the EPL(T), for different excitation intensities, were obtained by varying only the E0andσ para-meters in expression (6). α,Θandpvalues were considered constant. Such fittings are represented in the inset of Fig. 3A by line-symbols curves, and the parameters obtained are listed in Table 1. The decrease in excitation intensity is followed by the consistent increase inσand E0values.σcan be analyzed
as the degree of screening of the localized states by the carri-ers density. Ifσis null (high excitation intensity), the number of carriers are so high that the fluctuations are screened. In this case, EPL(T) must follow the temperature dependence of the band-gap energy. Ifσincreases (lower excitation inten-sity) the carrier-redistribution process, in the localized states, dominates the variation of the EPL(T) at low temperature in-terval. As excitation intensity was reduced, the E0increases due to lower band-gap renormalization and the increase of the blueshift range of the EPLcurve due to lowering of the band tail filling. These different process (carriers thermal redis-tribution and the band-gap renormalization effect) generate a crossing of the EPL(T) curves obtained in different excitation intensities. In the case of N-free samples, this crossing oc-curred at T≈33 K. We have observed a similar temperature
dependence of the EPL(T)for different excitation intensities in AlGaAs/GaAs single QWs [52]. In this case, the crossing temperature occurred at≈30 K. More details about this
dis-cussion can be seen in a future publication [53].
IV. CONCLUSIONS
com-position nonuniformity of the Sb/Al and the N, respectively. Since similar results were found for GaNAs/GaAs [18] and GaInNAs/GaAs [17] we suggest that the strong local fluctu-ations in the N concentration have the greatest effect on the recombination dynamics in GaAsSbN quaternary alloys.
The S-shaped emission behavior observed in our systems containing N was also observed in thin QWs systems of In-GaP/GaAs (Lw= 15 and 30 ˚A) [44], showing that the anom-alous PL-temperature dependence reported in this paper is not exclusive of samples containing N, but of systems withhigh potential fluctuation magnitude.
In addition, this study used a combination between a ther-mal distribution model for carriers in localized states of DOS [45,46] with the model proposed by P¨assler [48] for the perature dependence of the band-gap energy to fitting the tem-perature dependence of the PL peak energy. This
compound-model provided an adequate description of the S-shaped emis-sion behavior observed in our samples containing N for suf-ficiently high excitation intensities and the intense redshift of the PL peak energy with T for low excitation intensities.
Acknowledgments
The authors would like to acknowledge the financial sup-port granted by the Brazilian agencies: Coordenac¸˜ao de Aperfeic¸oamento de Pessoal de N´ıvel Superior (CAPES), Conselho Nacional de Desenvolvimento Cient´ıfico e Tec-nol´ogico (CNPq), Fundac¸˜ao Arauc´aria de Apoio ao Desen-volvimento Cient´ıfico e Tecnol´ogico do Paran´a (Fundac¸˜ao Arauc´aria), and Fundac¸˜ao Banco do Brasil (FBB).
[1] H. Saito, T. Makimoto, and N. Kobayashi, J. Cryst. Growth,
195, 416 (1998).
[2] W. Shan, W. Walukiewicz, J. W. Ager III, E. E. Haller, J. F. Geisz, D. J. Friedman, J. M. Olson, and Sarah R. Kurtz, J. Appl. Phys.86,2349 (1999).
[3] M. Kondow, T. Kitatani, S. Nakatsuka, M. C. Larson, K. Naka-hara, Y. Yazawa, M. Okay, and K. Uomi, IEEE, J. Setect. Topics in Q. Electron.3,719 (1997).
[4] J. F. Geisz and D. J. Friedman, Semicond. Sci. Technol.17,769 (2002).
[5] J. C. Harmand, G. Ungaro, J. Ramos, E. V. K. Rao, G. Saint-Girons, R. Taissier, G. Lˆe Roux, L. Largeau, and G. Patriarche, J. Cryst. Growth227,553 (2001).
[6] K. Nakahara, M. Kondow, T. Kitatani, M. C. Larson, and K. Uomi, IEEE. Photon. Technol. Lett.10,487 (1998).
[7] S. Sato, Y. Osawa, T. Saitoh, and I. Fujimura, Electronics. Lett.
33(1997) 1386.
[8] V. M. Ustinov and A. E. Zhukov, Semicond. Sci. Technol.15,
R41(2000).
[9] G. Ungaro, G. Le Roux, R. Teissier and J. C. Harmand, Eletron-ics Lett.35, 1246 (1999).
[10] I. A. Buyanova, W. M. Chen, G. Pozina, J. P. Bergman, B. Mon-emar, H. P. Xin, and C. W. Tu, Appl. Phys. Lett.75,501 (1999). [11] A. Polimeni, M. Capizzi, M. Geddo, M. Fischer, M. Reinhardt,
and A. Forchel, Appl. Phys. Lett.77,2870 (2000).
[12] S. A. Lourenc¸o, I. F. L. Dias, L. C. Poc¸as, J. L. Duarte, J. B. B. de Oliveira, and J. C. Harmand, J. Appl. Phys.93,4475 (2003) [13] L. Grenouillet, C. Bru-Chevallier, G. Guillot, P. Gilet, P. Du-vaut, C. Vannuffel, A. Million, and A. Chenevas-Paule, Appl. Phys. Lett.76,2241 (2000).
[14] H. P. Xin, K. L. Kavanagh, Z. Q. Zhu, and C. W. Tu, Appl. Phys. Lett.74,2337 (1999).
[15] M. A. Pinault and E. Tounie, Appl. Phys. Lett.78,1562 (2001). [16] T. K. Ng, S. F. Yoon, W. K. Loke, S. Wicaksono, J. Cryst.
Growth270,351 (2004).
[17] S. Shirakata, M. Kondow, and T. Kitatani, Appl. Phys. Lett.80,
2087 (2002).
[18] X. D. Luo, Z. Y. Xu, Z. Pan, L. H. Li, and Y. W. Lin, Appl. Phys. Lett.79,958 (2001).
[19] J. C. Harmand, A. Caliman, E. V. K. Rao, L. Largeau, J. Ramos, R Teissier, L. Travers, G. Ungaro, B. Theys, and I. F. L. Dias, Semicond. Sci. Thechnol.17,77 8(2002).
[20] Djamel Ouadjaout, Yves Marfaing, Phys. Rev. B 46, 7908 (1992).
[21] A. A¨ıt-Ouali, J. L. Brebner, R. Y. –F. Yip, and R. A. Masut, J. Appl. Phys.86,6803 (1999), and references therein.
[22] S. A. Lourenc¸o, I. F. L. Dias, J. L. Duarte, E. Laureto, D. O. Toginho Filho, E. A. Meneses, and J. R. Leite, Eur. Phys. J. B
21,11 (2001), and references therein.
[23] B. Q. Sun, D. S. Jiang, Z. Pan, L. H. Li, and R. H. Wu, Appl. Phys. Lett.77,4148 (2000).
[24] S. Shirakata, M. Kondow, and T. Kitatani, Appl. Phys. Lett.79,
54 (2001).
[25] I. A. Buyanova,W. M. Chen, B. Monemar, H. P. Xin, and C.W. Tu, Mater. Sci. Eng. B 75,166 (2000).
[26] M. Grassi, A. F. Fragano, A. Patan´e, M. –Capazi, E. Runge, and R. Zimmermann, Phys. Rev. B 61,10985 (2000), and ref-erences therein.
[27] C. Delalande, M. H. Meynadier, and M. Voos, Phys. Rev. B31,
2497 (1984).
[28] M. Gurioli, A. Vinattieri, J. Martinez-Pastor, and M. Colocci, Phys. Rev. B 50,11817 (1994).
[29] Y. P. Varshni, Physica34, 194 (1967).
[30] F. Saidi, F. Hassen, H. Maaref, L. Auvray, H. Dumont, Y. Mon-teil, Mater. Sci. Eng. C 21,245 (2002).
[31] T. Mattila, S. Wei, and A. Zunger, Phys. Rev. Lett.83,2010 (1999).
[32] X. Liu, M. -E. Pistol, and L. Samuelson, Phys. Rev. B42,7504 (1990).
[33] P. Leroux-Hugon and H. Mariette, Phys. Rev. B 30, 1622 (1984).
[34] S. Francouer, S. A. Nikishin, C. Jin, Y. Qiu, and H. Temkin, Appl. Phys. Lett.75,1538 (1999).
[35] T. Makimoto, H. Saito, T. Nishida, and N. Kobayashi, Appl. Phys. Lett.70,2984 (1997).
[36] P. C. Kent and A. Zunger, Phys. Rev Lett.86,2613 (2001). [37] Y. Zhang, B. Fluegel, A. Mascarenhas, H. P. Xin, and C. W. Tu,
Phys. Rev. B 62,4493 (2000);63, 085205 (2001). [38] S. -H. Wei, and A Zunger, Phys. Rev. Lett.76,664 (1996). [39] W. Shan, W. Walukiewicz, J. W. Ager, E. E. Haller, J. F. Geisz,
D. J. Friedman, J. M. Olson, and S. R. Kurtz, Phys. Rev. Lett.
82,1221 (1999).
3312 (1999).
[41] A. M. Mintairov, T. H. Kosel, J. L. Merz, P. A. Blagnov, A. S. Vlasov, V. M. Ustinov, and R. E. Cook, Phys. Rev. Lett.87,
277401 (2001).
[42] K. Matsuda, T. Saiki, M. Takahashi, A. Moto, and S. Takagishi, Appl. Phys. Lett.78, 1508 (2001).
[43] H. P. Xin and C. W. Tu, Appl. Phys. Lett.76,1267 (2000);77,
2180 (2000).
[44] E. Laureto, E. A. Meneses, W. Carvalho Jr, A. A. Bernussi, E. Ribeiro, E. C. F. da Silva, and J. B. B. de Oliveira, Braz. J. Phys.32, 314 (2002); complementary measurements of PL as a function of temperature and excitation intensity were ob-tained by us for the InGaP/GaAs system. These complementary measurements are not shown here.
[45] Q. Li, S. J. Xu, W. C. Cheng, M. H. Xie, and S. Y. Tong, Appl. Phys. Lett.79, 1810 (2001).
[46] Q. Li, S. J. Xu, M. H. Xie, and S. Y. Tong, J. Phys.: Condens. Matter17,4853 (2005).
[47] P. G. Eliseev, J. A. Phys.93, 5404 (2003). [48] R. P¨assler, Phys. Status. Solidi. 200, 155 (1997).
[49] Z. Y. Xu, Z. D. Lu, Z. L. Yuan, X. P. Yang, B. Z. Zheng, J. Z. Xu, W. K. Ge, Y. Wang, J. Wang, L. L. Chang, Superlattice and Microstruct,23, 381, (1998).
[50] R. Cingolani and K. Ploog, Adv. Phys.40, 535 (1991). [51] N. A. Poklonski and A. I. Siaglo, Phys. Solid. State,43, 157
(2001).
[52] S. A. Lourenc¸o, M. A. T. da Silva, I. F. L. Dias, J. L. Duarte, E. Laureto, A. A. Quivy, and T. E. Lamas, J. Appl. Phys.101, 113536 (2007).