AMTD
7, 7053–7084, 2014Comparison of continuous in-situ CO2 observations at
Jungfraujoch using two techniques
M. F. Schibig et al.
Title Page
Abstract Introduction
Conclusions References
Tables Figures
◭ ◮
◭ ◮
Back Close
Full Screen / Esc
Printer-friendly Version Interactive Discussion
Discussion
P
a
per
|
Discus
sion
P
a
per
|
Discussion
P
a
per
|
Discussion
P
a
per
|
Atmos. Meas. Tech. Discuss., 7, 7053–7084, 2014 www.atmos-meas-tech-discuss.net/7/7053/2014/ doi:10.5194/amtd-7-7053-2014
© Author(s) 2014. CC Attribution 3.0 License.
This discussion paper is/has been under review for the journal Atmospheric Measurement Techniques (AMT). Please refer to the corresponding final paper in AMT if available.
Comparison of continuous in-situ CO
2
observations at Jungfraujoch using two
di
ff
erent measurement techniques
M. F. Schibig1, M. Steinbacher2, B. Buchmann2, I. T. van der Laan-Luijkx1,*, S. van der Laan1,**, S. Ranjan***, and M. C. Leuenberger1
1
Climate and Environmental Physics, Physics Institute and Oeschger Centre for Climate Change Research, University of Bern, Bern, Switzerland
2
Swiss Federal Laboratories for Materials Science and Technology (Empa), Dübendorf, Switzerland
*
now at: Meteorology and Air Quality, Wageningen University, Wageningen, the Netherlands **
now at: Centre for Ocean and Atmospheric Sciences, School of Environmental Sciences, University of East Anglia, Norwich, UK
***
formerly at: Climate and Environmental Physics, Physics Institute and Oeschger Centre for Climate Change Research, University of Bern, Bern, Switzerland
Received: 30 May 2014 – Accepted: 11 June 2014 – Published: 16 July 2014
Correspondence to: M. C. Leuenberger ([email protected])
AMTD
7, 7053–7084, 2014Comparison of continuous in-situ CO2 observations at
Jungfraujoch using two techniques
M. F. Schibig et al.
Title Page
Abstract Introduction
Conclusions References
Tables Figures
◭ ◮
◭ ◮
Back Close
Full Screen / Esc
Printer-friendly Version Interactive Discussion
Discussion
P
a
per
|
Discus
sion
P
a
per
|
Discussion
P
a
per
|
Discussion
P
a
per
|
Abstract
Since 2004, atmospheric carbon dioxide (CO2) is measured at the High Altitude
Re-search Station Jungfraujoch by the division of Climate and Environmental Physics at the University of Bern (KUP) using a nondispersive infrared gas analyzer (NDIR) in combination with a paramagnetic O2 analyzer. In January 2010, CO2 measurements
5
based on cavity ring down spectroscopy (CRDS) as part of the Swiss National Air Pollution Monitoring Network have been added by the Swiss Federal Laboratories for Materials Science and Technology (Empa). To ensure a smooth transition – a prereq-uisite when merging two datasets e.g. for trend determinations – the two measurement systems run in parallel for several years. Such a long-term intercomparison also allows
10
identifying potential offsets between the two datasets and getting information about the compatibility of the two systems on different time scales.
A good agreement of the seasonality as well as for the short-term variations was observed and to a lesser extent for trend calculations mainly due to the short common period. However, the comparison revealed some issues related to the stability of the
15
calibration gases of the KUP system and their assigned CO2mole fraction. It was pos-sible to adapt an improved calibration strategy based on standard gas determinations, which lead to better agreement between the two data sets. By excluding periods with technical problems and bad calibration gas cylinders, the average hourly difference (CRDS−NDIR) of the two systems is −0.03 ppm±0.25 ppm. Although the difference
20
of the two datasets is in line with the compatibility goal of±0.1 ppm of the World Meteo-rological Organization (WMO), the standard deviation is still too high. A significant part of this uncertainty originates from the necessity to switch the KUP system frequently (every 12 min) for 6 min from ambient air to a working gas in order to correct short-term variations of the O2measurement system. Allowing additionally for signal stabilization
25
AMTD
7, 7053–7084, 2014Comparison of continuous in-situ CO2 observations at
Jungfraujoch using two techniques
M. F. Schibig et al.
Title Page
Abstract Introduction
Conclusions References
Tables Figures
◭ ◮
◭ ◮
Back Close
Full Screen / Esc
Printer-friendly Version Interactive Discussion
Discussion
P
a
per
|
Discus
sion
P
a
per
|
Discussion
P
a
per
|
Discussion
P
a
per
|
different internal volumes and flow rates between the two systems may affect observed differences.
1 Introduction
Carbon dioxide (CO2) is an important greenhouse gas which plays a major role for the radiative forcing of the atmosphere and therefore contributes significantly to the
green-5
house effect (Arrhenius, 1896). Since natural as well as anthropogenic processes alter the mole fraction of CO2 in the atmosphere, it is important to survey the mole fraction changes for a long time period to understand these processes and draw conclusions about the involved CO2 fluxes (Ramonet et al., 2010; Schimel et al., 2001).
Addition-ally, in-situ CO2measurements can be used in modeling studies as input parameters
10
or to verify model output (Uglietti et al., 2011; Chevallier et al., 2010; Peters et al., 2010). Therefore it is crucial that the datasets are well calibrated and are traced back to a common reference scale as well as that the measurement systems demonstrate a high precision and accuracy. This guarantees minimal biases between different mea-surement sites and laboratories and improves the compatibility of the datasets. For
15
CO2measurements the WMO recommends a compatibility of±0.1 ppm for the North-ern Hemisphere (WMO, 2011).
High altitude observatories such as the High Alpine Research Station Jungfraujoch (JFJ) are predestined to monitor the background mole fraction of trace gases like CO2 because they are mostly in the free troposphere.
20
That is why the division of Climate and Environmental Physics of the Physics Insti-tute, University of Bern (KUP) started measuring CO2 with a non-dispersive infrared
(NDIR) gas analyzer (Sick Maihak, Germany, model S710) embedded in a combined CO2/O2 analyzing system at JFJ in late 2004. At the beginning of 2010, a cavity ring
down spectrometer (until July 2011 a Picarro Inc., USA, model G1301, afterwards a
Pi-25
AMTD
7, 7053–7084, 2014Comparison of continuous in-situ CO2 observations at
Jungfraujoch using two techniques
M. F. Schibig et al.
Title Page
Abstract Introduction
Conclusions References
Tables Figures
◭ ◮
◭ ◮
Back Close
Full Screen / Esc
Printer-friendly Version Interactive Discussion
Discussion
P
a
per
|
Discus
sion
P
a
per
|
Discussion
P
a
per
|
Discussion
P
a
per
|
Monitoring Network (NABEL) enabling a long-term performance of CO2measurements at Jungfraujoch by Empa. To ensure that both records can be merged smoothly, it was decided to run both systems in parallel for a significant period, not only to detect poten-tial biases, but also to provide information about the compatibility of the two different measurement systems too, as it was done at other stations e.g at Mauna Loa (Komhyr
5
et al., 1989; Peterson et al., 1977). Because of the year-round manned infrastructure and excellent accessibility by train, it is possible to test the compatibility of the two systems in-situ under real conditions at a background site featuring only limited atmo-spheric variation.
In this study we report the data of the KUP and the Empa in-situ CO2measurement
10
system from January 2010 until December 2012.
2 Methods
2.1 Sampling site
The High Altitude Research Station Jungfraujoch (JFJ) is located 7◦59′20′′E, 46◦32′53′′N on the northern ridge of the Swiss Alps. The station itself is on a
moun-15
tain saddle between the mountains Mönch (4099 m a.s.l.) and Jungfrau (4158 m a.s.l.) at an altitude of 3580 m a.s.l.. Because of the high elevation the station is most of the time above the planetary boundary layer and receives predominantly air from the free troposphere. It is therefore an ideal location to measure atmospheric background air of continental Europe (Henne et al., 2010; Zellweger et al., 2003; Baltensperger et al.,
20
1997). Nevertheless, the station is sometimes influenced by polluted boundary layer air, especially during Föhn events (Zellweger et al., 2003) or during hot summer days, when air from the surrounding valley is thermally uplifted to Jungfraujoch (Zellweger et al., 2000; Baltensperger et al., 1997). A comprehensive in-situ measurement pro-gram with more than 70 trace gases and a large suite of aerosol properties is run
AMTD
7, 7053–7084, 2014Comparison of continuous in-situ CO2 observations at
Jungfraujoch using two techniques
M. F. Schibig et al.
Title Page
Abstract Introduction
Conclusions References
Tables Figures
◭ ◮
◭ ◮
Back Close
Full Screen / Esc
Printer-friendly Version Interactive Discussion
Discussion
P
a
per
|
Discus
sion
P
a
per
|
Discussion
P
a
per
|
Discussion
P
a
per
|
continuously at Jungfraujoch by an international consortium of research institutions. JFJ is also one of the currently 29 global GAW (Global Atmosphere Watch) stations.
2.2 NDIR measurements (KUP)
The KUP CO2 measurements base on a combined system to monitor CO2 and O2
changes in the atmosphere. The ambient air is entering through a strongly ventilated
5
(600 m3h−1) common inlet on the observatory’s roof to a manifold, which serves many air detectors, where an aliquot of it is drawn to the KUP system. The air is cryogenically dried to a dew point of−90◦C (FC-100D21, FTS systems, USA). Temperature as well as pressure is stabilized to avoid influences caused by ambient air density fluctuations. This allows the determination of CO2 by a NDIR spectrometer (Maihak S710) with
10
a frequency of 1 Hz and O2by a paramagnetic cell under highly controlled conditions. Measurements are done in a cyclic sequence of 18 h with each gas measured for 6 min with only the last 115 s of a six minute period used for mole fraction determination, to allow for signal stabilization after changing the sample source. At the beginning of each sequence, the system is calibrated with two reference gases (high and low span).
15
A working gas is measured between two ambient air measurements to correct for short term variations. Thus, an 18 h measurement sequence looks therefore as follows:
B – G – K – B – H – B – A – A – B – A – A – B – . . . – A – A – B
where B represents the working gas, G the high span CO2/low span O2, K the low span
CO2/high span O2, H the target cylinder and A represents ambient air.
20
All measurements ending in a particular hour are used for the calculation of hourly mean CO2observations, which in our case includes therefore 6 ambient observation
values per hour. Cylinder measurements (see Table 1) with a known mole fraction showed a precision better than 0.04 ppm for 1 h analysis. The CO2values are reported on the WMO X2007 scale. In February 2011, the Maihak analyzer was replaced with
25
AMTD
7, 7053–7084, 2014Comparison of continuous in-situ CO2 observations at
Jungfraujoch using two techniques
M. F. Schibig et al.
Title Page
Abstract Introduction
Conclusions References
Tables Figures
◭ ◮
◭ ◮
Back Close
Full Screen / Esc
Printer-friendly Version Interactive Discussion
Discussion
P
a
per
|
Discus
sion
P
a
per
|
Discussion
P
a
per
|
Discussion
P
a
per
|
2.3 Cavity ring down spectroscopy measurements (Empa)
From late December 2009 until July 2011 Empa was measuring CO2 with a
com-mercially available Wavelength-Scanned Cavity Ringdown Spectrometer (Picarro Inc., USA; G1301) coupled to a custom-built calibration/drying unit. Initially, the sample air from the manifold was dried prior to analysis by means of a Nafion dryer to a dew
5
point of<−30◦C. Along with CO2, the instrument also measures CH4and H2O in the
same sample frequency of approximately 0.5 Hz. The H2O measurements allow for correction of the CO2mole fraction in case of interferences (i.e. dilution and pressure
broadening) due to potential water moisture in the system. From August 2010 on, the Nafion dryer was short-cut, no water vapor removal was used anymore and CO2dry air
10
mole fractions were determined after application of an empirical humidity correction. After a system breakdown due to a faulty electronic board in July 2011, the G1301 analyzer was replaced in September 2011 by the newer G2401 model (Picarro Inc., USA) that is also capable to monitor CO mole fractions. Since then, the drying of the sample gas was again applied mainly due to beneficial effects with respect to the
pre-15
cision of the CO analysis. The water vapour correction functions for both instruments were determined by humidifying a dry reference gas by passing it over a water droplet in a coiled tubing (see Rella et al., 2013 for details).
Calibrations are performed every 46 h with two calibration gases (high and low span). In addition, a target gas is analyzed every 15 h to detect potential shorter term
instru-20
ment sensitivity changes. The mole fractions of the calibration gases were determined by the World Calibration Center for CH4, CO2, CO and O3 at Empa. Measurements of standard cylinders showed a precision better than 0.04 ppm for 15 min analysis (Ta-ble 1). Similar to the KUP, CO2 mole fractions are also reported on the WMO X2007
scale.
AMTD
7, 7053–7084, 2014Comparison of continuous in-situ CO2 observations at
Jungfraujoch using two techniques
M. F. Schibig et al.
Title Page
Abstract Introduction
Conclusions References
Tables Figures
◭ ◮
◭ ◮
Back Close
Full Screen / Esc
Printer-friendly Version Interactive Discussion
Discussion
P
a
per
|
Discus
sion
P
a
per
|
Discussion
P
a
per
|
Discussion
P
a
per
|
2.4 Calibration gases
The gases used to calibrate the KUP measurements are compressed outside air filled in steel cylinders delivered by Carbagas (Switzerland). Normally, each gas cylinder is first delivered to our laboratory at the University of Bern and measured for its CO2mole fraction andδO2/N2 andδAr/N2 values by mass spectrometry and a combined Licor
5
7000 NDIR and Oxzilla (Sable Systems, USA) system (CO2 and O2). The measured
values are calibrated with a sub-set of three standards from the WMO/GAW Central Calibration Laboratory (CCL) run by the National Oceanic and Atmosphere Adminis-tration (NOAA, Boulder, USA) and were used as assigned values of the KUP system at Jungfraujoch (see Table 2). The cylinders are shipped to Jungfraujoch and stored in
10
the basement until their usage as calibration gases. To maintain a stock of calibration gases at JFJ is necessary because the KUP system has to be calibrated frequently due to O2measurements (Uglietti, 2008) and has a rather high gas consumption of up to 150 mL min−1
.
The calibration gases used by Empa consist of compressed dry natural air in
alu-15
minum cylinders filled with a modified oil-free compressor (Rix Industries, USA) at Empa. The mole fractions of the gases are determined by the World Calibration Center for CH4, CO2, CO and O3at Empa through comparison with a suite of standards from
the WMO/GAW CCL (see Table 3). After measuring the calibration gases, the cylinders are shipped to JFJ.
20
AMTD
7, 7053–7084, 2014Comparison of continuous in-situ CO2 observations at
Jungfraujoch using two techniques
M. F. Schibig et al.
Title Page
Abstract Introduction
Conclusions References
Tables Figures
◭ ◮
◭ ◮
Back Close
Full Screen / Esc
Printer-friendly Version Interactive Discussion
Discussion
P
a
per
|
Discus
sion
P
a
per
|
Discussion
P
a
per
|
Discussion
P
a
per
|
3 Results
3.1 Comparison of the two datasets
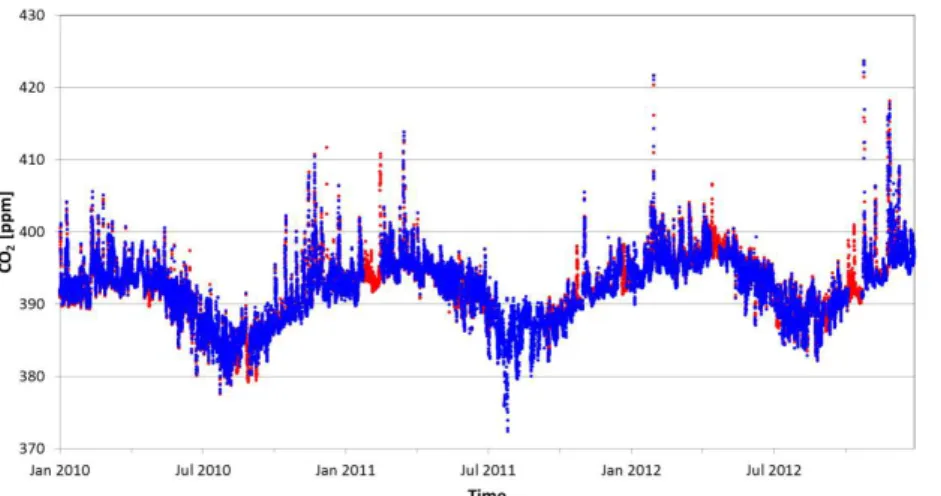
The CO2measurements of both systems for the period 2010–2012 are shown in Fig. 1. In general the two data sets show a good agreement. There are two longer gaps in the CRDS record during 11 June to 16 September 2011 and 5 to 18 January 2012.
5
The first gap was caused by technical problems of the Picarro and was replaced by a new 4 channel model. In January 2012 a hard disk failure was responsible for the roughly 2 week break. The NDIR data set shows four longer gaps during 31 January to 16 February 2011; 21 to 28 December 2011; 14 to 25 April 2012 and 7 to 24 Oc-tober 2012. The reasons for the gaps in the NDIR dataset were due to technical
is-10
sues with the Maihak analyzer, eventually leading to a replacement of the analyzer with an identical one. Furthermore, a power failure was responsible for failure of a gas flow controller and in April and October 2012 a dysfunction of the gas drying system. Throughout the record small gaps are also present due to e.g. system crashes, failures in the regulation of the gas flows etc. The remaining hourly mean values where we
15
have overlap for both systems (20 460 common hours) are in good agreement. The datasets show a similar seasonality as well as peaks caused by pollution events (e.g. advection of air masses from the Po basin in Italy or from Northeastern Europe).
The average seasonalitiy of the monthly mean values, spanning 36 months, are 10.01±0.33 ppm and 10.05±0.37 ppm for the CRDS and the NDIR data set,
re-20
spectively. Due do missing data one monthly value in each dataset had to be in-terpolated. For the complete datasets, the CRDS data show an annual increase of 1.89±0.01 ppm year−1whereas the NDIR data show a slope of 1.69±0.01 ppm year−1, the uncertainties correspond to the error of the linear increase fitted to the data. Select-ing only data points where both systems have overlappSelect-ing data points, the difference
25
AMTD
7, 7053–7084, 2014Comparison of continuous in-situ CO2 observations at
Jungfraujoch using two techniques
M. F. Schibig et al.
Title Page
Abstract Introduction
Conclusions References
Tables Figures
◭ ◮
◭ ◮
Back Close
Full Screen / Esc
Printer-friendly Version Interactive Discussion
Discussion
P
a
per
|
Discus
sion
P
a
per
|
Discussion
P
a
per
|
Discussion
P
a
per
|
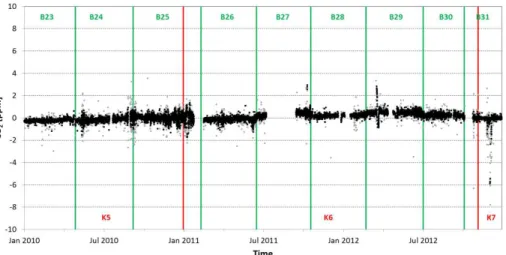
of 0.991 ppm/ppm, an intercept 3.662 ppm and aR2of 0.9909 (Fig. 2, grey points). It can be seen in Fig. 3 (grey points), that the differences of the two data sets are very stable over the three year period of the comparison. The average of the difference be-tween the CRDS dataset and the NDIR dataset is 0.04±0.40 ppm (Fig. 3, grey points), negative and positive differences equal out to almost zero. During periods of rapid CO2
5
changes, the standard deviation of the differences is larger than during stable periods and significantly exceeds the precision of both instruments. This point can be empha-sized by zooming in to higher resolution data (115 s averages). For this exercise, the high-resolution CRDS data were aggregated to 115 s averages corresponding to the averaging intervals of the NDIR system. There it can be clearly seen, that the difference
10
becomes noisier with fast changes (e.g. during the late afternoon in Figs. 4 and 5) and decreases again with more stable conditions (e.g. during the night time in Figs. 4 and 5).
The behavior of short-term variations is different for both systems as shown by a change of statistical characteristics when discarding values for which the change
15
rate is above a certain threshold (Table 4). These changes in system behavior are most probably due to different volumes and gas flows resulting in different residence times and leading to dispersion effects. For example the NDIR system uses a water trap with a large volume, potentially dampening the CO2 signal despite the high flow
rate, compared to the rather small Nafion dryer of the CRDS system. The cutoffcriteria
20
of the change rate was set to 0.75 ppm h−1, values with a higher change rate were dis-carded. Below 0.75 ppm h−1there is still an improvement of the agreement, but the loss in data points is too high. Additionally, the standard error starts to increase again below a change rate of 0.75 ppm h−1 because a lot of data points are omitted by this crite-ria. By setting the threshold to 0.75 ppm roughly 20 % of the common data points are
25
AMTD
7, 7053–7084, 2014Comparison of continuous in-situ CO2 observations at
Jungfraujoch using two techniques
M. F. Schibig et al.
Title Page
Abstract Introduction
Conclusions References
Tables Figures
◭ ◮
◭ ◮
Back Close
Full Screen / Esc
Printer-friendly Version Interactive Discussion
Discussion
P
a
per
|
Discus
sion
P
a
per
|
Discussion
P
a
per
|
Discussion
P
a
per
|
conditions (Fig. 3, black points), the average of the difference remains almost zero, namely 0.05 ppm±0.32 ppm.
However, there are problematic features worth mentioning. By replacing the working gas B26 with B27 and B28 with B29 (see Table 2) small shifts occurred, which are most likely caused by an inaccurate assignment of the CO2 values of the working gases
5
(Fig. 3). By excluding the periods of the cylinders B27 and B29 11038 common data points are remaining, the average of the differences, however, stays almost the same, namely−0.03 ppm but with reduced standard deviation of 0.25 ppm.
In late 2010, the difference between the two datasets increased significantly, be-cause of technical issues (see Sect. 3.1). After replacing the analyzer, the difference
10
was again very small and stable (Fig. 3). Furthermore, with the exchange of the Pi-carro in summer 2011, a small jump in the difference between the two systems oc-curred (Fig. 3). Since the replacement happened during a single working gas period of the KUP system (B27), the offset was probably caused by the change of the Picarro analyzer.
15
3.2 Drift of calibration gases and their corrections
In case of regular periodic calibrations, the pressure of a calibration gas cylinder de-creases relatively linearly considering a longer timescale than its decanting frequency. Because steel cylinders show pressure dependent adsorption and desorption effects of gases such as CO2 or H2O (Langmuir, 1918), CO2 continuously desorbs from the
20
cylinder walls and increases the CO2 mole fraction of the calibration gas during its usage. To avoid a large drift of the CO2 mole fraction in calibration gases, Keeling
et al. (1998) recommended using calibration gas cylinders only to a remaining pres-sure of 25 to 30 bar. The adsorption of CO2 to the cylinder wall can be calculated according to Langmuir (Langmuir, 1918) and corrected for by the formula:
25
WGcorr(t)=WGmeas(t)−
a
·b·p0
b·p0+1
− a·b·p(t) b·p(t)+1
AMTD
7, 7053–7084, 2014Comparison of continuous in-situ CO2 observations at
Jungfraujoch using two techniques
M. F. Schibig et al.
Title Page
Abstract Introduction
Conclusions References
Tables Figures
◭ ◮
◭ ◮
Back Close
Full Screen / Esc
Printer-friendly Version Interactive Discussion
Discussion
P
a
per
|
Discus
sion
P
a
per
|
Discussion
P
a
per
|
Discussion
P
a
per
|
where WGmeas corresponds to the measured CO2 value of the working gas [ppm], a and b are constants (related to the Avogadro constant, the number of elementary spaces of the surface, the molecular mass and the temperature),p0 is the start
pres-sure and p(t) is the pressure at the time of the measurement. This enrichment of CO2is more pronounced at lower pressures compared to high pressures as seen from
5
Eq. (1). For example at 100 bar cylinder pressure, the correction is only about 0.05 ppm, whereas at 30 bar it is already up to 0.3 ppm (witha=5 715 797 andb=568 897,aand bvalues were derived from measurements of cylinder B23). In steel cylinders, present water vapor would cause an even more pronounced desorption effect. However, all cylinders used here contained dry gas. In Leuenberger et al. (2014) an in-depth
discus-10
sion of this adsorption/desorption influence of gases on steel and aluminium cylinders is presented based on dedicated experimental results in our laboratory as well as in a climate chamber.
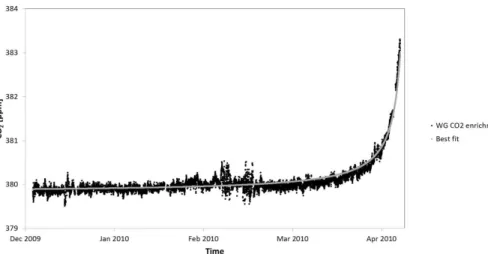
In April 2010, the working gas tank B23 run completely empty due to a faulty pressure reader and showed therefore such an enrichment effect. Hence the CO2values of the
15
NDIR calibrated with the uncorrected working gas are underestimated compared to the CRDS measurements. By recalculating the measurements of the working gas using only the low and the high span (Fig. 6, black points), it is possible to approximate the evolution of the working gas CO2 enrichment (Fig. 6, grey points) and correct for it
(Fig. 7). The NDIR data were in much better agreement with the CRDS measurements
20
after applying this correction. Comparing the uncorrected values of the B23 period to the corrected period, theR2of the NDIR values against the CRDS values is increased from 0.89 to 0.99 (Fig. 8). The remaining working gases cylinders were recalculated in the same manner, too. Most of them showed a similar behavior as B23, even when they were replaced at around 25 bar remaining pressure. The only difference was the
25
AMTD
7, 7053–7084, 2014Comparison of continuous in-situ CO2 observations at
Jungfraujoch using two techniques
M. F. Schibig et al.
Title Page
Abstract Introduction
Conclusions References
Tables Figures
◭ ◮
◭ ◮
Back Close
Full Screen / Esc
Printer-friendly Version Interactive Discussion
Discussion
P
a
per
|
Discus
sion
P
a
per
|
Discussion
P
a
per
|
Discussion
P
a
per
|
period. Although not preferred, this is possible because the pressure decreases linearly on long-term.
3.3 Polynomial correction of the NDIR Maihak measurements
NDIR spectrometers are nonlinear in response and hence require a correction of the data – generally of polynomial form. Ideally, the analyzer response function is
imple-5
mented by the producer, mostly for a restricted mole fraction range. This is also the case for the Maihak system. The Maihak measurements at JFJ are done in differential mode, hence the reference cell is always flushed with gas of known CO2mole fraction and compared to the cell containing the sample. To set the polynomial function to over-come the nonlinearity of the device, the mole fraction of the reference gas has to be
10
entered into the analyzer’s system.
In fall 2011, eleven used calibration gas cylinders of the KUP system were measured with the CRDS system and remeasured with the NDIR system. The remeasuring of these cylinders revealed that the polynomial function of the Maihak was insufficient. The second order polynomial of the difference between CRDS (Empa)−NDIR (KUP)
15
vs. CRDS (Empa) yielded aR2of 0.86. A very similar polynomial dependence is found between the assigned values NDIR (KUP) vs. assigned values according to Table 2, when discarding two cylinders with low remaining pressure (Table 1). We preferred the first polynomial because the cylinders might have faced already desorption effects due to changing pressure between the assignment measurement in Bern (>2 years before)
20
and the remeasurement at JFJ whereas the comparison with the CRDS took place within a few days. Since the cavity ring down technique is linear in the considered mole fraction range, the factors of the polynomial were used to correct the measurement values of the NDIR system removing this dependence completely (Fig. 9 and Table 1). The correction was only applied to the data measured by the NDIR analyzer actually
25
AMTD
7, 7053–7084, 2014Comparison of continuous in-situ CO2 observations at
Jungfraujoch using two techniques
M. F. Schibig et al.
Title Page
Abstract Introduction
Conclusions References
Tables Figures
◭ ◮
◭ ◮
Back Close
Full Screen / Esc
Printer-friendly Version Interactive Discussion
Discussion
P
a
per
|
Discus
sion
P
a
per
|
Discussion
P
a
per
|
Discussion
P
a
per
|
correct the data of the older NDIR analyzer properly, because at the time there were no comparable measurements with a nearly linear measurement system. However, values in the center of this span, where most of the ambient CO2mole fractions are measured,
should not be affected strongly, roughly 75 % of all NDIR values are affected less than 0.1 ppm by the polynomial correction. The accuracy of the standard measurements is
5
estimated to be 0.12 ppm over the working range from 350 ppm to 450 ppm based on the CRDS-NDIR comparison including both instrumental uncertainties.
4 Discussion
Long periods of overlapping measurements are helpful to assess the compatibility of different analyzers. In this study we analyzed two different data sets which were
mea-10
sured at the same station over three years (the simultaneous measurements are still ongoing) to determine the compatibility and quantify differences and biases. The com-patibility is challenging since the Empa uses the cavity ring down technique (Picarro Inc.) and the KUP a non-dispersive infrared spectrometer (Maihak) to measure the CO2 mole fraction of the air. Also the calibration procedure is, given by the two used
15
techniques, different and therefore has to be investigated.
The seasonality based on monthly measured averages (10.01±0.33 ppm and 10.05±0.37 ppm for the CRDS and the NDIR data set) between the two data sets agree nicely and are also in good agreement with results of flask measurements done at JFJ (10.54±0.18 ppm) (van der Laan-Luijkx et al., 2013). The trend calculation
20
(1.89 ppm year−1 and 1.69 ppm year−1) for the complete and the common data peri-ods deviate by 0.2 ppm year−1 which we mainly attribute to uncertainties in the as-signed values for the working gases. The annual CO2increase of the CRDS data set is in good agreement with the average global CO2trend of 1.97 ppm year−
1
for 2003– 2012 (Tans, 2014), whereas the NDIR trend is a bit too low. Nevertheless, is important
25
AMTD
7, 7053–7084, 2014Comparison of continuous in-situ CO2 observations at
Jungfraujoch using two techniques
M. F. Schibig et al.
Title Page
Abstract Introduction
Conclusions References
Tables Figures
◭ ◮
◭ ◮
Back Close
Full Screen / Esc
Printer-friendly Version Interactive Discussion
Discussion
P
a
per
|
Discus
sion
P
a
per
|
Discussion
P
a
per
|
Discussion
P
a
per
|
1.99 ppm year−1which is in much better agreement with the global trend of the same period of 2.03 ppm year−1(Tans, 2014).
Despite the fact that it is common knowledge to use well assigned standard cylinder values for accurate measurements, we found larger offsets for two calibration cylinders, namely B27 and B29 used by the KUP. Thereby the calculated CO2values of the KUP
5
data set are a bit too high for these two periods. This effect would have been unde-tected without the comparison measurements, at least for the B27 cylinder, since the offset is only around 0.2 ppm which is quite small compared to a seasonality of roughly 10 ppm and even more compared to the daily variations of up to 25 ppm in extreme cases. Experiences of ongoing international comparison on travelling cylinders
high-10
light similar issues (Zellweger et al., 2011). Therefore, a thorough check of assigned values of calibration and working cylinders is crucial.
Another problem concerning the calibration cylinders is their CO2mole fraction.
Ide-ally the low span is lowest in CO2mole fraction, the working gas intermediate,
prefer-ably close to the expected value of the specimen, and the high span accordingly
high-15
est. But in some periods (e.g. B26, B27, B29) the CO2 mole fraction of the working
gas was higher than the CO2mole fraction of the high span or it was very close to the
high span (e.g. B28) and therefore not ideal to calibrate the measurements with a very high accuracy. However, because of logistic problems these cylinders had to be used as working gases.
20
Also the stability of the CO2 mole fraction in the calibration cylinders is very im-portant. Adsorption/desorption effects occur when the pressure of steel cylinder drops under 20 to 30 bar (2 to 3 MPa) (Keeling et al., 1998), leading to an enrichment of CO2 in the cylinder and therefore to a CO2 value different from the assigned. Hence, cylinders shouldn’t be used until they are empty. A recalculation of the working gas
25
AMTD
7, 7053–7084, 2014Comparison of continuous in-situ CO2 observations at
Jungfraujoch using two techniques
M. F. Schibig et al.
Title Page
Abstract Introduction
Conclusions References
Tables Figures
◭ ◮
◭ ◮
Back Close
Full Screen / Esc
Printer-friendly Version Interactive Discussion
Discussion
P
a
per
|
Discus
sion
P
a
per
|
Discussion
P
a
per
|
Discussion
P
a
per
|
CO2 mole fraction of the calibration gas and the assigned value increases and thus leading to a worsening of the accuracy of the calculated CO2values.
By applying corrections mentioned above (see 3.2 and 3.3), discarding two periods of badly assigned working gases (B27 and B29) and excluding periods of fast CO2 changes, the average difference of the hourly values decreases to−0.03±0.25 ppm.
5
Whereas the average values of almost zero is very good, the standard deviation is still high in comparison to the WMO goal of 0.1 ppm and the precision of each individual system that is roughly five times better. The rather high standard deviation is probably caused by different averaging intervals of the hourly values, by dispersion of the air parcels in the two systems due to different volumes and flow rates of the air.
10
Both systems obtain the outside air from the same air inlet at Sphinx observatory at Jungfraujoch, but the air is led to the two systems by separate tubing. Due to different flow rates and volumes of the two systems, the origin of an air parcel measured at a certain time is not necessarily exactly the same. For example, the volume of the NDIR drying unit leads to a residence time of three minutes, significantly longer than
15
for the CRDS system. Therefore, the NDIR system records slightly dampened ambient signals. Furthermore, it is possible that the according air parcels are shifted a little bit and thereby leading to small differences of the CO2 values of the two systems.
This could be the reason for the observed larger differences between the two datasets during fast CO2mole fraction changes of the outside air.
20
Over all, the CO2 mole fraction measured by the two systems shows the same
pat-tern, not only during stable periods, but also during extreme events and even in the high resolution data. Most of the noisier periods can be accounted to specific techni-cal problems, whereas systematic shifts are most probably caused by badly assigned calibration gases or drifts of the CO2 mole fraction in the cylinders due to
adsorp-25
AMTD
7, 7053–7084, 2014Comparison of continuous in-situ CO2 observations at
Jungfraujoch using two techniques
M. F. Schibig et al.
Title Page
Abstract Introduction
Conclusions References
Tables Figures
◭ ◮
◭ ◮
Back Close
Full Screen / Esc
Printer-friendly Version Interactive Discussion
Discussion
P
a
per
|
Discus
sion
P
a
per
|
Discussion
P
a
per
|
Discussion
P
a
per
|
5 Conclusion
The CO2 data sets of two different CO2 measurement systems, a nondispersive
in-frared analyzer and a cavity ring down spectrometer, running parallel at the High Alti-tude Research Station Jungfraujoch were compared. The comparison showed, that the two systems are generally in good agreement, but revealed (i) adsorption/desorption
5
effects in the calibration gas steel cylinders used by NDIR system and (ii) insufficient nonlinearity correction of the NDIR analyzer (iii) periods of small biases because of badly assigned calibration gas cylinders. Adsorption effects can be correct for by mono-layer adsorption equation (Langmuir, 1918). Nonlinearity of the NDIR analyzer was constrained with a 2nd order polynomial, resulting in a better agreement between the
10
two data sets, in particular for values strongly deviating from the average. More re-search in adsorption/desorption effects of calibration gas cylinders has been done at the KUP and is reported in Leuenberger et al. (2014).
Finally, we like to emphasize that using steel cylinders is not adequate for high pre-cision trace gas determinations due to gas adsorption/desorption. Therefore, we
con-15
clude that all laboratories using steel cylinders for calibration purposes should switch to calibration gases stored in aluminium cylinders to minimize gas composition changes and to allow an improved assignment of the cylinder.
It is helpful to continue this comparison exercise for another couple of years to show that once aluminium cylinders are in use for both systems the compatibility will improve
20
further.
Acknowledgements. This work was financially supported by the Swiss National Science
Foun-dation (SNF-Project 200020_134641) and the Federal Office of Meteorology and Climatology
MeteoSwiss in the framework of Swiss GCOS. Empa’s CO2 measurements are part of the
Swiss National Air Pollution Monitoring network, a joint responsibility of Empa and the Swiss
25
Federal Office for the Environment. We like to thank the International Foundation High Altitude
AMTD
7, 7053–7084, 2014Comparison of continuous in-situ CO2 observations at
Jungfraujoch using two techniques
M. F. Schibig et al.
Title Page
Abstract Introduction
Conclusions References
Tables Figures
◭ ◮
◭ ◮
Back Close
Full Screen / Esc
Printer-friendly Version Interactive Discussion
Discussion
P
a
per
|
Discus
sion
P
a
per
|
Discussion
P
a
per
|
Discussion
P
a
per
|
for his precious work and help in maintaining and repairing the systems in the Laboratory in Bern and also at Jungfraujoch.
References
Arrhenius, S.: On the influence of carbonic acid in the air upon the temperature of the ground, Philosophical Magazine and Journal of Science, 5, 237–276, 1896.
5
Baltensperger, U., Gäggeler, H. W., Jost. D. T., Lugauer, M., Schwikowski, M., Weingartner, E., and Seibert, P.: Aerosol climatology at the high-alpine site Jungfraujoch, Switzerland, J. Geo-phys. Res., 102, 19707–19715, 1997.
Chevallier, F., Ciais, P., Conway, T. J., Aalto, T., Anderson, B. E., Bousquet, P., Brunke, E. G., Ciattaglia, L., Esaki, Y., Frohlich, M., Gomez, A., Gomez-Pelaez, A. J., Haszpra, L.,
Krum-10
mel, P. B., Langenfelds, R. L., Leuenberger, M., Machida, T., Maignan, F., Matsueda, H., Morgui, J. A., Mukai, H., Nakazawa, T., Peylin, P., Ramonet, M. Rivier, L., Sawa, Y.,
Schmidt, M., Steele, L. P. Vay, S. A., Vermeulen, A. T., Wofsy, S., and Worthy, D.: CO2
sur-face fluxes at grid point scale estimated from a global 21 year reanalysis of atmospheric measurements, J. Geophys. Res.-Atmos., 115, D21307, doi:10.1029/2010JD013887, 2010.
15
Heimann, M., Houghton, R. A., Melillo, J. M., Moore III, B., Murdiyarso, D., Noble, I.,
Pacala, S. W., Prentice, I. C., Raupach, M. R., Rayner, P. J., Scholes, R. J., Steffen, W. L., and
Wirth, C.: Recent patterns and mechanisms of carbon exchange by terrestrial ecosystems, Nature, 414, 169–172, 2001.
Henne, S., Brunner, D., Folini, D., Solberg, S., Klausen, J., and Buchmann, B.: Assessment of
20
parameters describing representativeness of air quality in-situ measurement sites, Atmos. Chem. Phys., 10, 3561–3581, doi:10.5194/acp-10-3561-2010, 2010.
IMECC: Infrastructure for Measurement of the European Carbon Cycle, MPG-Jena, Jena, Ger-many, 2007.
Keeling, R. F., Manning, A. C., and McEvoy, E. M.: Methods for measuring changes in
atmo-25
spheric O2concentration and their application in Southern Hemisphere air, J. Geophys. Res.,
103, 3381–3397, 1998.
AMTD
7, 7053–7084, 2014Comparison of continuous in-situ CO2 observations at
Jungfraujoch using two techniques
M. F. Schibig et al.
Title Page
Abstract Introduction
Conclusions References
Tables Figures
◭ ◮
◭ ◮
Back Close
Full Screen / Esc
Printer-friendly Version Interactive Discussion
Discussion
P
a
per
|
Discus
sion
P
a
per
|
Discussion
P
a
per
|
Discussion
P
a
per
|
measurements with a nondispersive infrared analyzer, 1974–1985, J. Geophys. Res., 94, 8553–8547, 1989.
Leuenberger, M. C., Schibig, M. F., and Nyfeler, P.: Gas adsorption and desorption effects on
cylinders influence long-term gas records, Atmos. Chem. Phys. Discuss., submitted, 2014. Peters, W., Krol, M. C., van der Werf, G. R., Houweling, S., Jones, C. D., Hughes, J.,
Schae-5
fer, K., Masarie, K. A., Jacobson, A. R., Miller, J. B., Cho, C. H., Ramonet, M., Schmidt, M., Ciattaglia, L., Apadula, F., Helta, D., Meinhardt, F., di Sarra, A. G., Piacentino, S., Sfer-lazzo, D., Aalto, T., Hatakka, J., Strom, J., Haszpra, L., Meijer, H. A. J., van der Laan, S., Neubert, R. E. M., Jordan, A., Rodo, X., Morgui, J. A., Vermeulen, A. T., Popa, E., Rozan-ski, K., Zimnoch, M., Manning, A. C., Leuenberger, M., Uglietti, C., Dolman, A. J., Ciais, P.,
10
Heimann, M., and Tans, P. P.: Seven years of recent European net terrestrial carbon diox-ide exchange constrained by atmospheric observations, Glob. Change Biol., 16, 1317–1337, 2010.
Peterson, J. T., Kohmyr, W. D., Harris, T. B., and Chin, J. F. S.: NOAA carbon dioxide measure-ments at Mauna Loa Obersvatory, 1974–1976, Geophys. Res. Lett., 4, 354–356, 1977.
15
Ramonet, M., Ciais, P., Aalto, T., Aulagnier, C., Chevallier, F., Cipriano, D., Conway, T. J., Haszpra, L., Kazan, V., Meinhardt, F., Paris, J. D., Schmidt, M., Simmonds, P.,
Xueref-Remy, I., and Necki, J. N.: A recent build-up of atmospheric CO2 over Europe. Part 1:
Ob-served signals and possible explanations, Tellus B, 62, 1–13, 2010.
Rella, C. W., Chen, H., Andrews, A. E., Filges, A., Gerbig, C., Hatakka, J., Karion, A.,
20
Miles, N. L., Richardson, S. J., Steinbacher, M., Sweeney, C., Wastine, B., and Zellweger, C.: High accuracy measurements of dry mole fractions of carbon dioxide and methane in humid air, Atmos. Meas. Tech., 6, 837–860, doi:10.5194/amt-6-837-2013, 2013.
Tans, P. P.: Annual Mean Global Carbon Dioxide Growth Rates, available at: http://www.esrl. noaa.gov/gmd/ccgg/trends/ (last access: 27 May 2014), 2014.
25
Schimel, D. S., House, J. I., Hibbard, K. A., Bousquet, P., Ciais, P., Peylin, P., Braswell, B. H., Apps, M. J., Baker, D., Bondeau, A., Canadell, J., Churkina, G., Cramer, W., Denning, A. S., Field, C. B., Friedlingstein, P., and Goodale, C.: Recent patterns and mechanisms of carbon exchange by terrestrial ecosystems, Nature, 414, 169–172, 2001.
Uglietti, C., Leuenberger, M. C., and Valentino, F. L.: Comparison between real time and flask
30
measurements of atmospheric O2and CO2performed at the High Altitude Research Station
AMTD
7, 7053–7084, 2014Comparison of continuous in-situ CO2 observations at
Jungfraujoch using two techniques
M. F. Schibig et al.
Title Page
Abstract Introduction
Conclusions References
Tables Figures
◭ ◮
◭ ◮
Back Close
Full Screen / Esc
Printer-friendly Version Interactive Discussion
Discussion
P
a
per
|
Discus
sion
P
a
per
|
Discussion
P
a
per
|
Discussion
P
a
per
|
Uglietti, C., Leuenberger, M., and Brunner, D.: European source and sink areas of CO2
re-trieved from Lagrangian transport model interpretation of combined O2and CO2
measure-ments at the high alpine research station Jungfraujoch, Atmos. Chem. Phys., 11, 8017–8036, doi:10.5194/acp-11-8017-2011, 2011.
van der Laan-Luijkx, I. T., van der Laan, S., Uglietti, C., Schibig, M. F., Neubert, R. E. M.,
Mei-5
jer, H. A. J., Brand, W. A., Jordan, A., Richter, J. M., Rothe, M., and Leuenberger, M. C.:
Atmospheric CO2, δ(O2/N2) andδ13CO2 measurements at Jungfraujoch, Switzerland:
re-sults from a flask sampling intercomparison program, Atmos. Meas. Tech., 6, 1805–1815, doi:10.5194/amt-6-1805-2013, 2013.
WMO: 15th WMO/IAEA Meeting of Experts on Carbon Dioxide, Other Greenhouse Gases
10
and Related Tracers Measurement Techniques, WMO Report No. 194, World Meteorolog-ical Organization, Research Department, Atmospheric Research and Environment Branch, Geneva, Switzerland, 2011.
Zellweger, C., Amman, M., Buchmann, B., Hofer, P., Lugauer, M., Rüttimann, R., Streit, N., Weingartner, E., and Baltensperger, U.: Summertime Noy speciation at the Jungfraujoch,
15
3580 m a.s.l., Switzerland, J. Geophys. Res., 105, 6655–6667, 2000.
Zellweger, C., Forrer, J., Hofer, P., Nyeki, S., Schwarzenbach, B., Weingartner, E., Ammann, M.,
and Baltensperger, U.: Partitioning of reactive nitrogen (NOy) and dependence on
me-teorological conditions in the lower free troposphere, Atmos. Chem. Phys., 3, 779–796, doi:10.5194/acp-3-779-2003, 2003.
20
AMTD
7, 7053–7084, 2014Comparison of continuous in-situ CO2 observations at
Jungfraujoch using two techniques
M. F. Schibig et al.
Title Page
Abstract Introduction
Conclusions References
Tables Figures
◭ ◮
◭ ◮
Back Close
Full Screen / Esc
Printer-friendly Version Interactive Discussion
Discussion
P
a
per
|
Discus
sion
P
a
per
|
Discussion
P
a
per
|
Discussion
P
a
per
|
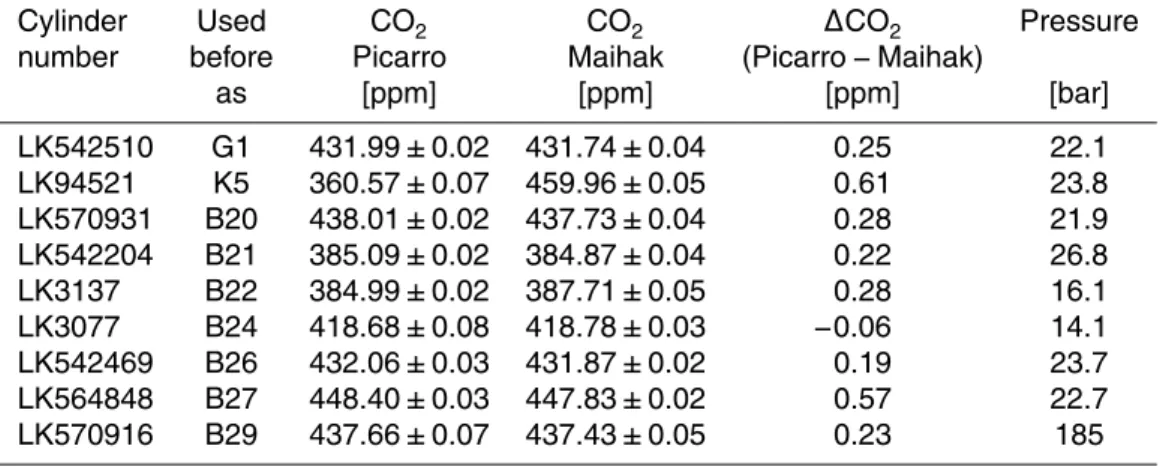
Table 1.KUP calibration cylinders and their measured CO2values on the NDIR and the CRDS system. These values were used to calculate the polynomial of second degree to correct the nonlinearity of the Maihak system (See also Fig. 9).
Cylinder Used CO2 CO2 ∆CO2 Pressure
number before Picarro Maihak (Picarro−Maihak)
as [ppm] [ppm] [ppm] [bar]
LK542510 G1 431.99±0.02 431.74±0.04 0.25 22.1
LK94521 K5 360.57±0.07 459.96±0.05 0.61 23.8
LK570931 B20 438.01±0.02 437.73±0.04 0.28 21.9
LK542204 B21 385.09±0.02 384.87±0.04 0.22 26.8
LK3137 B22 384.99±0.02 387.71±0.05 0.28 16.1
LK3077 B24 418.68±0.08 418.78±0.03 −0.06 14.1
LK542469 B26 432.06±0.03 431.87±0.02 0.19 23.7
LK564848 B27 448.40±0.03 447.83±0.02 0.57 22.7
AMTD
7, 7053–7084, 2014Comparison of continuous in-situ CO2 observations at
Jungfraujoch using two techniques
M. F. Schibig et al.
Title Page
Abstract Introduction
Conclusions References
Tables Figures
◭ ◮
◭ ◮
Back Close
Full Screen / Esc
Printer-friendly Version Interactive Discussion
Discussion
P
a
per
|
Discus
sion
P
a
per
|
Discussion
P
a
per
|
Discussion
P
a
per
|
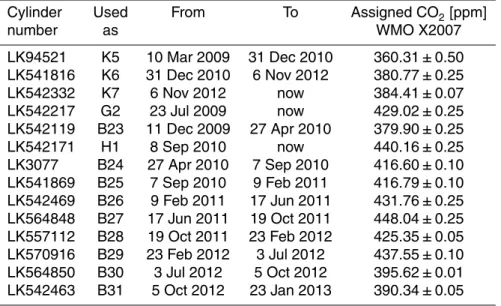
Table 2.List of calibration gas cylinders used by the NDIR system in the period 2010 to 2012, K, G, H and B corresponds to the usage as low span, high span, target and working gas, respectively.
Cylinder Used From To Assigned CO2[ppm]
number as WMO X2007
LK94521 K5 10 Mar 2009 31 Dec 2010 360.31±0.50
LK541816 K6 31 Dec 2010 6 Nov 2012 380.77±0.25
LK542332 K7 6 Nov 2012 now 384.41±0.07
LK542217 G2 23 Jul 2009 now 429.02±0.25
LK542119 B23 11 Dec 2009 27 Apr 2010 379.90±0.25
LK542171 H1 8 Sep 2010 now 440.16±0.25
LK3077 B24 27 Apr 2010 7 Sep 2010 416.60±0.10
LK541869 B25 7 Sep 2010 9 Feb 2011 416.79±0.10
LK542469 B26 9 Feb 2011 17 Jun 2011 431.76±0.25
LK564848 B27 17 Jun 2011 19 Oct 2011 448.04±0.25
LK557112 B28 19 Oct 2011 23 Feb 2012 425.35±0.05
LK570916 B29 23 Feb 2012 3 Jul 2012 437.55±0.10
LK564850 B30 3 Jul 2012 5 Oct 2012 395.62±0.01
AMTD
7, 7053–7084, 2014Comparison of continuous in-situ CO2 observations at
Jungfraujoch using two techniques
M. F. Schibig et al.
Title Page
Abstract Introduction
Conclusions References
Tables Figures
◭ ◮
◭ ◮
Back Close
Full Screen / Esc
Printer-friendly Version Interactive Discussion
Discussion
P
a
per
|
Discus
sion
P
a
per
|
Discussion
P
a
per
|
Discussion
P
a
per
|
Table 3.List of calibration gas cylinders used for the CRDS system in the period 2010 to 2012.
Cylinder number Used as From To Assigned CO2[ppm]
WMO X2007
D621867 (E062) Cal. Gas 1 18 Dec 2010 now 394.11±0.03
CA06290 (E063) Cal. Gas 2 18 Dec 2010 now 429.72±0.02
AMTD
7, 7053–7084, 2014Comparison of continuous in-situ CO2 observations at
Jungfraujoch using two techniques
M. F. Schibig et al.
Title Page
Abstract Introduction
Conclusions References
Tables Figures
◭ ◮
◭ ◮
Back Close
Full Screen / Esc
Printer-friendly Version Interactive Discussion
Discussion
P
a
per
|
Discus
sion
P
a
per
|
Discussion
P
a
per
|
Discussion
P
a
per
|
Table 4.The statistics of different cutoffcriteria of rapid CO2 mole fraction changes and their
influence on the number of points remaining, the average of the hourly differences of the NDIR
and the CRDS system, the standard deviation of the differences and the according standard
errors. The differences between the different cutoffcriteria are most probably caused by diff
er-ent volumes and flow rates of the systems and and thereby introduced small time lags. The measurement precision of each system is about ten times better than the standard deviation of
the differences.
Cutoff Number of Average of Standard Standard
criteria points differences deviation error
[ppm h−1
] [ppm] [ppm] [ppm]
All 19 779 0.038 0.401 0.0028
<2 19 260 0.044 0.363 0.0026
<1 17 474 0.049 0.336 0.0025
<0.75 16 094 0.053 0.322 0.0025
<0.5 13 602 0.056 0.312 0.0027
AMTD
7, 7053–7084, 2014Comparison of continuous in-situ CO2 observations at
Jungfraujoch using two techniques
M. F. Schibig et al.
Title Page
Abstract Introduction
Conclusions References
Tables Figures
◭ ◮
◭ ◮
Back Close
Full Screen / Esc
Printer-friendly Version Interactive Discussion
Discussion
P
a
per
|
Discus
sion
P
a
per
|
Discussion
P
a
per
|
Discussion
P
a
per
|
Figure 2.The hourly averages of the CRDS CO2 measurements vs. the hourly averages of
the NDIR CO2measurements (grey points) and the CRDS CO2measurements vs. the hourly
averages of the NDIR CO2measurements without periods of rapid mole fraction changes (black
points) over the whole period of comparison. The dashed diagonal represents the ideal 1 : 1
agreement. Considering all data points theR2is 0.9909 with a slope of 0.9908 ppm/ppm and an
intercept of 3.6623 ppm. By excluding periods with a rapid mole fraction changes the agreement
of the two datasets is slightly better with aR2 of 0.9924, a slope of 0.9961 ppm/ppm and an
AMTD
7, 7053–7084, 2014Comparison of continuous in-situ CO2 observations at
Jungfraujoch using two techniques
M. F. Schibig et al.
Title Page
Abstract Introduction
Conclusions References
Tables Figures
◭ ◮
◭ ◮
Back Close
Full Screen / Esc
Printer-friendly Version Interactive Discussion
Discussion
P
a
per
|
Discus
sion
P
a
per
|
Discussion
P
a
per
|
Discussion
P
a
per
|
Figure 3.The difference of the CRDS−NDIR CO2measurements of all common hourly data
points (grey points), and only during stable periods with a CO2change of less than 0.5 ppm h−1
AMTD
7, 7053–7084, 2014Comparison of continuous in-situ CO2 observations at
Jungfraujoch using two techniques
M. F. Schibig et al.
Title Page
Abstract Introduction
Conclusions References
Tables Figures
◭ ◮
◭ ◮
Back Close
Full Screen / Esc
Printer-friendly Version Interactive Discussion
Discussion
P
a
per
|
Discus
sion
P
a
per
|
Discussion
P
a
per
|
Discussion
P
a
per
|
‐6
‐4
‐2
0 2 4 6
375 380 385 390 395 400 405
07.06.2010 08.06.2010 09.06.2010 10.06.2010 11.06.2010 12.06.2010 13.06.2010 14.06.2010
Di
ff
e
ren
ce
CRD
S
‐
ND
IR
[ppm]
CO
2
[ppm]
Time
CRDS
NDIR
Difference
Figure 4.Time series of 115 s averages CO2 mole fractions measured with CRDS (red) and
NDIR (blue) at Jungfraujoch (left-handy axis scale) and difference between the two systems
AMTD
7, 7053–7084, 2014Comparison of continuous in-situ CO2 observations at
Jungfraujoch using two techniques
M. F. Schibig et al.
Title Page
Abstract Introduction
Conclusions References
Tables Figures
◭ ◮
◭ ◮
Back Close
Full Screen / Esc
Printer-friendly Version Interactive Discussion
Discussion
P
a
per
|
Discus
sion
P
a
per
|
Discussion
P
a
per
|
Discussion
P
a
per
|
‐6
‐4
‐2
0 2 4 6
390 395 400 405 410 415 420
15.03.2011 16.03.2011 17.03.2011 18.03.2011 19.03.2011 20.03.2011 21.03.2011 22.03.2011
D
iffe
ren
ce
CRD
S
‐
ND
IR
[ppm]
CO
2
[ppm
]
Time
CRDS
NDIR
Difference
Figure 5.Time series of 115 s averages CO2 mole fractions measured with CRDS (red) and
NDIR (blue) at Jungfraujoch (left-handy axis scale) and difference between the two systems
AMTD
7, 7053–7084, 2014Comparison of continuous in-situ CO2 observations at
Jungfraujoch using two techniques
M. F. Schibig et al.
Title Page
Abstract Introduction
Conclusions References
Tables Figures
◭ ◮
◭ ◮
Back Close
Full Screen / Esc
Printer-friendly Version Interactive Discussion
Discussion
P
a
per
|
Discus
sion
P
a
per
|
Discussion
P
a
per
|
Discussion
P
a
per
|
Figure 6. The CO2 values of the calibration gas cylinder B23 calculated by using only the low and the high span cylinders against time (black points) and the calculated best fit function
according to Langmuir (grey points) witha=5 715 797 andb=568 897. The CO2 values are
increasing with time (corresponding to decreasing pressure). The best fit function was used to
AMTD
7, 7053–7084, 2014Comparison of continuous in-situ CO2 observations at
Jungfraujoch using two techniques
M. F. Schibig et al.
Title Page
Abstract Introduction
Conclusions References
Tables Figures
◭ ◮
◭ ◮
Back Close
Full Screen / Esc
Printer-friendly Version Interactive Discussion
Discussion
P
a
per
|
Discus
sion
P
a
per
|
Discussion
P
a
per
|
Discussion
P
a
per
|
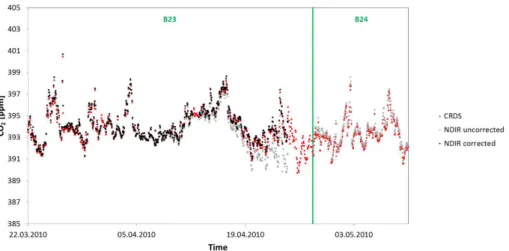
Figure 7.Time series of the CO2mole fractions determined with CRDS (red points) and NDIR
(uncorrected in grey, after correction in black). The desorption corrected NDIR CO2 values
show a much better agreement with the CRDS CO2 values than the uncorrected which are
towards the end of the B23 period severely underestimated. After replacement of the working
gas cylinder B23 with B24, the uncorrected NDIR CO2 values show a much better agreement
AMTD
7, 7053–7084, 2014Comparison of continuous in-situ CO2 observations at
Jungfraujoch using two techniques
M. F. Schibig et al.
Title Page
Abstract Introduction
Conclusions References
Tables Figures
◭ ◮
◭ ◮
Back Close
Full Screen / Esc
Printer-friendly Version Interactive Discussion
Discussion
P
a
per
|
Discus
sion
P
a
per
|
Discussion
P
a
per
|
Discussion
P
a
per
|
Figure 8.Correlation of ambient CO2 mole fraction measured by CRDS vs. the uncorrected
CO2mole fraction of the NDIR-instrument (grey points) and the desorption corrected CO2NDIR
mole fractions (black points), respectively during the period of the working gas cylinder B23.
The diagonal represents the ideal 1 : 1 agreement. Due to the CO2enrichment in the working
AMTD
7, 7053–7084, 2014Comparison of continuous in-situ CO2 observations at
Jungfraujoch using two techniques
M. F. Schibig et al.
Title Page
Abstract Introduction
Conclusions References
Tables Figures
◭ ◮
◭ ◮
Back Close
Full Screen / Esc
Printer-friendly Version Interactive Discussion
Discussion
P
a
per
|
Discus
sion
P
a
per
|
Discussion
P
a
per
|
Discussion
P
a
per
|
Figure 9.The difference of the CO2 values against the CRDS values of old KUP calibration cylinders. The data show a polynomial dependency (grey diamonds), by correcting the data
points with the according polynomial of second degree, the difference between the two