Annotation of Function Point Model over Size Estimation
Souvik Daw Avijit Das Parthasarathi paul
Sikkim Manipal Institute Birla Institute of Birla Institute of
of Technology Technology Technology
Sikkim Kolkata Kolkata
Email: souvik_1@ Email: avijit_das@
Email: parthasp2010
Yahoo.com
rediffmail.com
@gmail.com
Abstract
In this era software, whether system software or application software is raised up as an indispensible division of any sector- manufacturing, government, education etc. With the growing intricacy of the system and in accordance to increasing user’s requirements, consequently the dimension of any software development project is inclining upwardly. Software estimation is the key of entire software development project, and the proper estimation immediately affects the completion of project with less hindrance. Accurate estimation of the problem size is fundamental to satisfactory estimation of effort, time duration and cost of a software project. In this paper based on the empirical results obtained from rigorous analysis and experiment carried out on some projects, provides an annotate that software project estimation by using the technique of Function Point Model more or less give standard estimation of software project size and less time needed to estimate rather than estimating the software project based on size estimation i.e. Line of Code (LOC).
Keywords: Software Engineering, Function Point Model, Line of Code, Software Project Estimation.
1. Introduction
Systems persisting to expand in size and with this the complexity is also growing up, becoming increasingly difficult to understand and tackle. As improvements in coding tools and availability of sophisticated compiler allow software developers to produce larger amounts of application software and system software to meet ever-expanding user requirements, a method to understand and communicate size must be used
.
More over the costSometimes it is apparent in the field of industry or research, the scenario is that, still a dilemma exists between the acquisitions of the so known two metrics i.e. Line of Code or Function Point. Many theories, research works, experimental works are put forwarded by industry specialist, research worker regarding the differences of using Function Point Model and Line of Code for estimation. Though it is obvious that much of the theories have putted a star marks on betterment of Function Point Analysis for problem size estimation over the Line of Code, in this paper based on the results obtained from the analysis and experiment which are carried on some of the ongoing software development projects, gives a differences that arises between estimation of size using the two metrics and the annotation of superiority of Function Point over Line of Code. The first part of the paper provides an insight view to Line of Code and Function Point and the literature differences between the two stated metrics. Second part of the paper as the work concerned will contains the discussion of approach and implementation of the experiment performed. Lastly the analysis section is containing the discussion of results that came out while carrying the experiment.
2. LOC
–
A Discussion
Line of Code (LOC) is the simplest among all metrics available to estimate project size. This metric is very popular because it is the simplest to use. It is a software metric used to measure the amount of code in a software program. LOC is typically used to estimate the amount of effort that will be required to develop a program, as well as to estimate productivity once the software is produced. In other words using this metric, the project size is estimated by counting the number of source instructions. Obviously, while counting the number of source instructions, lines used for commenting the code and the header lines should be ignored [4]. In some cases comment line and blank lines are also counted. There are two types of LOC count: Physical LOC and Logical LOC. Physical LOC is a count of "non-blank, non-comment lines" in the text of the program's source code. Logical LOC measures attempt to measure the number of "statements", but their specific definitions are tied to specific computer languages (one simple logical LOC measure for C-like languages is the number of statement-terminating semicolons) [6]. But LOC measures are often stated without giving their definition, and logical LOC can often be significantly different from physical LOC. Determining the LOC count at the end of a project is a very simplest method. However, accurate estimation of the LOC count at the beginning of a
project is very difficult [4]. To estimate the software project problem size before the beginning of software product development phase, which is obvious because it may be used as a parameter to estimate other metrics such as man power required to develop the project which is very much needed before the project development started and also other metrics can be determined by taking project size as a parameter. In this case, in order to estimate the LOC count at the beginning of a project, firstly the projects that are to be developed are studied and analyzed carefully and based on the analysis the project are divided into modules. Usually the problems are divided into modules and each module into sub modules and so on until the sizes of the different leaf-level modules can be approximately predicted. By using the estimation of the lowest level modules, and combining all the modules, arrive at the total size estimation of the software project. For this the past experiences for developing more or less similar product will be helpful.
There are several cost, schedule, and effort estimation models which use LOC as an input parameter, including the widely-used Constructive Cost Model
(COCOMO) series of models invented by Dr. Barry Boehm. While these models have shown good predictive power, they are only as good as the estimates (particularly the LOC estimates) fed to them [6].
3. Function Point
–
A Detail View
It is a usual practice, before finding the solutions of any complex problem regarding any field, the problem is tried to break into smaller component or can be said the solutions of a given problem are made by solving the problem step by step. Problems that may initially appear to be difficult are found to be simple when dissected into their components, or classes
.
When the objects to be classified are the contents of software systems, a set of definitions and rules, or a scheme of classification, must be used to place these objects into their appropriate categories. Function point analysis is one such technique: FPA is a method to break systems into smaller components, so they can be better understood and analyzed [5]. Function points are a unit measure for software much like an hour is to measuring time, miles are to measuring distance or Celsius is to measuring temperature. Function Points are interval measures much like other measures such as kilometers, Fahrenheit; hours so on and so forth.based on the requirements and logical design [6]. The basic theory behind the function point metric is that the size of any software product is proportional to the number of various functions that it supports. For example 1 Function Point = 300 (approx) Line of Code of Assembler, for 2 Function Point = 600 (approx) Line of Code of Assembler. A software product having numerous features would naturally be larger in size than a product with fewer features. Each function when invoked reads some input data and transforms it to the corresponding output data. Suppose the search room feature of a Hotel Management Software takes the room no. and date as an input and accordingly it gives the output of availability or non-availability of that room on a particular date. Thus, a computation of the number of input and the output data values to a system gives some indication of the number of functions supported by the system.
3.1 Function Point Count – Types and Steps
Before stepping through the Function Point Counting process, the types of Function Point Count should be recognized and known of any software project. Function Point Counts can be associated with either projects or applications. It is very much known that the software projects can be divided into three types: Software Development, Software Enhancement, and Software Maintenance. In accordance with these types of function points there are three different types of function point counts: Development Project Function Point Count-Function Points can be counted at all phases of a development project from requirements up to and including implementation. This type of count is associated with new development work; Enhancement Project Function Point Count- It is common to enhance software after it has been placed into production. This type of function point count tries to size enhancement projects; Application Function Point Count- Application counts are done on existing production applications [5].There are 5 components of Function Point Analysis which capture the functionality of the application: External Inputs (EI), External Outputs (EO), External Inquiries (EQ), Internal Logical Files (ILF) and External Interface Files (EIF). First three are called Transactional Function Types and last two Data Function Types. The ultimate aim is to find out the adjusted function point count and for this numerous steps are needed to be accompanied. Function Point Analysis consists of the following steps:
1. Determine the type of Function Point count 2. Determine the application boundary
3. Identify and rate transactional function types to calculate their contribution to the Unadjusted Function Point count (UFP) 4. Identify and rate the data function types to
calculate their contribution to the UFP 5. Determine the Value Adjustment Factor
(VAF) by using General System Characteristics (GSCs)
6. Finally, calculate the adjusted Function Point count.
3.2 External Input
External Input is an elementary process in which data crosses the boundary from outside to inside. This data may come from a data input screen or another application. The data may be used to maintain one or more internal logical files. The data can be either control information or business information.
3.3 External Output
External Output is an elementary process in which derived data passes across the boundary from inside to outside. Additionally, an EO may update an internal logical file. The data creates reports or output files sent to other applications. These reports and files are created from information contained in one or more internal logical files and external interface files.
3.4 External Inquiry
External Inquiry is an elementary process with both input and output components that results in data retrieval from one or more internal logical files and external interface files. The input process does not update or maintain any FTRs (Internal Logical Files or External Interface Files) and the output side does not contain derived data.
3.5 Internal Logical File
Internal Logical File is a user identifiable group of logically related data that resides entirely within the application boundary and is maintained through External Inputs. Even though it is not a rule, at least one external output and/or external inquiry should include the ILF as an FTR.
3.6 External Interface File
application boundary and is maintained by external inputs of another application.
3.7 Rating the Transactional and Data Function Types
Each of the identified components is assigned a rating (as Low, Average, and High). Transactional Function Types are given the rating depending upon the number of Data Element Types (DET), File Types Referenced (FTR) associated with them. Data Function Types are assigned ratings based on the number of Data Element Types (DET), and Record Element Types (RET) associated.
The total number of EI, EO, EQ, ILF, and EIF while applying the weights corresponding to the ratings i.e. Low, Average, and High will give the Unadjusted Function Point count (UFP).
3.8 General System Characteristics
The value adjustment factor (VAF) is calculated based on 14 General System Characteristics. The General System Characteristics are: Data communications, Distributed data processing, Performance, Heavily used configuration, Transaction rate, On-line data entry, End-user efficiency, On-line update, Complex processing, Reusability, Installation ease, Operational ease, Multiple sites, and Facilitate change. The degree of influence of each characteristic has to be determined as a rating on a scale of 0 to 5 as defined below.
0: Not present, or no influence 1: Incidental influence 2: Moderate influence 3: Average influence 4: Significant influence 5: Strong influence throughout
Once all the GSCs have been rated, Total Degrees of Influence (TDI) is obtained by adding all the ratings. Value Adjustment Factor is calculated using the formula: VAF = 0.65 + TDI/100.
3.9 Resultant Function Point Count
While getting the Unadjusted Function Point count (UFP) out of transactional and data function types, and calculating the Value Adjustment Factor (VAF) by rating the general system characteristics, the resultant Function Point count can be calculated by: FP = Unadjusted Function Point count (UFP) * Value Adjustment Factor (VAF)
4. Approach
Still now we have discussed how the industry calculates the size of software by adopting the technique i.e. either LOC or Function Point Analysis. And it is known from theoretical and practical points that Function Point Analysis is better than Line of Code. But in this work taking the assumption of isolation of knowing the superiority of Function Point over Line of code, the implementation and analysis is carried on and accordingly which is better will be known. The data and relevant information of some software projects which is desktop application software are taken for experiment. Based on those desktop applications software projects each form of particular software is taken and categories are made accordingly namely: Simple Form, Intermediate Form, and Complex Form. For function point estimation, the forms which will come under the above mentioned any of the categories are made by determining the number of components each form bearing.
Table 1. Categories for FP estimation
Forms Simple Intermediate Complex
No. of
Components
X ≤ 5 5 < X ≤ 10 X > 10
Form the above table; X denotes the number of component of a form of particular software. If the number of components of a form of particular software is less than equal 5, the form is simple. If it is less than equal 10, the form is intermediate else the form is complex. The process is continued for each of the form of particular software. The resultant will be the number of components of a form, category of a form and the total number of components of particular software. Taking the number of components of software, assigning weight to a form according to the category and based on function point analysis method the size is estimated.
number of lines of code of a form of particular software. If Y is less than equal to 200 LOC in case of physical count and 250 in case of logical count then the form is simple. If the number of lines of code of a form is less than equal to 250 (physical) and 300 (logical), it will come under the intermediate form; otherwise the form will be known as complex form. Similarly like FP estimation, in case of LOC estimation the process will be implemented for each form of particular software. Lastly after the process is implemented for each form the output will be as the
Table 2. Categories for LOC estimation
Forms Simple Intermediate Complex
No. of LOC (physical)
Y ≤ 200 Y ≤ 250 Y > 250
No. of LOC (Logical)
Y ≤ 250 Y ≤ 300 Y > 300
number of LOC of a form, category of form and total number of LOC of particular software. While knowing the total number of LOC of software the size is determined.
5. Implementation
As stated above the implementation is carried on some desktop application software projects. The algorithm designed for function point estimation of a software size is by applying the method named as open and close estimation. Firstly in open estimation method the form of particular software will be open up through OpenForm (Form F) and choose component method will be called which will work as determining and analysis the components, the form contains. While determining the components, the close estimate method will return the number of components that are in a particular form of that software. Whereas read estimate method will give category of a form according to the number of components it contains. Lastly the total component method after the completion of all methods will give the output of total number of components the software is having. Accordingly with these outputs based on Function Point model the size of the software is determined.
Open_Estimate_FP ( )
{
OpenForm ( Form F ) {
choose_component ( ) # Command Button # Flex Grid # Radio Button # Check Box # ……….. # ……….. ………… }
}
int Close_Estimate_FP ( ) {
return no._of_component; }
Read_Estimate_FP ( ) {
select (no._of_component) {
case SF: Simple_Form ( ) return category; case IF: Intermediate_Form ( ) return category; case CF: Complex_Form ( ) return category; }
Total_Component ( ); }
To estimate the software size estimation based on LOC the open_estimate_LOC will be executed through which the Open Form method will be called and a form of particular software will be open up. Whereas through LOC Type method there will be a choice between the types of LOC count i.e. Physical LOC or Logical LOC. In case of physical LOC count only the source lines will be counted whereas for logical LOC count the counting will be done on all source lines and comment lines. Similarly while determining the types of LOC count the close estimate method will return the number of lines of code that are in a particular form of that software. Lastly read estimate method will show the category of a form according to the number of line of code it contains and the total LOC method will provide the output of total number of line of code of the software. With these outputs based on LOC estimation the size of the software is determined
Open_Estimate_LOC ( ) {
{
LOC_Type ( ) # Physical # Logical }
}
int Close_Estimate_LOC ( ) {
return no._of_loc ; }
Read_Estimate_LOC ( ) {
select ( no._of_loc) {
case SF: Simple_Form ( ) return category; case IF: Intermediate_Form ( ) return category; case CF: Complex_Form ( ) return category }
Total_LOC ( ); }
6. Analysis
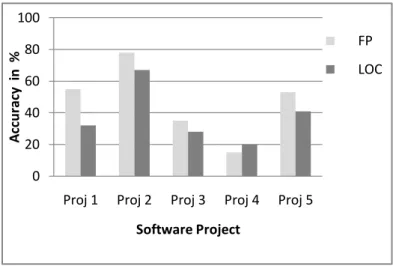
As mentioned before the work concerned in this paper is to know which size estimation technique provides satisfactory results i.e. the FP method or the LOC method and for validation of the work some of the data and information of software projects of desktop applications are chosen. On the simultaneous implementation of the two works designed, the results generated are studied and compared. According to the outputs, the points that are notified are, firstly, the estimation on function point method acquire the characteristics of more accuracy than the size estimation based on lines of code (LOC). The graph in figure 1 shows and compares the accuracy results. In the figure the horizontal axis shows the different project which is taken for estimation and vertical axis gives the accuracy in percentage of estimation based on the algorithm designed. We denote the software projects which are taken for implementation as proj1, proj2, proj3, proj4, proj5 since we selected 5 projects for estimation purpose. Now from the graph in case of proj1 when both the algorithm are run simultaneously the results shows that the FP method algorithm gives 55% accuracy of size estimation where as the LOC method algorithm gives 32 % accuracy of size estimation. For proj2 the FP based algorithm shows 78% accuracy and LOC based algorithm gives 67% accuracy. Similarly in case of proj3 and proj5 function point method gives
more accurate size estimation of software rather than lines of code based estimation though the percentage of accuracy are different. But if we look for proj4 there we can see that LOC method posses the characteristics of accuracy than FP method though the percentage of accuracy is much less as compare to other results i.e. 15% in case of FP method and 20% in case of LOC method.
Fig 1. Estimation Results
Secondly another point is notified that the time required for implementation of FP method based software size estimation is minimum than the time required for implementation of LOC method based software size estimation.
7. Conclusion
Before the work is implemented the assumption is made that the isolation of knowing the superiority of Function Point over Line of code and accordingly the work is carried on, analyzed and designed so to get the result of knowing which method will be sophisticated and efficient i.e. Function Point Analysis or Line of Code (LOC) for software size estimation. But as for the result and analysis presented in this work once again concluded that function point size estimation method is efficient than LOC size estimation method. In this work two algorithms are designed i.e. one for function point method another for LOC method, and implementation are made simultaneously on some of the software project which are desktop application software. After implementing the two algorithms the results came out are studied and compared, accordingly which states that the function point analysis based estimation of software is more
0 20 40 60 80 100
Proj 1 Proj 2 Proj 3 Proj 4 Proj 5
A
cc
u
ra
cy
i
n
%
Software Project
FP
accurate than the Line of Code (LOC) based size estimation of software.
Accurately predicting the size of software has always troubled the software industry over the years. The work presented in this paper and by removing the assumption we, made gives the point of reasons of becoming the Function Points a widely accepted as the standard metric for measuring software size. Function Points have made adequate software size estimation possible. Lastly it can be stated that understanding software size is the key to understanding both productivity and quality. Without a reliable sizing metric, relative changes in productivity or relative changes in quality cannot be calculated.
8. References
[1] M. A. Al-Hajri, A. A. A. Ghani, M. S. Sulaiman, M. H. Selamat. “Modification of standard Function Point complexity weights system”. Journal of Systems and Software, 2005, vol. 74, pp. 195-206. [2] C. J. Lokan. “An empirical analysis of function point adjustment factors”. Information and Software Technology, 2000, vol. 42, pp. 649-659.
[3] FU Ya-fang, LIU Xiao-dong, YANG Ren-nong, DU Yi-lin, LI Yan-jie. “A Software Size Estimation Method Based on Improved FPA”. Second WRI World Congress on Software Engineering, 2010 [4] Rajib Mall, “Software-Engineering”, Version 2 CSE IIT, Karagpur.