*e-mail: [email protected]
Materials Produced from Plant Biomass.
Part I: Evaluation of Thermal Stability and Pyrolysis of Wood
Matheus Poletto, Juliane Dettenborn, Vinícios Pistor, Mara Zeni, Ademir José Zattera*
Laboratory of Polymers – LPOL, Center of Exact Sciences and Technology – CCET,
Caxias do Sul University – UCS, Caxias do Sul, RS, Brazil
Received: March 7, 2010; Revised: June 12, 2010
This paper compares the thermal stability of the sawdust of different wood species, an important factor in producing reinforced polymers. The compositions of two wood species, Pinus taeda and Eucalyptus grandis,
were determined to evaluate the influence of the main wood components on the thermal stability of this material. The two species were submitted to thermogravimetric analysis at different heating rates to calculate the activation energy (Ea) using the Flynn-Wall-Ozawa (FWO) and Kissinger methods. The results suggest that larger quantities
of holocellulose and lignin associated with lower extractive contents give the wood greater thermal stability. The
Ea values calculated for the two species were in the range of 146-165 kJ.mol-1. Evaluation of the activation energy
values offers a simplified means to better understand the thermal decomposition of the sawdust of different wood species used in developing composites.
Keywords: lignocellulosic materials, thermal analysis, thermal stability, apparent activation energy
1. Introduction
The use of plant biomass materials, such as wood chips and sawdust, to reinforce thermoplastic polymers has gradually increased in recent years1,2. These materials are biodegradable, are obtained
from renewable sources, and have low density and high mechanical properties compared to glass fiber1,2. However, they present
limitations, such as low thermal stability and absorption of humidity3.
The thermal stability of wood is an important parameter for the production of reinforced polymers. Wood is used as an added load and improves the mechanical resistance of polymers that are processed at temperatures close to 200 °C[3]. The degradation of wood due to
high temperatures at the time of processing may lead to undesirable properties, such as odor and discoloring, along with a reduction in mechanical properties3. The main chemical components of wood are
cellulose, hemicellulose and lignin. Generally, the thermal degradation of wood involves a number of complex reactions3,4. At heating rates
below 100 °C/min there are four stages in the thermal decomposition of wood: evaporation of the water present; volatilization of the extractives; decomposition of the hemicelluloses; and subsequent decomposition of cellulose, while lignin is decomposed more slowly within a greater temperature range4. Cellulose presents crystallinity
which makes it more thermally stable. Hemicellulose and lignin, on the other hand, are amorphous and their degradation begins at lower temperatures than in the case of cellulose4. Thermogravimetric
analysis (TGA) is one of the most widely used techniques to evaluate the thermal decomposition of materials. The kinetic parameters of degradation such as activation energy (Ea) can be determined using
this technique. These parameters can be determined experimentally, isothermally, with time variation5, or varying the heating rate (φ).
This latter method is known as non-isothermal and is generally used to measure mass loss as a function of temperature6. Examples of
non-isothermal techniques commonly used to determine Ea are the
Kissinger method7, which assumes a maximum rate of conversion,
and the methods proposed by Avrami8,9, Ozawa10, and Flynn and
Wall11 which are based on the isoconversion method. Knowledge of
the kinetic parameters associated with the thermal properties is an
important factor in estimating the thermal behavior of the polymers and composites12. Wu and Dollimore13 studied the thermal degradation
of several wood species at 200 to 650 °C using thermogravimetric analysis (TGA) and differential thermogravimetric analysis (DTGA) in an inert atmosphere. They obtained activation energy values varying from 160 to 180 kJ.mol-1, using the method proposed by Arrhenius6,11.
D’Almeida et al.14, evaluating the thermal behavior of lignocellulosic
fibers, obtained activation energies between 135 and 199 kJ.mol-1
through the method proposed by Kissinger. The objective of this study is to investigate the thermal decomposition process of two different wood species and determine their activation energies with thermogravimetry using the methods proposed by Flynn-Wall-Ozawa (FWO)10,11 and by Kissinger7.
2. Experimental
2.1. Materials
The wood samples used in this study were obtained from wastes of the lumber industry in the northeast of the state of Rio Grande do Sul, Brazil. The species were Pinus taeda (P. taeda) and Eucalyptus
grandis (E. grandis), which are also widely used to produce
cellulose. The pine woods are known as softwoods (gymnosperms) and eucalyptus woods as hardwoods (angiosperms), because of the difference in their cell composition. The wastes were characterized by granulometric analysis using Tyler series sieves15. Samples with
a particle size between 0.841-0.595 mm were used to perform the thermogravimetric analysis.
The basic constituents of the wood samples were determined according to the Klason method16, following the TAPPI Test Method
T222 om-02 standard17, in triplicate, on dry samples kept in an oven
heating rates according to Equation 8, with the peak temperature (Tp)
obtained from the peak of the DTGA curve, and is valid for first-order reactions. The activation energy is calculated from the slope of the straight line obtained.
ln(φ ) ln T
AR
E T
E R
p a p
a 2 1 = + −
(8)
3. Results and Discussion
3.1. Chemical composition of wood
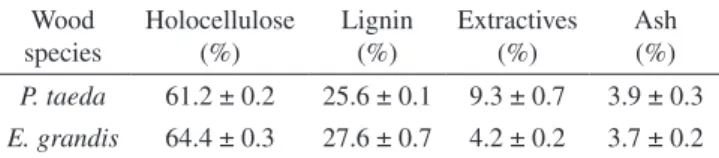
In order to determine the effect of the chemical composition of different types of wood sawdust on the thermal stability, the amounts of holocellulose (cellulose + hemicellulose), lignin and extractives were determined for the two samples. The wood degradation temperature is expected to be related to the thermal stability of its individual components and the differences in the thermal stability of the sawdust samples can be attributed to variations in the chemical composition of wood3, 21. The chemical composition of the sawdust
samples of the two wood species used is shown in Table 1.
According to Table 1, differences can be observed in the composition of the two wood species. E. grandis presented greater quantities of holocellulose and lignin than P. taeda wood. The quantity
of extractives, composed of waxes, grease, resins, tannins, sugars, gums and pigments, for the wood of P. taeda was around twice that for E. grandis. At 600 °C no significant differences were observed in the
amount of ash for the two species analyzed. The holocellulose content of untreated wood is generally around 60-70% that of dry wood22.
The lignin content usually varies between 18-25% for hardwoods and between 25 and 35% for softwoods22. In general, the extractives
content is between 4 and 10%[23].
3.2. Thermal stability of wood
The thermal stability of the two wood species was determined by thermogravimetry. The mass loss increases with temperature, for a heating rate of 20 °C/min, are shown in Figure 1. The curves show a mass loss at below 100 °C, which can be attributed to the evaporation of water present in the sample. The mass loss increases gradually up to approximately 200 °C, and then a more marked mass loss occurs between 200 and 400 °C. The two samples showed a mass loss of around 75% on reaching 400 °C.
The degradation of the E. grandis wood presents two peaks
and a shoulder at approximately 285 °C, and the P. taeda wood
showed only two degradation peaks, as seen in the DTGA curves. In the region between 200 and 400 °C two distinct events occur. The first event, observed at 210-300 °C, can be associated with the decomposition of hemicellulose and the slow degradation of lignin. The second event at approximately 350 °C can be attributed to the 5, 10, 20 and 40 °C/min from ambient temperature (approx. 23 °C)
to 600 °C. The mass used in each experiment was around 10 mg.
2.3. Theoretical considerations
The kinetic study of degradation consists of determining the degree of conversion of decomposed fractions (α). In non-isothermal
experiments, (α) can be calculated using Equation 1[18]:
α = − − ∞ m m m m 0 0 (1)
where mo is the initial mass, m is the mass at each time instant t at a temperature T and m∞ is the final mass. The conversion rate of a
kinetic reaction in the solid state dα/dt can be described as a function of k(T) and f(α) as illustrated in Equation 2.
d
dt k T f α
α
= ( ) ( ) (2)
where dα/dt expresses the conversion rate as a function of time, k is the rate constant and is a function of temperature, f (α) is a function
of the reaction mechanism.
The rate constant is generally given by the Arrhenius equation (Equation 3):
k T Ae
Ea RT
( )= −
(3)
where Ea is the apparent activation energy (kJ.mol-1), R is the gas
constant (8.314 J.K-1mol-1), A is the pre-exponential factor (min-1),
and T is the absolute temperature (K). Combining Equations 2 and 3
the Equation 4 is obtained:
d
dt Af e
Ea RT α α = −
( ) (4)
Since in this method one can vary the heating rate (φ), it can be
observed that, in this case, the temperature and time are dependent on the heating rate (φ) of the experiment. This dependence can be
described as (Equation 5):
φ =
dTdt (5)
Thus, the reaction rate of a non-isothermal event is described as (Equation 6):
d dT A e f Ea RT α α = −
φ ( )
(6)
Several approaches have been proposed to solve the general equation (Equation 6), using different kinetic models to determine the kinetic parameters through thermogravimetric analysis. The method of Ozawa, Flynn and Wall10, 11 is one of the isoconversion methods
used to estimate the activation energy, and it is based on Doyle’s integral approach19 using the Equation 7:
log( )φ =log log( ( ( ))) . .
AE − − −
R g T
E RT
a a
α 2 315 0 4567 (7)
where g(α(T)) is an integral function of the conversion.
The isoconversion principle of FWO is based on the assumption that the rate of reaction in a given conversion is a function only of
Table 1. Chemical composition of the sawdust samples of the wood species investigated. Wood species Holocellulose (%) Lignin (%) Extractives (%) Ash (%)
P. taeda 61.2 ± 0.2 25.6 ± 0.1 9.3 ± 0.7 3.9 ± 0.3
degradation of cellulose. These results are consistent with previously published data3,18,21. According to Kim et al.24, the depolymerization
of hemicellulose occurs at 150-350 °C, the random cleavage of the glycosidic linkage of cellulose at 275-350 °C, and the degradation of lignin at 250-500 °C. However, the differences observed in the DTGA results may be associated with the amount of extractives in the wood samples (Table 1). The higher amount of extractives in P. taeda may
account for the difficulties encountered in identifying the distinct degradation phenomena3. At lower temperatures P. taeda is less stable
than E. grandis, as show in Figure 1. This behavior can be attributed
to the higher extractives content. The E. grandis sample had higher
holocellulose and lignin and lower extractives contents than P. taeda
(Table 1). Shebani et al.3 and D’Almeida et al.14 demonstrated that
higher cellulose and lignin content in lignocellulosic materials leads to a greater thermal stability. This factor thus contributes to the greater thermal stability at temperatures close to those of the processing of thermoplastic composites reinforced with wood (around 200 °C).
3.3. Apparent activation energy (E
a)
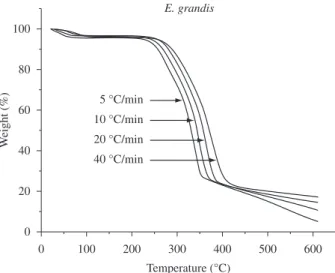
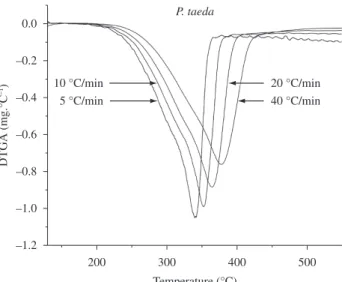
The TGA thermograms obtained at several heating rates for the P. taeda and E. grandis samples are shown in Figures 2 and 3,
respectively. A gradual displacement of the curves to higher temperatures is observed with increasing heating rate. This phenomenon is expected because the low heating rates generate large intervals of time to obtain the curves. It can be seen in Figure 2 that there is an anomaly in the rate of 20 °C/min until at least 20% of weight loss, which may be related to analytical error. However, a conversion range of 0.2 to 0.7 was evaluated in this study, thus validating the curves presented.
The activation energy calculated according to the FWO method, through TGA analysis, is called the apparent activation energy, because it is the sum of the activation energies of the chemical reactions and physical processes that occur simultaneously during thermal degradation6. In Figures 4 and 5, the curves resulting from
applying the FWO method to P. taeda and to E. grandis can be
observed, showing conversions of between 0.2 and 0.7. It can is also be observed that the correlation coefficients (R) were between 0.982 and 0.999, and that the lines are positioned close and parallel to each other, indicating small variations in the activation energy according to the conversion18. The degradation kinetics of wood can be summarized
Figure 2. Thermograms (TGA) with different heating rates for P. taeda.
Figure 3. Thermograms (TGA) with different heating rates for E. grandis. Figure 1. Thermal decomposition of the wood samples studied.
Figure 6. Variation of the activation energy with conversion for the investigated samples.
Figure 5. FWO method applied to E. grandis wood.
by three independent first-order reactions25, corresponding to the
decomposition of the three main components of wood: the most reactive fractions of hemicellulose, cellulose, and lignin, and lastly the remaining fraction of carbohydrates25. In this study, the conversion
range analyzed relates to the decomposition of cellulose.
The activation energy values varied between 153-163 kJ.mol-1
for P. taeda and 146-165 kJ.mol-1 for E. grandis, thus being almost
the same for the two wood species, as is clear in Figure 6. Yao et al.18
studied ten different types of natural fibers and obtained activation energy values of 150-170 kJ.mol-1, indicating that in the thermal
decomposition of natural fibers the activation energy does not vary, or varies minimally after the initial mass loss stage, and remains practically constant up to α = 0.6. When the more volatile components
are degraded at below α = 0.2, differences in the activation energy values can be observed. Thus, in the range of degradation of cellulose studied for the two woods significant changes were not observed.
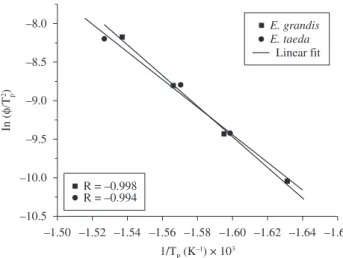
The method proposed by Kissinger was also used to determine the activation energy. Figures 7 and 8 show the derivative
Figure 7. DTGA curves for P. taeda applying the Kissinger method.
Figure 8. DTGA curves for E. grandis applying the Kissinger method.
thermogravimetric curves used to calculate Ea applying the Kissinger
method. The values assumed for the calculation are the maximum peak values of the derivatives7. Figure 9 shows the curves resulting
from applying this method. The correlation coefficients are also close to unity. For P. taeda the Ea was 148.6 kJ.mol-1 and the R value was
0.994, and for E. grandis the respective values were 165.9 kJ.mol-1 and
0.998. The activation energy value calculated by the Kissinger method for P. taeda is below that calculated using the FWO method, whereas
for E. grandis the value obtained is within the previously calculated
range. Although the model proposed by Kissinger is valid for first-order reactions and considers the peak temperature of the DTGA, the values obtained, even with a more distant average value, seems to be consistent with the range of values obtained by the FWO method.
As suggested by Brown et al.26 the different methods of kinetic
4. Conclusions
Thermogravimetric analysis (TGA) was used to determine the thermal stability and activation energy of P. taeda and E. grandis
woods, which are commonly used as applied loads in polymers and also in the lumber and paper pulp industries. The results showed that degradation of sawdust samples of these wood species begins at between 210 and 230 °C, with a high mass loss of around 75% on reaching 400 °C. At temperatures above 400 °C the lignin decomposition processes occur. The E. grandis wood was found to
have better thermal stability than P. taeda at temperatures near the
processing temperatures of thermoplastic composites reinforced with wood, probably due to greater amounts of holocellulose and lignin associated with lower contents of extractives in the former. The activation energy values for the two samples are between 146-165 kJ.mol-1. These data are important in order to gain a better
understanding of the degradation mechanisms of different types of woods and supply information which can be used to determine the best polymer processing conditions when wood is used as a reinforcement material.
Acknowledgments
The authors thank Cambará S/A, Madeireira Gold Martini for supplying the samples of P. taeda and E. grandis and CNPq for the
financial support.
References
1. Hillig É, Freire E, Zattera AJ, Zanoto G, Grison K and Zeni M. Use of sawdust in polyethylene composites. Progress in Rubber, Plastics and Recycling Technology. 2008; 24(2):73-79.
2. Habibi Y, El-ZAwawy WK, Ibrahim MM and Dufresne A. Processing and characterization of reinforced polyethylene composites made with lignocellulosic fibers from Egyptian agro-industrial residues. Composite Science and Technology. 2008; 68(7):1877-1885.
3. Shebani AN, van Reenen AJ and Meincken M. The effect of wood extractives on the thermal stability of different wood species. Thermochimica Acta. 2008; 471(1):43-50.
4. Yang H, Yan R, Chen H, Zheng C, Lee DH and Liang DT. In-depth investigation of biomass pyrolysis based on three major components: Hemicellulose, cellulose and lignin. Energy Fuels. 2006; 20(1):388-393.
5. Gamlin CD, Dutta NK and Choudhury NR. Mechanism and kinetics of the isothermal thermodegradation of ethylene-propylene-diene (EPDM) elastomers. Polymer Degradation and Stability. 2003; 80(3):525-531. 6. Alvarez VA and Vázquez A. Thermal degradation of cellulose derivatives/
starch blends and sisal fibre biocomposites. Polymer Degradation and Stability. 2004; 84(1):13-21.
7. Kissinger HE. Variation of peak temperature with heating rate in differential thermal analysis. Journal of Research of the National Bureau of Standards. 1956; 57(4): 217-221.
8. Avrami M. Kinetics of phase change. I. Journal of Chemical Physics. 1939; 7:1103-1112.
9. Avrami M. Kinetics of phase change. II. Journal of Chemical Physics. 1940; 8:212-224.
10. Ozawa T. A new method of analyzing thermogravimetric data. Bulletin of the Chemical Society of Japan. 1965; 38:1881-1886.
11. Flynn JH and Wall LA. General treatment of the thermogravimetry of polymers. Journal of Research of the National Bureau of Standards – A. Physics and Chemistry. 1966; 70A(6):487-523.
12. Turmanova SC, Genieva SD, Dimitrova AS and Vlaev LT. Non-isothermal degradation kinetics of filled with rise husk ash polypropene. Express Polymer Letters. 2008; 2(2):133-146.
13. Wu Y and Dollimore D. Kinetic studies of thermal degradation of natural cellulosic materials. Thermochimica Acta. 1998; 324(1):49-57. 14. D’Almeida ALFS, Barreto DW, Calado V and D’Almeida JRM. Thermal
analysis of less common lignocellulose fibers. Journal of Thermal Analysis and Calorimetry. 2008; 91(2):405-408.
15. ASTM International. ASTM D 1921-01 - Standard Test Methods for Particle Size (Sieve Analysis) of Plastic Materials. In: ASTM International. Annual Book of ASTM. Philadelphia, Pa: ASTM; 2001. 16. Ono K, Hiraide M and Amari M. Determination of lignin, holocellulose,
and organic solvent extractives in fresh leaf, litterfall, and organic material on forest floor using near-infrared reflectance spectroscopy. Journal of Forest Research. 2003; 8(3):191-198.
17. TAPPI. Tappi Test Method T222 om-02 - Acid-insoluble lignin in wood and pulp. In: TAPPI. Tappi Test Methods, Atlanta: TAPPI; 2002. 18. Yao F, Wu Q, Le Y, Guo W and Xu Y. Thermal decomposition kinetics
of natural fibers: Activation energy with dynamic thermogravimetric analysis. Polymer Degradation and Stability. 2008; 93(1):90-98. 19. Doyle CD. Series approximations to the equation of thermogravimetric
data. Nature. 1965 ; 207:290-291.
20. Bianchi O, Oliveira RVB, Fiorio R, Martins JN, Zattera AJ and Canto LB. Assessment of Avrami, Ozawa and Avrami-Ozawa equations for determination of EVA crosslinking kinetics from DSC measurements. Polymer Testing. 2008; 27(6):722-729.
21. Gronli MG, Várhegyi G and Di Blasi C. Thermogravimetric analysis and Devolatilization kinetics of wood. Industrial & Engineering Chemistry Research. 2002; 41(17):4201-4208.
22. Rowell RM. (ed.) Handbook of wood chemistry and wood composites. Florida: CRC Press; 2007.
23. Klyosov AA. Wood-plastic composites. New Jersey: John Wiley & Sons; 2007.
24. Kim HS, Kim S, Kim HJ and Yang HS. Thermal properties of bio-flour-filled polyolefin composites with different compatibilizing agent type and content. Thermochimica Acta. 2006; 451(1):181-188.
25. Órfão JJM and Figueiredo JL. A simplified method for determination of lignocellulosic materials purolysis kinetics from isothermal thermogravimetric experiments. Thermochimica Acta. 2001; 380(1):67-78. 26. Brown ME, Maciejewski M, Vyazovkin S, Nomen R, Sempere J, Burnham
A et al. Computational aspects of kinetic analysis Part A: the ICTAC kinetics Project-data, methods and results. Thermochimica Acta. 2000; 355(1):125-143.