Abstract
The steel-concrete bond is a fundamental property in reinforced concrete structures. Although there are several studies on the steel-concrete bond, few of them have evaluated the performance of reinforcing bars with diameters less than 10.0 mm, which includes 5.0, 6.3, and 8.0 mm diameters, which are normally used in rein-forced-concrete elements. This study experimentally evaluates the bond between thin steel bars and concrete of 25MPa compression strength. Three types of methods of testing the bond-strength were performed: confined bar test, pull-out test and beam test. It was compared the adequacy of the tests to calculate the conformation coefficient of the bars. The results of the confined bars tests show that this test may be inadequate to determine the surface confor-mation coefficient of reinforcing bars thinner than 10 mm, especial-ly for notched (CA-60) steel bars. The pull-out test resulted in better results in terms of evaluating the bond behavior. Regarding the specimens for the pull-out tests, a modified model with an anchorage length equal to 10 times the bar diameter is suggested. Therefore, the main contribution of this study, based on the results obtained and the methodology used, is to present a proposal for the evaluation of steel-concrete bond for thin rebars.
Keywords
bond, surface conformation, thin rebars.
Experimental Investigation of Steel-Concrete
Bond for Thin Reinforcing Bars
1 INTRODUCTION
The foundation of reinforced concrete is primarily based on the bond mechanism between steel bars and concrete. The characteristics of steel-concrete interface are influenced by an extensive range of parameters related to both steel and concrete, besides the interactions between them. This diversity of aspects, detailed in Angst et. al. (2017), results in heterogeneities in the whole steel-concrete in-terface influencing, among other aspects, the steel-concrete adhesion. Also, as a phenomenon
influ-Eliene Pires Carvalho a, *
Efigênia Guariento Ferreira a
José Celso da Cunha a
Conrado de Souza Rodrigues a
Nilton da Silva Maia a
a CEFET-MG, Civil Engineering
Department, Belo Horizonte, Brazil; [email protected],
[email protected], [email protected], [email protected], [email protected]
* Corresponding author
http://dx.doi.org/10.1590/1679-78254116
enced by many variables, it is a challenge to establish how the steel-concrete adhesion can be de-scribed in standards used for reinforced concrete design. Scientific studies on this property have been performed since the 1940s, as in Rehm (1968) which investigated the factors that influence the bond between steel bars and concrete. Other relevant studies are those by Watstein (1941), Mains (1951), Ferguson et al. (1954), Perry and Thompson (1966), Goto (1971), Mirza and Houde (1979), Kemp (1986), and Jiang et al. (1984). These fundamental studies were all carried out using steel rebars with diameters greater than 12.0 mm.
Research on the steel-concrete bond has followed the materials evolution, such as high-compressive strength concretes, concrete with additives, and self-compacting concretes (Barbosa (2001), Barbosa et al. (2004), Almeida Filho (2008), Araujo et al. (2013), Michael and Catherine (2016)). Steel-concrete bond is also a subject associated to the quality control of reinforced-concrete structures (Lorrain et al. (2011), Silva et al. (2013) and Jacintho et al. (2014)) and the performance of reinforced concrete under extreme conditions, such as in high-temperatures environments and under corrosion (Caetano (2008) and Márquez et al. (2016)). However, although there are several studies on the steel-concrete bond, few of them have evaluated the performance of reinforcing bars with diameters less than 10.0 mm, which includes 5.0, 6.3, and 8.0 mm diameters, which are nor-mally used in reinforced-concrete elements. In addition, the concrete evolution is making possible the design and production of slender reinforced concrete components, especially by the precast sec-tor, applying predominantly thin rebars. On the other hand, the small number of scientific studies on the bond of thin bars casts doubts on the parameters used to calculate the anchorage length of these bars in reinforced concrete elements, that is proposed by Brazilian standards ABNT-NBR 7480 (2007) and ABNT-NBR 6118 (2014).
According to Brazilian standard ABNT-NBR 6118 (2014), the basic anchorage length (lb) of re-inforcing bars can be calculated by equation 1:
bd yd b
f f l
4
(1)
In which:
ϕ – bar diameter
fyd – bar yield strength and fbd – reinforcement bond strength.
The reinforcement bond strength (fbd) can be obtained by equation 2:
ctd
bd f
f
1
2
3 (2)ABNT-NBR 7480
η Bar Type
Φ < 10.0 mm Φ≥ 10.0 mm
1.0 1.0 Plain
1.0 1.2 Notched(CA-60)
1.0 1.5 Ribbed(CA-50)
Table 1: Surface conformation coefficients (η) according to standard ABNT-NBR 7480 (2007).
According to Table 1, the minimum surface conformation coefficient of bars thinner than 10.0 mm must be equal to 1.0. However, several authors have evaluated the values of these coefficients, and the studies by Barbosa (2001) and Barbosa et al (2004) verified that bars thinner than 12.5 mm may not meet Brazilian standards requirements, with conformation coefficients lower than the specified minimums.
These issues, together with the small number of studies on the bond of steel rebars thinner than 10.0 mm, raise the following concerns: a) Does the performance of thin bars meet the minimum conformation coefficient specified by ABNT-NBR 7480 (2007)?; b) Is the surface conformation coef-ficient test proposed by ABNT-NBR 7477 (1982) adequate for thin bars?
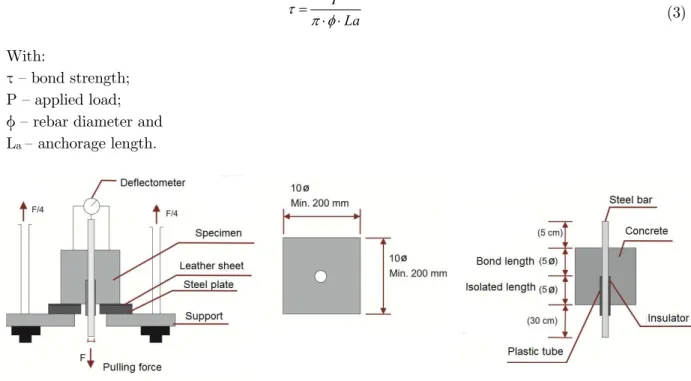
Regarding the tests, it was verified in the literature that most of the tests used to evaluate steel-concrete bond are: pull-out tests RILEM-CEB RC6 (1983), beam tests RILEM-CEB RC5 (1982) and confined bars tests ABNT-NBR 7477 (1982). The pull-out test consists of extracting a steel bar placed in the center of a cubic concrete specimen. The pulling force is measured at one end, and the displacement is measured at the other end, as shown in Figure 1. The bond strength is obtained through equation 3.
La P
(3)
With:
τ – bond strength; P – applied load; ϕ – rebar diameter and La – anchorage length.
According to Figure 1, the anchorage length was 5 times the steel rebar diameter, and the non-bonding length was insulated with a rigid PVC conduit.
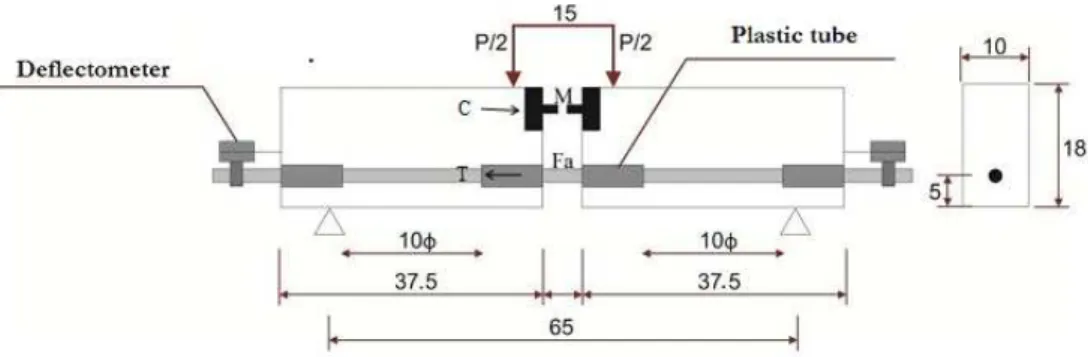
Beam test set-up is basically a 4-point beaming test for a determination of the bond-strength for bent concrete girders (Figure 2).
Figure 2: Beam test set-up (RILEM RC5).
Two separate concrete blocks are, at the bottom, connected by a reinforcement whose bond-strength is to be measured. The reinforcement bar is set into tubes to ensure a precise bond length. The top parts of the blocks are connected by a separating hinge. After setting the test beam, a force is applied to the top part of the girder, symmetrically to both blocks. The force is applied continu-ously and the shift of the bar towards the inside of the block is measured. The test continues until exceeding the bond-strength between the concrete and the reinforcement. The bond strength is ob-tained through equation 4.
According to Figure 2, the anchorage length was 10 times the steel rebar diameter, and the non-bonding length was insulated with a rigid PVC conduit.
1 25, a
a F
and F P
La
(4)
With:
τ – bond strength; Fa – rebar load; P – applied load; ϕ – rebar diameter and La – anchorage length.
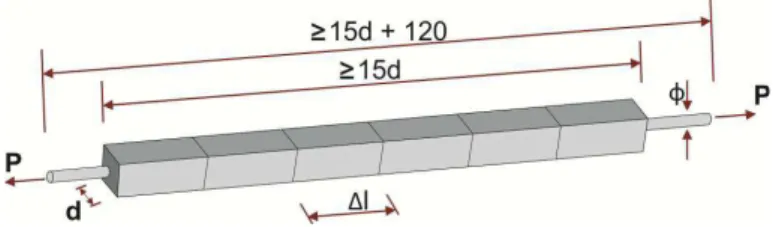
Figure 3: Confined bars test specimen.
Figure 4: Cracked specimen.
The surface conformation coefficient (η) is calculated from the average distance between the cracks through equation 5:
2 25 7
4
average d
d l
.
(5)With:
d – specimen cross sectional length (cm) and
Δlaverage –average distance between cracks, which considers the four faces.
As already mentioned, the tests cited are used to evaluate the steel-concrete bond. However, there are important considerations to be made:
The confined bars test results in an indirect measure of the bar’s bonding capacity and has unsatisfactory values for thin bars;
The pull-out test has been widely adopted in studies in Brazil and other countries to evaluate the bond strength of a bar submitted to direct pull-out. However, there are few studies that have used the pull-out tests for thin reinforcing bars;
Beam tests more accurately represent the steel concrete bond in bent concrete elements, but it is much more laborious to perform.
The methods produce quite different results which make an objective assessment of the con-crete-reinforcement bond-strength difficult.
Given all of the aforementioned reasons, this study presents the results of bond tests carried out using thin reinforcing bars, conducted according to the confined bars, pull-out and beam models. This research contributes to: a) better understanding of the steel-concrete bond for thin steel bars; and b) providing key information for definition of future standards for bond tests to thin reinforcing bars.
2 MATERIALS AND METHODS
steel bars. The pull-out tests and the beam tests were performed to determine the maximum bond strength between the steel bars and concrete. The planning of the tests is shown in Table 2.
Test type Bar type Diame-ter (mm)
Number of specimens per diameter (N)
Confined bars
Notched CA-60
5.0 9
8.0 9
9.5 9
Ribbed CA-50
6.3 9
8.0 9
10.0 9
Pull-out
Notched CA-60
5.0 5
8.0 5
9.5 5
Ribbed CA-50
6.3 5
8.0 5
10.0 5
Beam Test
Notched CA-60
5.0 5
8.0 5
9.5 5
Ribbed CA-50
6.3 5
8.0 5
10.0 5
Table 2: Tests planning.
According to this table, notched (CA-60) and ribbed thin bars (CA-50) were used. For each bar type and each diameter, nine specimens were tested in the confined bars tests and five specimens in the pull-out and beam tests, which resulted in 54 confined bars tests, 30 pull-out tests and 30 beam tests.
Deformed steel bars (notched and ribbed) with 5.0, 6.3, 8.0, 9.5 and 10.0 mm diameters were used in the specimens, as show in Table 2. The notched bars had a yield point of 693 MPa and a tensile strength of 768 MPa. The ribbed bars had a yield point of 639 MPa and a tensile strength of 721 MPa.
The test samples for all test methods were produced from the concrete that had a target com-pressive strength of 25 MPa. The cement used was Portland high early strength (CP V). The con-crete was mixed in the ratio of cement/sand/coarse aggregate = 1:3.45:3.56 at a water/cement ratio of 0.78 and superplasticizer/cement ratio of 0.0074. Concrete cylinders with dimensions of 200x200x100 mm3 were also cast for the test of concrete compressive strength.
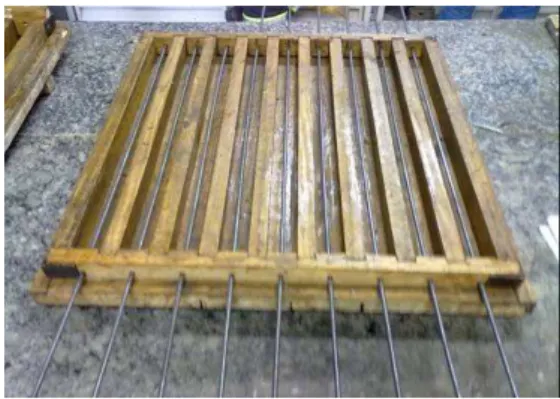
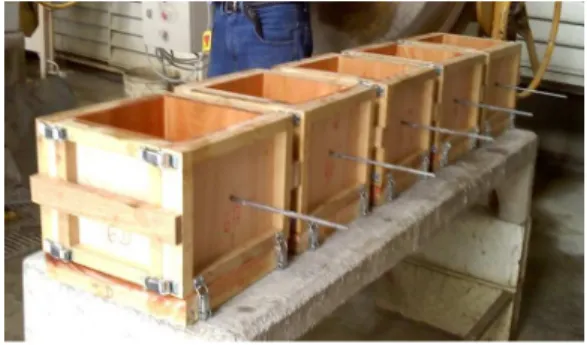
The confined bars tests were performed according to standard ABNT-NBR 7477 (1982). The specimens were cast in wood moulds, as shown in Figure 5 and Figure 6. Before the tests, the spec-imens were painted with lime to make cracks more easily observable.
The tests were performed in a universal testing machine at a constant displacement rate of 1.0 mm/min, up to a load equal to 80% of the yield strength, established for the rebar (Figure 7). The number of cracks in the specimens and the space between them were measured at the end of the test (Figures 8 and 9).
Figure 5: Mould for confined bars specimens. Figure 6: Confined bars specimens.
Figure 7: Set-up of confined bars test. Figure 8: Cracked specimens after the test.
The surface conformation coefficients were also calculated according to ABNT-NBR 7477 (1982), equation 5.
Pull-out tests were conducted according to the recommendations of RILEM-CEB RC6 (1983). Figures 10 and 11 show a detail of the mould used to cast the specimens.
Figure 10: Moulds for Pull-out specimen.
Figure 11: Casting mold- pull-out specimen.
After being cured for 21 days, the specimens were tested in a universal machine with a steel support to fix the model, as shown in Figure 12.
The load cell measured the force applied on the rebar and a displacement transducer measured the relative displacement between the steel rebar and the concrete specimen (Figure 13).
Figure 13: Displacement transducer.
The curves of the bond stress versus the slip of the steel rebar were obtained. The maximum bond strength was also determined according to equation 3.
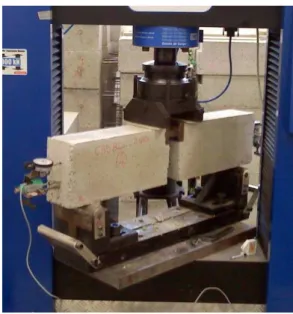
Beam tests were conducted according to the recommendations of RILEM-CEB RC5 (1982). Figure 14 shows a detail of the mould used to cast the specimens. Beam test specimens are shown in Figure 15.
Figure 14: Moulds for Pull-out specimen.
After being cured for 21 days, the beam test specimens were tested in a universal machine as shown in Figure 16.
Figure 16: Beam test set-up.
The load cell measured the force applied on the concrete blocks and a deflectometer measured the relative displacement between the steel rebar and the concrete block (Figure 17).
Figure 17: Deflectometer.
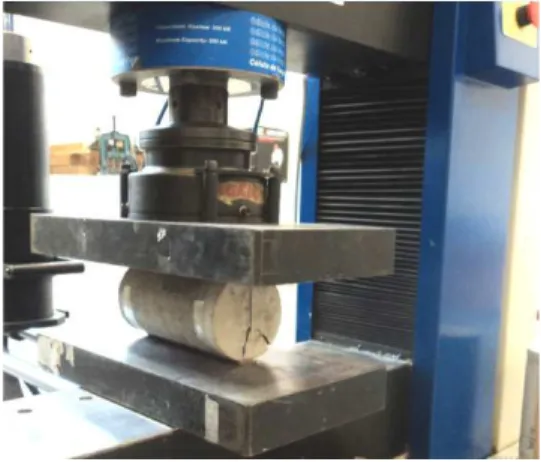
Figure 18: Concrete compression test.
The tensile strengths by cylinder splitting test as shown in Figure 19.
Figure 19: Cylinder splitting test.
3 RESULTS
3.1 Confined Bars Tests
One hundred percent of the specimens with notched rebars (CA-60) for 5.0 and 8.0 diameters did not show the minimum of six cracks in their cross-section, which is required by ABNT-NBR 7477 (1982), to calculate the surface conformation coefficient (η). The only case where η met the re-quirement of standard ABNT-NBR 7480 (2007) was for the only one specimen notched bar with the 9.5-mm diameter. The others eight 9.5-mm diameter bars did not show the minimum of six cracks in their cross-section. In the case of the ribbed rebars, 100% of the specimens had more than six cracks in their cross-section.
Table 3. It must be considered that the surface conformation coefficients were calculated by consid-ering the average of the results of the 9 specimens of each rebar diameter.
Bar type
Ø (mm)
η
(R (sample average values ) η
Sample Standard Deviation (S)
Relative Standard Deviation (RSD) % Notched
CA-60 5.0
1.0
0.82 0.10 12
8.0 0.83 0.24 29
9.5 0.87 0.14 16
Ribbed CA-50
6.3
1.0 1.04 0.12 12
8.0 1.18 0.09 8
10.0 1.5 1.42 0.22 15
Table 3: Surface Conformation Coefficients.
The results reinforce the above-mentioned concerns: a) Do thin bars present satisfactory bond strength once the performance of thin bars does not meet the minimum conformation coefficient specified by ABNT-NBR 7480 (2007)?; b) Is the surface conformation coefficient test proposed by ABNT-NBR 7477 (1982) adequate for thin bars? It is emphasized that these results are in agree-ment with studies by Barbosa (2001) and Barbosa et al (2004), who verified that bars thinner than 12.5 mm may not meet Brazilian standards requirements, with conformation coefficients lower than the specified minimums. The results highlight the importance of evaluating the bond performance of thin reinforcing bars using other types of methods of testing the bond-strength. It is important to mention that in Brazil there is no other standardized method of testing the bond-strength and there is a current concern about the results that have been presented according to methodology proposed by ABNT-NBR 7477 (1982), mainly for thin reinforcing bars.
3.2 Pull-Out Tests
The bond stresses vs. the relative displacement curves were obtained from the pull-out tests, from which the ultimate or breakage bond strength (τu) was determined. Table 4 presents the bond strength (τu), which are the average of the results of the specimens of each sample, i.e., each diame-ter of the steel rebar. Also are present the sample Standard Deviation and the Relative Standard Deviation. Bar type Ø (mm) τu
(Sample average values) (MPa)
Sample Standard Deviation (S)
(MPa)
Relative Standard Devia-tion
(RSD) %
Notched CA-60
5.0 5.29 2.05 39
8.0 3.99 0.61 15
9.5 3.16 0.21 7
Ribbed CA-50
6.3 6.93 1.65 24
8.0 6.47 0.78 12
10.0 10.55 0.71 7
Table 4 presents the results of the specimens with anchorage lengths equal to 5 times the bar diameter. It is important to highlight that the bond strength values of specimens of the same sam-ple exhibited high Relative Standard Deviation in some cases (5.0 and 6.3 mm diameters bars). This indicates that the data points are spread out over a wider range of values.
As regards the high Relative Standard Deviation it can be mentioned that: the anchorage lengths that are 5 times the rebars’ diameter, equal to 23.0, 31.5, 40.0, 47.5, and 50.0 mm for the 5.0, 6.3, 8.0, 9.5, and 10 mm diameters, respectively, can be considered small, and any interference in the steel-concrete interface may influence the bond behavior during the test. Therefore, the small anchorage length may have contributed to the increase in the Relative Standard Deviation of the results. These results may be indicate that the anchorage lengths of the specimens from the pull-out tests of the thin reinforcing bars must be greater than those prescribed by RILEM-CEB RC6 (1983). Therefore, it is suggested that in the case of rebars thinner than 10 mm, the specimens have anchorage lengths equal to 10 times the rebar diameter.
The variation in the behavior of specimens of the same sample can be verified in the bond stress versus slip curves shown in Figures 20 to 25.
Figure 20: Bond stress-slip (Φ5.0 mmCA-60). Figure 21: Bond stress-slip (Φ8 mm CA-60).
Figure 24: Bond stress-slip (Φ8.0 mmCA-50). Figure 25: Bond stress-slip (Φ10.0mm CA50).
The Load-slip curves show that the behavior of the specimens of a same sample was more ho-mogeneous for 9.5 and 10.0 mm diameters rebars. Highlight that these specimens also exhibited higher anchorage lengths.
The graph in Figure 26 shows a comparison between the behaviors of the notched (CA-60) and ribbed (CA-50) bars. This graph shows that the bond strength of 10.0-mm and 8.0-mm ribbed bars is greater than that of 9.5 mm and 8.0-mm notched bars, respectively. In the case of 5.0-mm ribbed bars and 6.3-mm notched bars, the results indicate that there may be no significant difference. Therefore, thin ribbed bars may have better bond performance than that of the notched bars. It ís noted that ABNT-NBR 7480 (2007) does not consider that thin reinforcing bars exhibit a perfor-mance gain based on bars with different conformations (plain, notched, or ribbed) as shown in Ta-ble 1.
Figure 26: Bond performance - Notched and Ribbed rebars- pull-out.
3.3 Beam Tests
Bar type
Ø (mm)
τu
(Sample average values) (MPa)
Sample Standard Deviation (S)
(MPa)
Relative Standard Devia-tion
(RSD) %
Notched CA-60
5.0 12.07 1.42 12
8.0 6.52 0.91 14
9.5 4.11 0.09 2
Ribbed CA-50
6.3 12.93 2.19 17
8.0 11.36 1.9 17
10.0 10.99 1.15 11
Table 5: Bond strength values (τu) – Beam test.
Table 5 presents the results of the specimens with anchorage lengths equal to 10 times the bar diameter. The bond strength values of specimens of the same sample exhibited high Relative Stand-ard Deviation in some cases (6.3 and 8.0 mm diameters bars). In general, comparing the data ob-tained with a repeated measurement using the beam test method can be complicated.
The graph in Figure 27 shows a comparison between the behaviors of the notched (CA-60) and ribbed (CA-50) bars in beam tests. This graph also shows the bond strength of 10.0-mm and 8.0-mm ribbed bars is greater than that of 9.5 8.0-mm and 8.0-8.0-mm notched bars, respectively. In the case of 5.0-mm ribbed bars and 6.3-mm notched bars, the results indicate that there may be no signifi-cant difference. Therefore, thin ribbed bars may have better bond performance than that of the notched bars.
Figure 27: Bond performance - Notched and Ribbed rebars- Beam test.
The graphs in Figure 28 show a comparison between pull-out and beam tests results:
test has been widely adopted as a method of testing the steel concrete bond-strength in Brazil and other countries. In addition, the results presented previously also to highlight that the pull-out test produced better results than confined bars test. Then it is believed that the pull-out is the best methodology to evaluate the steel-concrete bond for thin reinforcing bars (Φ<10 mm) and it is pos-sible to calculate the surface conformations coefficients (η), prescribed by ABNT-NBR 7480 (2007) (Table 1), adopting the results from pull-out.
Figure 28: Bond performance - Notched and Ribbed rebars- Pull-out x Beam test.
3.4 Calculation of the Surface Conformation Coefficients (η) from the Pull-Out and Cylinder Splitting Tests
Results
As already shown, the results of the confined bars tests were unsatisfactory in calculating the sur-face conformation coefficients (η) of thin reinforcing bars. In view of this, it is proposed that the surface conformation coefficients are calculated using the results from the pull-out and cylinder splitting tests using equation 6, which is based on the equation prescribed by the French standard, B.A.E.L. 91 (1994).
2
s s ftj
(6)
The ψs variable is related to the steel rebar surface conformation, τs refers to the bond strength, and ftj is the tensile strength of the concrete.
Therefore, it is suggested that both the ultimate bond resistance (τs=τu), obtained in the pull-out tests, and the tensile strength, obtained by cylinder splitting tests (ftj), which is obtained in the concrete characterization (ABNT-NBR 7222 (1994)), be used to calculate the bar surface confor-mation coefficient (η), where η= ψs and using equation 7.
s s
tj
f
(7)
Notched bars
ϕ (mm) τs (MPa) ftj (MPa) ψs=η
5.0 5.29 2.43 1.47
8.0 3.99 2.32 1.31
9.5 3.16 2.53 1.12
Table 6: Calculation of notched (CA-60) bars’ surface conformation coefficient (experimental average values).
Ribbed bars
ϕ (mm) τs (MPa) ftj (MPa) ψs=η
6.3 6.93 2.33 1.72
8.0 6.47 2.71 1.54
10.0 10.55 2.36 2.11
Table 7: Calculation of ribbed (CA-50) bars’ surface conformation coefficient (experimental average values).
Tables 6 and 7 show the surface conformation coefficients (η) of the notched (CA-60) and ribbed (CA-50) thin bars. Note that the values were greater than the minimum values defined in ABNT-NBR 7480 (2007) (Table 1). Additionally, by evaluating the results from Tables 6 and 7, a performance gain of the surface conformation coefficients can be observed of the notched bars com-pared with that of the ribbed bars.
With regard the structural design of concrete elements, the anchorage length (lb) of reinforcing thin bars can be calculated by equation 1, according to Brazilian standard ABNT-NBR 6118 (2014). It can be safety if the reinforcement bond strength (fbd) be obtained by equation 2, adopting η1 equal 1.
In these terms, one can consider that the results from pull out tests are better than those ob-tained by confined bars test. These considerations indicate that, besides being an adequate test to evaluate the bond performance of thin reinforcing bars, the pull-out test could be used to determine the surface conformation coefficient of these bars. The importance of the cylinder splitting tests is highlighted as a complementary test to determine the surface conformation coefficient and indirect-ly, the bar-concrete bonding capacity.
4 CONCLUSIONS
The good results of the pull-out tests and the cylinder splitting tests reinforce the idea of adopt-ing them to evaluate the bond capacity of thin reinforcadopt-ing bars to calculate their surface confor-mation coefficient.
Regarding the specimens for the pull-out tests, a modified model with an anchorage length equal to 10 times the bar diameter is suggested (Figure 29).
Figure 29: Pull-out Specimen: modified model.
Noteworthy that these modified model is suggested once the high dispersion of the results in this research was attributed to the small bonding length (5 times the nominal diameter), especially when compared to the heterogeneities of the concrete, such as the coarse aggregate size. The an-chorage length equal to 10 times the bars’ diameter is greater than the length recommended by RILEM-CEB RC6 (1983), but this length has been already recommended by Montoya et al (1994). The main objective to increase the anchorage length is to verify if will be a decrease in the disper-sion of the pull-out tests results.
It is also believed that smaller specimens can facilitate the test performance because of they are lighter and easier to manipulate. The issues surrounding the best specimen model for the pull-out tests are important and should be investigated.
References
Almeida Filho, F.M., El Debs, M.K., El Debs, A.L. (2008), Bond-Slip behavior of self-compacting concrete and vi-brated concrete using pull-out and beam tests. Materials and Structures, v. 41, pp. 1073-1089.
Angst, U.M., Geiker, M.R., Michel, A., Gehlen C., Wong, H., Isgor, B., Elsener, B., Hansson, C.M., François, R., Hornbostel.K., Polder, R., Alonso, M.C., Sanchez, M., Correia, M.J., Criando, M., Sagues, A., Buenfeld, N. (2017), The Steel-concrete interface. Materials and Structures, 50:143.
Araujo, D. L.; Danin, A. R.; Melo, M. B.; Rodrigues, P. F. (2013) Influence of steel fibers on the reinforcement bond of straight steel bars. IBRACON Structures and Materials Journal. Volume 6, Number 2- p. 307-338.
ASSOCIAÇÃO BRASILEIRA DE NORMAS TÉCNICAS (1982) – ABNT-NBR 7477 – Determinação do Coeficiente de Conformação Superficial de Barras e Fios de Aço Destinados a Armaduras de Concreto Armado – Método de Ensaio, Rio de Janeiro [in portuguese].
ASSOCIAÇÃO BRASILEIRA DE NORMAS TÉCNICAS (2007) – ABNT-NBR 7480 – Aço destinado a armaduras para estruturas de concreto armado – Especificação, Rio de Janeiro [in portuguese].
ASSOCIAÇÃO BRASILEIRA DE NORMAS TÉCNICAS (2014) – ABNT-NBR 6118 – Projeto de estruturas de concreto - Procedimento, Rio de Janeiro [in portuguese].
B.A.E.L. 91 (1994). Règles techniques de conception et de calcul des ouvrages et constructions em béton armé, sui-vant la méthode des états limites. Troisième tirage, 328 pages, Éditions Eyrolles. Paris, 1994.
Barbosa, Maria Teresa Gomes (2001). Avaliação do Comportamento da Aderência em Concretos de Diferentes Clas-ses de Resistência [Evaluation of the Bonding Behavior of Concretes]. 144 f. Thesis (Doctor of Science in Civil Engi-neering) - Rio de Janeiro, 2001 [in portuguese].
Barbosa, Mônica Pinto; Costa, Odair José; Silva, Leonardo Moisés; Salles, Flavio Moreira (2004). Concreto Auto-Adensável: Avaliação da Aderência Aço-Concreto Através dos Ensaios de Determinação do Coeficiente de Con-formação Superficial de Barras de Aço. [Self-Compacting Concrete: Evaluation of Steel-Concrete Bonding Through Tests to Determine the Surface Conformation Coefficient of Steel Rebars] 46º Congresso Brasileiro do Concreto - IBRACON - Volume II - Construções em Concreto - Trabalho CBC0167 - pg. II.484 - II.497. Florianópolis,[in portu-guese].
Caetano, Luciane Fonseca (2008). Estudo do Comportamento da Aderência de Elementos de Concreto Armado em Condições Extremas [Study of the Behavior of Reinforced-Concrete Elements in Extreme Conditions]. Dissertation (Masters in Engineering), Porto Alegre [in portuguese].
COMITÉ EURO-INTERNATIONAL DU BÉTON. Recommendation RC 6: Bond test reinforcement steel - PULL-OUT TEST (1983). Concrete Reinforcement Technology. Georgi Publishing Company. Paris.
Ferguson, P. M.; Turpin, R. D.; Thompson, J. N (1954). Minimum bar spacing as a function of bond and shear strength. ACI Journal. Proc. Vol. 50, June, pp. 869-887.
Goto, Y (1971). Cracks Formed in Concrete around Deformed Tension Bars. Journal of the ACI, (Apr), pp. 244-251. Jacintho, A. E. P. G. De Avila; Pimentel, L. L.; Barbosa, M. P.; Fontanini, P. S. P. (2014). Steel and concrete bond stress: a contribution to the study of Apulot tests using concrete with rubber addition. IBRACON Structures and Materials Journal. Volume 7, Number 5.p p. 817-844.
Jiang, D. H., Shah S., P.; Andonian A. T. (1984) Study of the transfer of tensile forces by bond. ACI Journal. Kemp, E. L. (1986). Bond in reinforced concrete: behavior and design criteria. ACI Journal. Proc. Vol. 83, January-February, pp. 50-57.
Lorrain, Michel; Barbosa, Mônica Pinto; Silva Filho, Luiz Carlos (2011). Estimation of compressive strength based on Pull-Out bond test results for on-site concrete quality control, Ibracon Structures and Materials Journal, Volume 4, Number 4 pp. 582-591.
Mains, R. Measurement of distribution of tensile and bond stress along reinforcing bars (1951). Journal of ACI, pp. 225-252.
Márquez, J.F.C., Matin L.M.G., Ruiz, M.A.F., Montes E.H. (2016) Procedure for the assessment of the residual capacity of corroded B-regions in RC structures, Construction and Building Materials, v.121, pp. 519-534.
Michael, I.K. and Catherine G.P. (2016) Bond behavior of reinforcement in lightweight aggregate self-compacting concrete. Construction and Building Materials, v.113, pp. 641-652.
Mirza, S. M., Houde, J. (1979) Study bond stress-slip relationship in reinforced concrete. Journal of the ACI. v. 76, n. 1, pp. 19-46.
Montoya, P.J. (1974) Mese Guer, A.G. e Cabre, F.M., “Hormigon Armado”, Madri, 1974.
Rehm, G. (1968) The Basic Principles of the Bond between Steel and Concrete. C&CA Library Translation n.134 (Uber die Grundlagem des Verbundes Zwischen Stahl und Beton. Deutscher Ausschuss Fur Stahlbeton, Heft 138, pp.59, 1961).
Silva, B.V.; Barbosa, M.P.; Silva Filho, L.C.P; Lorrain M.S. (2013) Experimental investigation on the use of steel-concrete bond tests for estimating axial compressive strength of steel-concrete: Part 1. IBRACON Structures and Materi-als Journal. Volume 6, Number 5. pp. 715-736.