• Nenhum resultado encontrado

Lat. Am. j. solids struct. vol.14 número9

N/A
N/A
Protected

Academic year: 2018

Share "Lat. Am. j. solids struct. vol.14 número9"

Copied!
21
0
0

Texto

(1)

Abstract

In this paper, energy absorption and deformation capacity of circu-lar thin-walled members with elliptical cut-outs are investigated both numerically and experimentally. Thin-walled members possess the uniform height, thickness, average cross sectional area, material and volume are subjected to axial quasi-static loading. To conduct such tests, special fixture arrangement is designed for placing the specimen in the compression loading machine. The deformation mechanisms and the corresponding collapse mode along with its energy absorption of the thin-walled tubes were investigated in detail for various aspect ratios (0.315, 0.523, 0.854, 1, 3.375 and 4.08). The explicit finite element code ABAQUS was then em-ployed to perform the numerical studies inview of mitigating the influence of cutout shape, location and symmetry on energy absorp-tion and crush characteristics. In aspect ratio of 4.08, whose major axis length of 24.5 mm observed maximum crash force efficiency (CFE) of 14% possessing symmetric discontinuity. The results of experimental and simulations are in good agreement and shows that the location and symmetry of cutouts had considerable effect on collapse crushing behaviour.

Keywords

Thin-walled members, elliptical cut-outs, quasi-static loading, collpase modes, aspect ratio

Quasi-Static Crushing and Energy Absorption Characteristics

of Thin-Walled Cylinders with Geometric Discontinuities

of Various Aspect Ratios

1 INTRODUCTION

In the recent years, high speed logistics maximizes the probability of fatal accidents which leads to high rate of injuries during vehicular crashes. The tubular structures exhibits significant energy absorption capability when subjected to impact loading, results in minimizing the injuries during collision. The availability of various materials and cross sections can be chosen for the energy ab-sorbing elements in vehicles. However, unlike the aluminum which is chosen in the absence of

con-N. Baaskaran a K. Ponappa a S. Shankar b

a Department of Mechanical Engineering,

Kongu Engineering college, Erode, Tamil Nadu-638052, India.

Email: baaskararcher@kongu.ac.in, ponappa@kongu.ac.in

c Department of Mechatronics Engineering,

Kongu Engineering college, Erode, Tamil Nadu-638052, India.

Email: shankar@kongu.ac.in

http://dx.doi.org/10.1590/1679-78253866

(2)

ventional steel structures which results in the 25% of overall weight reductions. The positioning of aluminum columns behind the bumpers paves the way to protect the structure and occupants dur-ing collision. It is possible, by absorbdur-ing the initial kinetic energy and significantly less reduction in force levels which can be tolerable by commuters that develops during collision. The 50 kN of force level can be tolerated by humans without the maximum damage during collision (Jones., 2011 ). The structure geometry, material properties, discontinuities and the loading conditions are the dom-inant factors in formation of deformation modes of high speed steel (HSS) extrusions. They also reported that the effect of strain rate and strain hardening effects of collapse behavior of thin-walled tubes are limited. Additionally, the geometric discontinuities such as cutouts and stiffeners in real time scenarios leads to stress concentration adjacent to the cut-outs that affects the crushing pat-tern of the structure (Reid et al., 1986). The axi-symmetrical fold patpat-tern was observed in quasi-static loading during experimental scheme when cylindrical shells are subjected to various loading conditions (Dorin et al., 2017). The theoretical static plastic hinge model was developed to derive the basic expression for mean crushing force (Abramowicz et al., 1984). Energy absorbers are one the passive safety systems employed in automotive industry, also known as crash boxes. The main purpose of using energy absorbers is to control the impact energy of the automobile during crash. The aluminum is becoming more familiar in replacing the conventional steel materials due to the high strength to weight ratio and excellent formability. In case of absorbing impact, the superior energy absorbing properties can be rendered by aluminum combined with intelligent crash box de-sign leads to bigger shape and lesser weight when compare to conventional steel energy absorber. During the recent years, the attention focused on light weight structures and crashworthiness to envisage the analytical, experimental and finite element approaches to interpret the peak force, mean force, collapse mode and energy absorbed (Szwedowicz et al., 2014); (Wierzbicki et al., 1983); (Hou et al., 2007); (Tai et al., 2010); (Zahran et al., 2017).

(3)

the main load members from the air blast loads (Explosions) (Palanivelu et al., 2011); (Velmurugan et al., 2009).

Many studies have been conducted to study the quasi-static progressive crushing of thin-walled tubes; it reveals the origin of deformation pattern occurred at the concentrated end of structure experiencing impulse loading. Moreover, the deformation occurs either asymmetrically (Mode-Diamond) nor asymmetrically (Mode-Ring (or) Concertina) which is determined by (D/t) ratio. The experimental results show that the thin-walled tubes possessing higher D/t (>80) is very sus-ceptible to strain-hardening leads to diamond mode deformation and tubes with D/t (<80) is com-pletely rigid-plastic (low strain hardening), the occurrence of deformation is in concertina mode. The correlation between the diameter to wall thickness ratio (D/t) and length to wall thickness ratio (L/t), its impact on prediction of deformation pattern is given (Alexander et al., 1960 ); (Hsu et al., 2004); (Chung et al., 2008). This work has been further refined on switching over the occur-rence of deformation pattern from diamond to concertina and concertina to mixed collapse modes. The energy absorption capacity is vitally influenced by mean collapse load. (Khalkhali et al., 2016) This exhibits the development of theoretical models in determining the mean collapse loads for square and circular cross-sections experiencing axisymmetric and asymmetric collapse modes. The strain rate effect plays a crucial role in improvement of yield stress of material. (Huang et al., 2014)They suggested an improved method in determining the expression for dynamic loading using quasi-static mean crush load.

To the author’s knowledge, abundant information is needed at the instant, regarding the folding pattern of aluminum structures with cut-outs. The explicit finite element code ABAQUS was em-ployed to perform an economic and efficient analysis for evaluating the quasi-static collapse mode and energy absorption characteristics inclusion of cut-outs in thin-walled structures. In order to assess the collapse characteristics, with various elliptical shape discontinuities pattern was per-formed numerically and experimentally by quasi-static axial crushing tests. The obtained results are compared with the numerical data and more information about crush progressive responses are gen-erated. The comparative studies are undergone to demonstrate the impact of elliptical shaped dis-continuities to undermine the optimal positioning of cut-outs in thin–walled tubes.

2 TEST SPECIMEN AND EXPERIMENTAL SET-UP 2.1 Specimens

In our work, the specimens are made using Aluminum 2024 alloy, which is shown in Figure 1.

2.2 Material Property

(4)

Figure 1: Specimen mounted on the fixtures using the lathe machine.

Johnson-Cook Material parameters Cowper-Symonds parameters

Material Density (Kg/m3)

A (Mpa)

B (Mpa)

CP

(J/Kg K)

Tmelt

(K) n c m C(s

-1

) p

Al 2024 277 265 426 875 775 0.34 0.015 1.0 6500 4

Tmelt= melting temperature; CP=Sp. Heat capacity; A, B, n, c, m, C and P are material constants.

Table 1: The material parameters.

2.3 Mounting of the Specimen

(5)

Figure 2: Exhibits the installed specimen on mounting fixture.

Figure 3: Exhibits the schematic cross section of the specimen installed on mounting fixture.

2.4 Experimental Setup

The axial quasi-static loading of specimen is carried out using DEEPAK (DTRX) hydraulic machine as shown in Figure 4. This machine has two jaws: the upper one is movable and the lower one is sta-tionary, it is equipped with 30 kN load cell which was used for quasi-static axial compression tests.

The specimen is placed between the two jaws in vertical direction which enables the specimen to get compressed axially. Since the upper and the lower jaws of the machine are movable and sta-tionary, consequently, the upper and lower ends of the specimen are noted as “Fixed end” and Mov-ing end” correspondMov-ingly. To attain accuracy, three samples of each specimen were tested and the obtained mean value was treated as the final result. The quasi-static compression is accomplished by compressing the specimen at the controlled displacement rate of 5 mm/min until the thin-walled tubes experiencing the limited crush. The other researchers have applied the cross head speed be-tween the range of 5 and 10 mm/min to ensure the absence of dynamic effects while testing (Niknejad et al., 2012); (Ahmad et al., 2009); (Kashani et al., 2013); (Estrada et al., 2016). In Table 2, the values of the maximum and mean forces captured in these tests are listed along with crushing length of the sample at the end of process, starting location of the collapse process, type of collapse modes and these terms associated with energy absorption which is calculated from load-displacement pattern. The in-built automatic data acquisition system was utilized to capture the above parameters in the testing. Results of the quasi-static compression process of thin walled cut-out tubes are utilized for validation of numerical simulation in the upcoming sections.

Specimen No Pmax (N) Pmean (N) Eabsorbed (J) Deformation (mm) Collapse mode Collapse Starting point CFE (%) SEA (J/Kg) Pr14 434 54.78 5.03 96 Diamond Mid of Specimen 12.62 2129.97 Pr24 509 49.01 5.64 92.3 Diamond Mid of Specimen 9.62 2403.15 Pr34 376 56.31 4.75 96.67 Diamond Mid of Specimen 14.97 2024.27 Pr44 532 32.92 2.59 89.3 Diamond Moving End 6.18 1258.18 Pr54 488 54.83 4.50 94 Diamond Mid of Specimen 11.23 1913.37 Pr64 572 50.65 5.14 91.67 Diamond Mid of Specimen 8.85 2195.81

(6)

3 NUMERICAL SIMULATIONS 3.1 Description of Numerical Model

The general geometry and FEM model of the thin-walled tubes considered in this study is shown in Figure 5. The parameters involved for all modeled configurations were similar as experimental and the various Lo were examined. The Lo can be termed as the distance between the centers of cut-outs to the bottom end of the tube. The material behavior including the post-yield response was defined using the Johnson–cook parameters which are depicted in Table.1. The fixed and movable jaws of the testing machine base were modeled using two rigid surfaces located on the fixed and moving end of the specimen. The three-dimensional shell element S4R are much opted to model the quasi-static process; the advancing front algorithm is used to generate the mesh refinement on the edges of the cut-out. The local seeds of approximate element size of 2.5 mm for a total of 2243 quadrilateral dominated element were used for free meshing. The R3D4 rigid elements were em-ployed to model the fixed and moving ends.

Figure 4: Deepak DTRX apparatus. Figure 5: Schematic view of FEM and geometric model.

(7)

3.2 Expression for Surface Area of Thin-Walled Tubes Including Elliptical Cut-Out (Huang et al., 2010)

Considering a thin-walled tube which was intersected with a hollow circular pipe whose cross-section is of ellipse with radii p and q. The thin-walled tube along with an elliptic cut-out is shown in Figure 6, the elliptic cut-out geometry can be expressed by the equation (1)

(1)

Figure 6: Geometry of thin-walled tube with elliptic-cutout.

For analytical study, the small strip which is generated by slicing of the tube as exposed as dark zone in the Figure 6. It should satisfy the cut-out boundary, area of this strip can be written as,

dA=2rθ.dz (2)

The relation between θ and y is configured from Figure 6

(3)

The θ can be obtained by substituting the Equation (1) in (3),

(4)

By substituting Equation (4) in (2), we get

. (5)

(8)

. (6)

It can be refined as

. (7)

This form is considered as constraint equation, which can be rewritten as ∗ or

. (8)

4 RESULTS AND DISCUSSION

The results of experimental and numerical data are compared in Table 3. From the above tables, the maximum variation of results observed is about10.34 %. Herewith, numerical simulations can foresee the characteristics of thin-walled tubes behavior fairly. Moreover, the other parameters like energy absorption, mean and maximum forces observed are more or less same for both in numerical and experiments. Even though there is also some variation in the formation and starting point of collapse modes can be which can be depicted in Table 3.

Specimen No

Difference%

Collapse mode

Collapse Starting Point

Pmax

(N)

Pmean

(N)

Eabsorbed (J)

Deformation (mm)

Pr14 8.41 4.66 10.34 -6.61 Similar Different Pr24 5.06 1.72 4.53 -5.64 Similar Different Pr34 2.69 7.24 -10.32 -5.52 Similar Similar Pr44 6.49 -6.35 6.58 -4.53 Similar Similar Pr54 -2.92 4.28 -8.54 -2.31 Similar Different Pr64 4.54 -3.74 7.12 -1.36 Similar Different

Table 3: Comparison between the results of simulations and experiments cut-outs length L0 =0.75 mm.

The logic behind the variation may be due to the preparation of specimen by forming and weld-ing process. The change in collapse mode is mainly due to the formation of startweld-ing locations of fold, it can be happen by flawed approximation of friction co-efficient in numerical modeling. Till now, there is lack of in availability of deterministic criterion for predicting the starting point of collapse modes (Nia et al., 2010). It provokes the results obtained in experiments are more authentic. There are varieties of parameters involved in characterizing the crashworthiness of thin-walled structures. The first parameter is the total energy absorbed which can be calculated by the work done by the crushing force in longitu-dinal deformation (Δ) can be expressed in following equation (9). The sec-ond important parameter is the mean load (Pmean), which can be calculated using equation (10). It

(9)

The third parameter is the specific energy absorption (SEA), which provides the ability of ener-gy absorption capability per unit mass of the crushed structural component and expressed in equa-tion (11). The crush force efficiency (CFE) is the fourth parameter shown in equaequa-tion (12), pro-vokes the idea about the energy absorption behavior about the ideal structural component. Here the ideal value is considered as 100%, which indicates initiation of crushing (Pmax) load is constant and

remains the same. The lower CFE is not preferred because of higher initial force is directly trans-ferred to the mounting structure.

. ∆ ∆

(9)

.

(N) (10)

.

(J/Kg) (11)

(%) (12)

4.1 The Impact of Location of the Cutout

The cut-out size of 1/45 of the overall area of the tube was created at different locations along the length of tubes. The elliptical cut-outs were positioned at five different locations of L0 (L0=0.375,

0.5, 0.625, 0.75 and 0.875), the variation in three different major axis lengths and aspect ratios were chosen as geometric discontinuities to mitigate the effect of location in this section. The explicit relationship between radii p and q for the shell with an elliptical cut-out is shown in Figure 7.

Figure 7: Relation between radii of p and q of an elliptic cutout on thin-walled tubes.

(10)

Figure 8: Fabricated specimen subjected to quasi-static loading.

Figure 9: Comparison between collapse modes of samples in experiments and simulations (Pr14 and Pr24).

(11)

Specimen No

Geometric Description Analytic Results

Shape L0(L)

Minor axis (mm) Major axis (mm) Aspect Ratio (mm) Pmax (N) Pmean (N) Eabsorbed (J) Deformation (mm)

Pr00 NO NO NO 568.49 56.512 4.684 105.074

Pr11 0.375 24.5 6 4.08 413.31 39.014 3.226 104.639

Pr12 0.5 384.98 36.28 3.056 104.052

Pr13 0.625 395.67 43.961 3.975 102.582

Pr14 0.75 389.25 52.574 4.608 102.346

Pr15 0.875 405.11 54.877 4.877 101.327

Pr16 0.75 169.81 23.779 5.504 102.417

Pr21 0.375 6 19.04 0.315 483.60 49.096 3.621 100.102

Pr22 0.5 505.47 50.367 3.712 98.807

Pr23 0.625 477.41 51.112 2.981 97.281

Pr24 0.75 485.89 52.668 5.359 97.514

Pr25 0.875 513.57 53.287 4.097 96.563

Pr26 0.75 417.57 45.565 4.715 97.689

Pr31 0.375 20.25 6 3.375 435.24 35.311 2.833 103.987

Pr32 0.5 416.87 44.278 3.331 103.442

Pr33 0.625 397.20 45.481 3.930 101.538

Pr34 0.75 414.81 52.229 4.625 101.723

Pr35 0.875 442.06 57.386 5.077 99.416

Pr41 0.375 7 13.37 0.523 519.62 42.897 2.341 96.474

Pr42 0.5 516.63 48.854 4.267 95.321

Pr43 0.625 502.65 50.821 4.025 95.468

Pr44 0.75 496.97 35.010 2.766 93.758

Pr45 0.875 546.61 59.105 5.118 93.287

Pr51 0.375 7 8.2 0.854 530.63 48.949 4.073 99.471

Pr52 0.5 545.51 47.865 4.034 97.939

Pr53 0.625 545.92 42.537 3.365 96.522

Pr54 0.75 529.68 52.481 4.638 96.179

Pr55 0.875 556.20 57.744 4.907 96.143

Pr61 0.375 9 9 1.0 502.97 40.254 3.241 96.581

Pr62 0.5 536.84 43.335 3.427 95.673

Pr63 0.625 493.18 46.342 3.854 95.292

Pr64 0.75 531.26 52.550 4.913 92.943

Pr65 0.875 547.77 53.646 4.502 93.547

Pr66 0.75 460.29 51.478 5.413 93.783

Table 4: Numerical simulation of circular thin-walled tubes with one or two cut-outs placed at various locations.

(12)

to the formation of plastic hinges. But the observed pattern of entire collapse mode is different; this behavior is already cited in various literatures. The collapse mode is much similar for the tubes whose location of cut-outs positioned in 0.75 to 0.875 L, had the maximum proximity to the loading end, results in similar energy absorbing capability.

Specimen No

Geometric Description Analytic Results

Shape L0

(L) Minor axis (mm) Major axis (mm) Aspect Ratio (mm) Collapse mode Collapse Starting point CFE (%) SEA (J/Kg)

Pr00 NO NO NO C and D ME 9.940 1983.06

Pr11 0.375 24.5 6 4.08 D MOS 9.439 1365.79

Pr12 0.5 D MOS 9.423 1293.81

Pr13 0.625 C and D MOS 11.110 1606.68

Pr14 0.75 C and D ME 13.506 1950.88

Pr15 0.875 D ME 13.546 2064.77

Pr16 0.75 D ME 14.003 2330.22

Pr21 0.375 6 19.04 0.315 D MOS 9.155 1541.50

Pr22 0.5 D MOS 8.977 1580.24

Pr23 0.625 D MOS 7.797 1269.05

Pr24 0.75 D ME 9.901 2281.39

Pr25 0.875 D ME 9.559 1744.14

Pr26 0.75 D ME 10.911 2007.23

Pr31 0.375 20.25 6 3.375 D MOS 8.112 1206.55

Pr32 0.5 D MOS 10.621 1418.65

Pr33 0.625 D MOS 11.450 1673.76

Pr34 0.75 C and D ME 12.590 1969.76

Pr35 0.875 D ME 12.981 2162.26

Pr41 0.375 7 13.37 0.523 D MOS 6.020 995.32

Pr42 0.5 D MOS 9.862 1814.97

Pr43 0.625 D MOS 9.816 1712.03

Pr44 0.75 D ME 7.044 1176.52

Pr45 0.875 D ME 10.812 2176.94

Pr51 0.375 7 8.2 0.854 C and D MOS 9.224 1729.51

Pr52 0.5 D MOS 9.017 1712.95

Pr53 0.625 D MOS 7.791 1428.87

Pr54 0.75 C and D ME 9.907 1969.42

Pr55 0.875 C and D ME 10.381 2083.65

Pr61 0.375 9 9 1.0 D MOS 8.003 1382.67

Pr62 0.5 D MOS 8.072 1462.03

Pr63 0.625 C and D MOS 9.396 1644.19

Pr64 0.75 D ME 9.891 2095.99

Pr65 0.875 C and D ME 9.793 1920.64

Pr66 0.75 D ME 11.183 2309.30

a Collapse Mode - C and D (Concertina and Diamond), D (Diamond)

b Collapse Starting Point – ME (Moving End), MOS (Mid of Specimen), FE (Fixed end)

Table 5: Numerical simulation of circular thin-walled tubes with one or two cut-outs placed at various locations.

(13)

loca-tion. Furthermore, if the cutout is positioned at the mid-portion of tube results in change of trans-formation from progressive buckling to global bending mode is the major cause for energy absorbing capability. The energy absorbing capabilities were depicted in Figure 11, the Pmean for Pr11, Pr21,

Pr31 and Pr41 are 39.01, 49.09, 35.31 and 42.89 N respectively. It clearly reveals the reduction of energy absorption by 30.9, 13.13, 37.51 and 24.10% when compared to the absence of cutout in the tube. The occurrence of stable deformation observed in position of cutout location in 0.75 L and elliptical discontinuity of aspect ratio of 1.

(14)

Figure 11: a) Max.Peak Force Vs Major axis at (Lo=0.375L) b) Mean forcé Vs Aspect ratio (p/q).

Consequently, the Pmean was observed to reduce significantly with the increase in aspect ratios

and the load carrying capability is greatly influenced by cutouts indirectly by aspect ratios. The re-sistance offered by the tube is much greater when the major axis is minimum and narrow, perpendicu-lar to the quasi-static compression loading. The pattern is completely in contrast of long major and short minor axis, the resistance offered is comparatively low when the cutout is narrow. The position directly influences the occurrence of collapse mode and its corresponding load bearing capacity.

4.2 The Impact of Aspect Ratio of the Cutout

The energy absorption capability of thin-walled tubes under the influence of different aspect ratios and geometric discontinuities are investigated in this section. It is evident that the collapse behavior is mainly affected by position of cutout location at 0.75L rather than 0.875L. Additionally, to verify the results obtained, Figure 11 a) depicts the behavior of thin walled tubes variation in major axis to the maximum peak force. It is clear that change in major axis had direct influence on occurrence of peak load and corresponding deformation. For instance, the major axis length positioned at Lo=0.375L shows reduction in major axis results in decrease in maximum peak force of 27.36%, 14.96%, 23.41%, 8.62% and 11.61% for the five types of cutout (Pr11, Pr21, Pr31, Pr41 and Pr41) respectively. The occurred deformation of cutouts of major axis 24.5 mm and 9 mm are about 104.63 and 96.58 mm, it is much close to 105.074 mm. The mean load of 56.512 N is obtained for the profile Pr00 without cutout and profiles with various aspect ratios is shown in Figure 11 b), the increase in aspect ratio results in reduction of average mean load which varies from 9.2% to 19.83%. The above results indicates the variation in final deformation, collapse mode and peak force is influ-enced greatly by the aspect ratios of the cutouts. It also reveals that increase in major axis results in maximum deformation which in turn reduction in energy absorbing capacity of thin-walled tubes.

4.3 The Impact of Symmetry of the Cutout

(15)

is positioned at the mid-section of the tube which experiences higher stress concentrations around the cutout zone and its immediate outcome is transition of collapse mode to global bending. To perceive the importance of symmetry of cut-out and its impact on collapse mode, collapse starting point, crash force efficiency (CFE) and specific energy absorption (SEA) are investigated. In order to mitigate the effectiveness of the symmetry of geometrical discontinuities, three types of cutouts were selected and its interactions are depicted in Table 4, 5 and in Figure 12.

(16)

Furthermore, the introduction of symmetry in cut-out results in transition of collapse mode from global bending to progressive folding. Similarly, for the specimen Pr14 and Pr16 with major axis length of 24.5 mm is compared. The results from these cases exhibits variation of collapse mode pattern from concertina and diamond to completely diamond mode. Furthermore, the variation in collapse pattern makes the significant decrease in peak load and energy absorption. It can be no-ticed that the variation in maximum peak force of 389.25N to 169.81N for the specimen for Pr14 and Pr16 respectively. The observed variation is due to the symmetry of the cutout, it can be no-ticed that the specimen having symmetrical cutout will be much effective than the one having the single cutout when it is subjected to same testing conditions.

Moreover, increase in major axis of cutout provokes in depth fact of increase in energy absorp-tion rate of 4.608 J to 5.504 J, it indirectly increases the crash force efficiency(CFE) from 13.50 to 14% and its impact on specific energy absorption (SEA) from 1950.88 to 2330.222 (J/kg) for the observed specimen Pr14 and Pr16 is clearly visible. Figure 12 shows the interaction between force and deformation along with deformation and energy absorption of various specimens having one and two cutouts.

4.4 Deformation (or) Collapse Mode

The deformed sections of experimental and analytical samples are scrutinized in Figure 9. It is evi-dent that there are considerable differences between the above in some cases, due to the non-uniformities in forming cut-outs in the fabrication process. The obtained collapse modes for each case are given in Table 5. Furthermore, the increase in major axis of cutout shows the transition of collapse mode from completely diamond to concertina and diamond mode. Also the collapse starting point is change from mid of specimen to the moving end. The triangular formation experienced by the specimen, at the start of the quasi-static process shown in Figure 13.

(17)

4.5 Energy Absorption

The energy absorption capability of tested thin walled tubes with various locations of Lo is clearly depicted in Table 4 and Figure 14. It is clear from these figures increase in Lo, i.e. nearer to the load-ing end increases the energy absorption rate irrespective to the aspect ratios. For instance, specimen Pr11 whose cutout location is 0.375L experiences energy absorption rate of 3.226 J. Similarly for spec-imen Pr15 whose major axis length is 24.5 mm similar to the profile Pr11, only change made is the cutout location transferred to 0.875L experiences 4.877 J. The percentage increase in energy absorp-tion rate is about 33.05%, is mainly due to the transiabsorp-tion of collapse modes from irregular progressive folding to global bending mode. The origin of collapse starting point is gradually shifted over from mid of the specimen to the moving end of the impactor. The observed result is unanimously similar to the entire specimen irrespective to their aspect ratios, if the location of the cutout is nearer to the impactor it results in higher energy absorption rate for the corresponding aspect ratios.

4.6 Maximum Collapse and Mean Load

The maximum force (Pmax ) is the demanding parameter during quasi-static (or) impact loading and

the first peak observed in force-deformation curve. Investigations of these parameter displays for all aspect ratios, occurrence of collapse mode is of diamond and origin of collapse point is normally mid-of the specimen. However, the maximum force could be reduced by introducing the triggering dents or other folding initiators. It is evident that the same effect can be obtained by introducing of symmetry of the cutouts what we had briefed in Pr16, Pr26 and Pr66. For instance Pr14 exhibits the maximum peak force of 389.25 N, by introducing symmetry for the specimen Pr16 it is drastically reduced to 169.81N of percentage reduction about 56.37% is very encouraging. The increase in aspect ratio results in reduction of mean load, in concern with energy absorbing systems the need for decrease in the dif-ference between maximum and average forces is essential. It is normally done by filling foams, provid-ing external grooves on the peripheral of the tubes or usprovid-ing variable thickness tubes (VTD).

√ . (13)

Also, experimental and numerical studies have proved that thin-walled tubes with higher D/t ratio (i.e., 5098) and strain hardening makes material sensitive which leads to occurrence of collapse pattern in the form of diamond mode. It could be observed that the stability of the crushing process and the corresponding energy absorption was much higher for the specimens possessing shorter ma-jor axis length. The load bearing capacity is greatly influenced by the type of cut-out. The longer major axis forms the short and flat hole which is perpendicular to the direction of compression load. The resistance experienced to the external forces is not efficient; it directly affects the load bearing capacity and further causes the different collapse modes results in significant reduction in mean load (Pmean) for the occurred deformation. By location (i.e., Lo= 0.75L), the specimen experiences

signif-icant reduction in crushing force due to the formation of plastic hinges which results in similar max-imum force (Pmax ). The similar maximum force (Pmax) and reduction in mean load (Pmean) directly

(18)

are exhibited which has more similarities. The validation of the obtained results for the mean load of the specimen (Pr14) obtained in experimental mode is compared with the analytical from (Pal-anivelu et al., 2011). The obtained (Pmean) value by using the equation (13) is 50.5 N, similarly the

obtained analytical result is compared with the experimental data and numerical simulation which is of 52.57 N and 54.786N. The difference in percentage is about 3.93 %, which gives the confidence in continuing the research.

(19)

Figure 15: Interaction between forcé-deformation history and deformation-energy absorption curves subject to quasi-static loading.

5 CONCLUSIONS

The significant outcome related to the thin-walled tubes from experimental and numerical observa-tion which may be used as energy absorbers are given below:

 The location of cut-out can drastically influences the energy absorption and buckling charac-teristics of the thin-walled tubes.

 The presence of cut-out with higher major axis length reduces the maximum peak force, causes the greater crushing deformation of thin-walled structures.

 The mean buckling values (Pmean) decreases linearly as the function of elliptical

discontinui-ties with the increase in cut-out major axis length.

 By increasing the cut-out location from mid-height of the tube towards moving end, shows reduction in peak buckling force (Pmax) and considerable increase in energy absorption

capa-bility irrespective of aspect ratios.

(20)

 Absorbed energy per unit mass is larger for the profile with symmetric cut-outs, Specimen Pr16, Pr26, P66 obtained increase in energy absorption rate by 16.27%, 28.75%, 09.23% when compared to Pr14, Pr24, P64.

 The highest crash force efficiency (CFE) of 14% for the specimen Pr16 with elliptic symmetry cut-out, which contains the larger major axis length of 24.5 mm with the aspect ratio of 4.08.

 There is a good agreement between experimental data and simulation results, the analytical solution including the strain rate and strain hardening effects of the material gives the mean loads which are very close to experimental results.

Furthermore, if the thin-walled structures are designed with cutouts to obtain the expected re-sults, the discontinuities with symmetry is a significant variable to consider.

References

Abramowicz, W., Jones, N., (1984). Dynamic axial crushing of circular tubes. International Journal of Impact Engineer-ing 3: 263–281.

Abramowicz, W., Jones, N., (1984). Dynamic axial crushing of square tubes. International Journal of Impact Engi-neering 2: 179–208.

Ahmad, Z., Thambiratnam, D.P., (2009). Dynamic computer simulation and energy absorption of foam filled conical tubes under axial impact loading. International Journal of Computers and Structures 87: 186-197.

Alexander, J.M., (1960). An appropriate analysis of the collapse of thin cylindrical shells under axial loading. Quar-terly Journal of Mechanics and Applied Mathematics 13: 10-15.

Chukwuemeke, W.I., and Oluleke, O., (2016). Energy absorption improvement of circular tubes with externally press fitted ring around tube surface subjected to axial and oblique impact loading. International Journal of Thin walled Structures 109: 352-366.

Chung, S.K.Y., Nurick, G.N., Starke R.A., (2008). The energy absorption characteristics of double cell tubular pro-files, Latin American Journal of Solids and Structures 5: 289-317.

Darvizeh, A., Meshkinzr, A., Alitavoli, M., & Rajabiehfard, R., (2017). Low velocity impact of empty and foam filled circumferentially grooved thick-walled circular tubes. International Journal of Thin walled Structures 110: 97-105. Dorin, D., Kaarstad, B.L., Skajaa, B., Hopperstad, O.S., Langseth, M., (2017). Testing and modeling of stiffened aluminium panels subjected to quasi-static and low-velocity impact loading. International Journal of Impact Engi-neering 00: 1-15. (in press)

Estrada, Q., Szwedowicz, D., Baltazar, M., Cortes, C., Majewski, T., & Estrada, C.A., (2016). The performance of energy absorption in structural profiles with different discontinuities. International Journal of Advanced Manufacturing Technology 84: 1081-1094.

Estrada, Q., Szwedowicz, D., Majewski, T., Oliver, M., Cortes, C., Estrada, C.A., Castro, F., (2016). Effect of dis-continuity size on the energy absorption of structural steel beam profiles. International Journal of Advanced Materials and Structures 24: 88-94.

Fan, Z., Lu. G., Liu. K., (2013). Quasistatic axial compression of thin walled tubes with different cross sectional shapes. International Journal of Engineering Structures 55: 80-89.

Hou, S.J., Li, Q., Long, S.Y., Yang, S.J., (2007). Design Optimization of regular hexagonal thin walled columns with crashworthiness criteria. International Journal of Finite Element Analysis and Design 43: 555-565.

Huang, M.Y., Tai, Y.S., Hu, H.T., (2010). Dynamic characteristics of high strength steel cylinders with elliptical geometric discontinuities. International Journal of Theoretical and Applied Fracture Mechanics 54: 44-53.

(21)

Kashani, M.H., Alavijeh, H.S., Akbarshahi, H., Shakeri, M., (2013). Bitubular square tubes with different arrange-ments under quasistatic axial compression loading. International Journal of Materials and Design 51: 1095-1103. Khalkhali, A., Mostafapour, M., Tabatabaie, S.M., Ansari, B., (2016). Multi-objective crashworthiness optimization of perforated square tubes using modified NSGAII and MOPSO. International Journal of Structural Multidiscipli-nary Optimization 54: 45-61.

Nia, A.A., and Hamedani, J.H., (2010). Comparative analysis of energy absorption and deformations of thin walled tubes with various section geometries. International Journal of Thin walled Structures 48: 946-954.

Nia, A.A., Fallah Nejad, K.H., Badnava, H., Farhoudi, H.R., (2012). Effect of buckling initiators on mechanical behavior of thin-walled square tubes subjected to oblique loading. International Journal of Thin walled Structures 59: 87-96.

Niknejada, A., Abedia, M.M., Liaghab, G.H., & Zamani Nejad, M., (2012). Prediction of mean folding force during the axial compression in foam filled grooved tubes by theoretical analysis. International Journal of Materials and Design 37: 144-151.

Palanivelu, S., Van Paepegam, W., Degrieck, J., De Pauw, S., Vantomme, J., Wastiels, J., … & Van Hemelrijck, D., (2011). Low velocity axial impact crushing performance of empty recyclable beverage cans. International Journal of Impact Engineering 38: 622-636.

Reid, S.R., Reddy, T.Y., Gray, M.D., (1986). Static and Dynamic axial crushing of foam-filled sheet metal tubes. Interna-tional Journal of Mechanical Sciences 28: 295–322.

Szwedowicz, D., Estrada. Q., Cortes, C., Besdolla, J., Alvarez, G., Castro, F., (2014). Evaluation of energy absorp-tion performance of steel square profiles with circular dis-continuities. Latin American Journal of Solids and Struc-tures 11: 1744-1760.

Tai, Y.S., Huang, M.Y., Hu, H.T., (2010). Axial compression and energy absorption characteristics of high strength thin walled cylinders under impact load. International Journal of Theoretical and Applied Fracture Mechanics 53: 1-8.

Velmurugan, R., Muralikannan, (2009). Energy absorption characteristics of annealed steel tubes of various cross sections in static and dynamic loading. Latin American Journal of Solids and Structures 6: 385-412.

Weirzbicki, T., Abramowicz, W., (1983). On the crushing mechanics of thin walled structures. International Journal of Applied Mechanics 50: 727-734.

Imagem

Figure 1: Specimen mounted on the fixtures using the lathe machine.
Table 2: Average values of the important results for cut-outs length L 0  = 0.75 mm (Experimental results)
Figure 4 :  Deepak DTRX apparatus. Figure 5 :  Schematic view of FEM and geometric model.
Figure 6 :  Geometry of thin-walled tube with elliptic-cutout.
+7

Referências

Documentos relacionados

11, under low impulse loading ( I = 6.63 10 × − 6 ), the mid-span velocities of the front and back beams reach the equal value in the first phase, and then goes into phase III-

For linear material, one can see that the thermal properties are char- acterized by the classical symmetric thermal expansion tensor and the new size-dependent skew-symmetric

The dowel action of the back face rebars and the strengthening layers had no role in ultimate punching load (i.e. first peak load). ii) Although the strengthened slabs showed

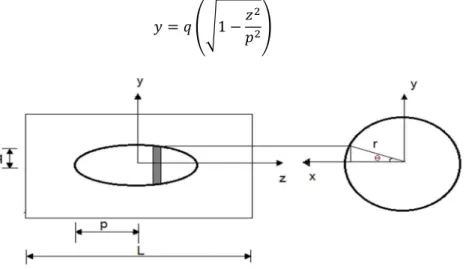
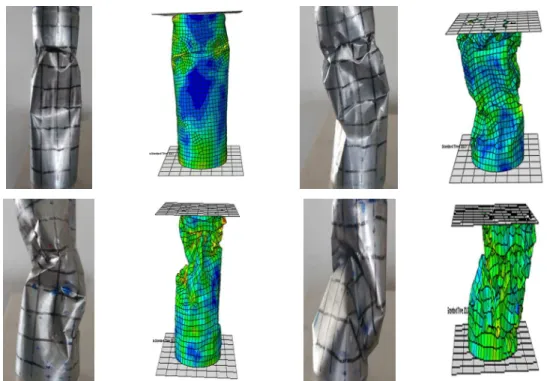
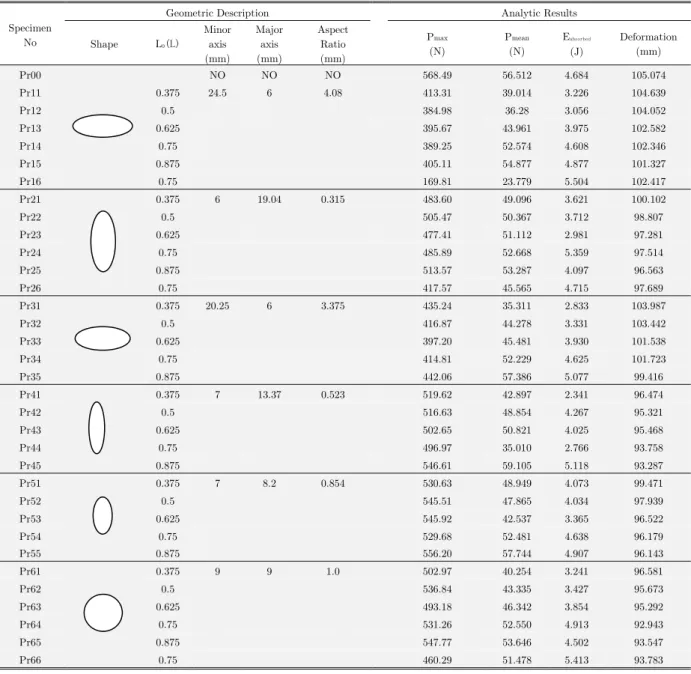
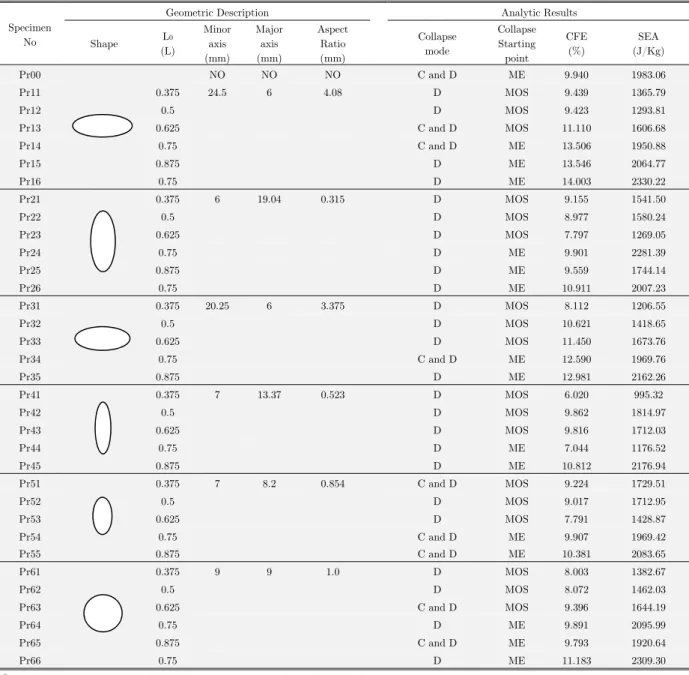
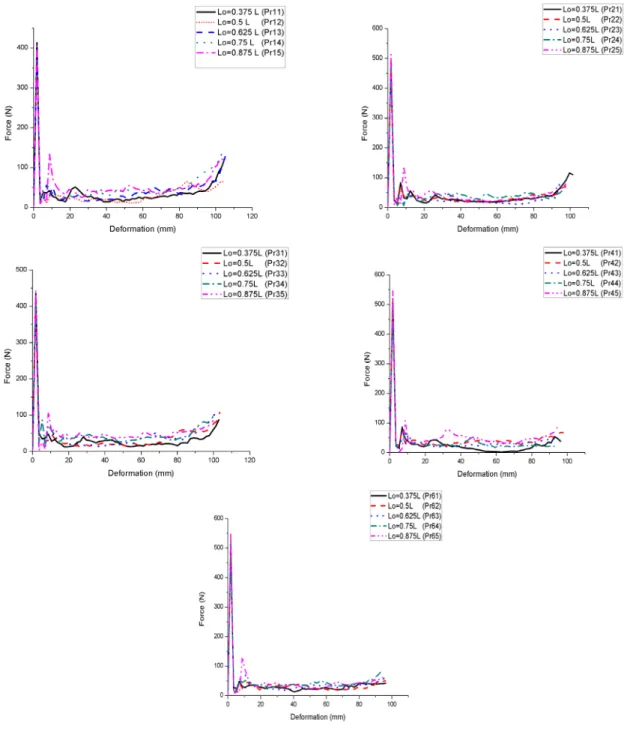
In this work we plan to apply the experimental design method on the experimental results found by Deokar, A (2011), concerning the effect of the size and position of

(2009) Axisymmetric bending and buckling analysis of thick functionally graded circular plates using unconstrained third-order shear deformation plate theory, Compos. (2004)

The material parameters taken as uncertain are residual surface stress, surface elastic modulus, the small scale parameter of the nonlocal theory and

The results of the penetration experiments using conventional ogive-nose and grooved-tapered projectiles with an initial velocity of 1250m/s and an incidence an- gle of 5°

In this research, two stress-based finite element methods includ- ing the curvature-based finite element method (CFE) and the curvature-derivative-based finite element method