ABSTRACT: Soil bulk density (ρb) data are needed for a wide range of environmental studies. However, ρb is rarely reported in soil surveys. An alternative to obtain ρb for data-scarce regions, such as the Rio Doce basin in southeastern Brazil, is indirect estimation from less costly covari-ates using pedotransfer functions (PTF). This study primarily aims to develop region-specific PTFs for ρb using multiple linear regressions (MLR) and random forests (RF). Secondly, it assessed the accuracy of PTFs for data grouped into soil horizons and soil classes. For that purpose, we compared the performance of PTFs compiled from the literature with those developed here. Two groups of data were evaluated as covariates: 1) readily available soil properties and 2) maps derived from a digital elevation model and MODIS satellite imagery, jointly with lithological and pedological maps. The MLR model was applied step-wise to select significant predictors and its accuracy assessed by means of cross-validation. The PTFs developed using all data estimated ρb from soil properties by MLR and RF, with R
2 of 0.41 and 0.51, respectively. Alternatively, using environmental covariates, RF predicted ρb with R2 of 0.41. Grouping criteria did not lead to a significant increase in the estimates of ρb. The accuracy of the ‘regional’ PTFs developed for this study was greater than that found with the ‘compiled’ PTFs. The best PTF will be firstly used to assess soil carbon stocks and changes in the Rio Doce basin.
Keywords: multiple linear regressions, random forests, soil predictors, spatial prediction 1Federal University of Viçosa − Dept. of Soil, Av. Peter Henry
Rolfs, s/n. − 36570-900 − Viçosa, MG − Brazil.
2International Soil Reference and Information Centre − World Soil Information, PO Box 353 − 6700 − AJ Wageningen − The Netherlands.
3Federal University of Viçosa − Dept. of Statistic. *Corresponding author<[email protected]>
Edited by: Silvia del Carmen Imhoff
Pedotransfer functions to estimate bulk density from soil properties and
Eliana de Souza1*, Elpídio Inácio Fernandes Filho1, Carlos Ernesto Gonçalves Reynaud Schaefer1, Niels H. Batjes2, Gerson
Rodrigues dos Santos3, Lucas Machado Pontes1
Received December 17, 2015
Accepted February 06, 2016
Introduction
Bulk density (ρb) is commonly not reported in soil survey reports due to laborious work and high costs in-volved in the sampling and laboratory analysis of this property. However, despite data scarcity, ρb is needed for assessing stocks and fluxes of nutrients in the soil (Batjes, 1996; Bernoux et al., 1988; Martin et al., 2011). To overcome the lack of measured ρb data, pedotrans-fer functions (PTF) are commonly used to estimate ρb from more widely available, measured soil chemical and physical properties (see Bouma, 1989). Recent advances in PTF development, in terms of prediction and assess-ments of accuracy, are discussed elsewhere (McBrat-ney et al., 2011, 2002; Minasny and Hartemink, 2011; Pachepsky and Rawls, 2004; Wösten et al., 2001). Typi-cally, such functions are not portable to other regions with acceptable accuracy.
Linear models are considered the most simple and the fastest way to estimate data by means of PTFs. Amongst the many model types that have been devel-oped (Wösten et al., 2001), Random Forests (RF) is a non-parametric model that has not yet been used extensively to predict ρb (Jalabert et al., 2010; Tranter et al., 2007).
Soil properties, readily available from routine soil surveys, underpin most PTFs to estimate ρb (Benites et al., 2007; Bernoux et al., 1998; Han et al., 2012; Nanko et al., 2014). With the growing use of Digital Soil Mapping techniques, ρb is increasingly predicted using a combina-tion of environmental data (covariates) and/or selected soil properties (Calhoun et al., 2001; Jalabert et al., 2010;
Martin et al., 2009). Environmental covariates, indicative of the main soil forming processes, are typically derived from a digital elevation model and satellite imagery, and analyzed with auxiliary maps (e.g. land cover, geology, soil classes (pedology), and geomorphology) to develop models that spatially predict ρb.
The primary aim of this study is to develop PTFs to estimate ρb from routinely measured soil properties as well as environmental covariates, using non-paramet-ric and linear modeling. The secondary aim is to assess accuracy of PTFs developed for data grouped into soil horizons and soil classes. Therefore, we compared the performance of PTFs developed for tropical soils, as compiled from the literature (hereafter referred to as ‘compiled’ PTFs) with the PTFs developed for the Rio Doce basin.
Materials and Methods
Study site and data
Although relatively small, the Rio Doce ba-sin is important for Minas Gerais State as it accounts for around 15 % of the state’s gross domestic product (GDP). The study site covers circa 70,000 km2 (Figure 1) and represents the hilly lowlands inter-plateau of the Rio Doce, an important physiographic feature of south-eastern Brazil. The Rio Doce is the main fluvial course in the basin flowing in an NW-SE direction due to the structure of the landscape and flooding lowlands. Pre-cambrian crystalline rocks altered by climate led to the formation of a thick mantle of weathered materials in
which soils typical for the humid tropics were formed (RADAMBRAZIL, 1983). Altitude varies between 64 m and 1,998 m and there are three main climate zones ac-cording to Köppen’s climate classification: tropical with altitude climate with summer rains and cool summers; tropical with altitude climate with summer rains and hot summers; and hot climate with summer rains (Alvares et al., 2013). Until the beginning of 20th century, the Rio Doce basin area was under tropical Atlantic rainforest and transitional vegetation between forest and Cerrado. Since then, native vegetation has been greatly destroyed and replaced by grasses and coffee and eucalyptus plan-tations (RADAMBRAZIL, 1983). According to the land coverage mapping of MMA (2006), forest covers 26 % of the basin area while 67 % is covered by pasture, while the remaining 11 % consists of secondary forest, euca-lyptus plantations, and agriculture. Agricultural activi-ties in the basin include reforestation, traditional crops, coffee culture, sugarcane, dairy farming, as well as beef cattle and swine livestock. Other economic activities in-clude agribusiness (sugar and ethanol), mining (iron ore, gold, bauxite, manganese, precious stones and others), industry (cellulose, steel and dairy products), trade and support services to industrial plants, in addition to elec-trical power generation (IGAM, 2010).
According to the 1:600,000-scale soil map (FEAM, 2011), the basin is mostly composed of homogeneous, strongly and deeply weathered Red-Yellow, Red and Yel-low Ferralsols, as well as Red-YelYel-low and Red Acrisols (FEAM, 2011; RADAMBRAZIL, 1983). Ferralsols cover 65 % of the area and occur mainly on dissected plateaus with suave undulating to high hilly relief. Acrisols rep-resent around 23 % of the basin and are found in areas of undulating relief. The remaining soil units (12 %) are mainly Cambisols, Leptosols and Arenosols, with patch-es of bare rocks, typically, the units occur in association with Ferralsols and Acrisols. According to the Brazilian System of Soil Classification (SiBCS), at the third level
(subgroup), these are represented by 16 different soil classes: Ferralsols (Red, Yellow, and Red-Yellow), Acri-sols (Red and Red-Yellow, dystrophic and eutrophic), Cambisols (Haplic and Fluvic, dystrophic and eutrophic, and Humic dystrophic), Leptosols (Litholic, dystrophic and eutrophic), and Arenosols (Hortic and Humic).
We described and sampled 125 soil profiles in the field (FEAM, 2011). For PTF development, we consid-ered samples representing diagnostic horizons A (125) and B (117). The samples were air-dried and the fine earth fraction (< 2 mm) was used for the chemical and physical analyses. Further, at each profile site, two un-disturbed samples were taken per horizon to determine bulk density (Figure 1).
The physical and chemical analyses were carried out using methods presented by EMBRAPA (1997). The procedure to separate soil texture was modified according to Ruiz (2005), using the sieve method for the sand frac-tion (2 - 0.05 mm) and the pipette method to determine the silt (0.05 - 0.002 mm) and clay (< 0.002 mm) fraction.
Soil reaction (pH) was measured in water, soil wa-ter proportion 1:2.5. Sum of exchangeable bases (SB) was calculated as the sum of bases (Ca2+, Mg2+, Na+ and K+). Cation exchange capacity (CEC) was determined by the sum of bases, plus exchangeable acidity (H+ and Al3+). Organic carbon (OC) content was determined using the Walkley and Black (1934) titration method. Bulk density was determined by the Cylindrical Core method. Sam-ples were oven dried at 100 °C for 48 h after which ρb was calculated as the ratio of the dried soil mass over the volume of the cylinder (EMBRAPA, 1997).
Loam (< 35 % of clay and > 15 % sand), clay loam (35 to 60 % clay), and clay (> 60 % clay) represented 30 %, 52 % and 18 % of the data, respectively. Most surface samples were classified as ‘horizon A-moderate’, while ‘horizon A-weak’ types were reported in 5 % of the stud-ied sites. Subsurface samples, grouped according to hori-zon type, were classified as B-incipient, B-textural, and B-latosolic, respectively, related to the Cambisols, Acrisols, and Ferralsols. Soil structure is generally blocky in the Acrisols, and granular or “pseudo-sand” in the Red and Red-Yellow Ferralsols.
The data were divided into homogenous groups based on their classification: Ferralsols (115 samples), Acrisols (82), and Cambisols (36). As there were less than 30 samples for the Leptosols and Arenosols these were not analyzed as separate classes. However, the cor-responding nine samples of both classes together were considered in the overall analysis that considered all measured data for A and B horizons (242).
The following measured soil properties (indepen-dent variables) were used for PTF (ρb) development: silt and clay content, sum of exchangeable bases (SB), pH, cation exchange capacity (CEC), and OC content. Fur-ther, for PTFs that consider environmental covariates, possible predictor variables, were selected in terms of the soil forming factors as originally described by Jenny (1941) and later modified by McBratney et al. (2003) in
the Scorpan model: Sc = f(s, c, o, r, p, a, n), where Sc represents the soil class or attribute to be modelled in casu bulk density. For a given point (location), Sc is a function (f): s, soil measured properties; c, climate; o, organisms, including land cover or natural vegetation or fauna/human activity; r, relief (topography or landscape attributes); p, parent material/lithology; a, age, the time factor; and n, the spatial or geographic position.
Two factors on the Scorpan model, age and spa-tial position, could not be considered here due to a lack of appropriate data layers for them. A pedological map at scale 1:600,000 (FEAM, 2011) was used to represent information on soil classes. Air temperature was repre-sented using MODIS temporal satellite imagery of day and nighttime temperature as a proxy for cool and hot summers in this predominantly subtropical area (1000-1500 mm yr−1, see Souza et al., 2014). Alternatively, the influence of ‘organisms’ was accounted for as vegetation index, derived from MODIS satellite imagery, which also provided a proxy for regional differences in rainfall dis-tribution and amount. The principal components for the Enhanced Vegetation Index (EVI, MOD13A3 product) and Land Surface Temperature (LST, MOD11A2 prod-uct) images were derived using the 8-day and monthly time-series MODIS images. These images at 1 km spa-tial resolution were downloaded from the USGS website (MODIS, 2013). Time series and principal components were prepared for the year 2013 as proposed by Hengl et al. (2012).
Relief was represented by several landscape maps derived from a digital elevation model (DEM). A litholog-ical map at scale 1:1,000,000 (CPRM, 2004) served as a proxy for parent material. The main geological units are gneiss, granitoids, schists and quartzites. For this study, the pedological map (FEAM, 2011) was generalized by considering only the dominant soil class of a mapping unit. The DEM, generated from images of the Shuttle Radar Topography Mission - SRTM (CGIAR, 2014), was processed to remove spurious cells to derive the follow-ing maps: elevation above mean sea level (MDE), slope (SLP, in radians), topographic wetness index (TWI), and solar radiation (INS). Further, several maps were gener-ated from MODIS imagery: first principal components of monthly series of daytime of surface temperature (TD), first principal components of series monthly nighttime surface temperature (TN), first principal components of vegetation index (EV1), and second principal com-ponents of vegetation index (EV2). These maps served as environmental covariates for PTF development and were processed using SAGA software (System for auto-mated geoscientific analyses, v. 2.1, 1999).
Development of PTFs and accuracy assessment PTFs were developed using two model-approach-es: a) multiple linear regression (MLR), which was ap-plied step-wise to select significant predictors, and b) random forest (Liaw and Wiener, 2002). All analyses were performed using R software.
Leave-one-out cross validation (Isaaks and Srivas-tava, 1989) was applied to assess the prediction accuracy of the MLR-based PTFs. The following indexes were cal-culated: adjusted coefficient of determination (R2
adj, see Equation 1), mean error (ME, see Equation 2), and root mean squared error (RMSE, see Equation 3).
The ME gives the bias and allows evaluation of over-estimation (positive values) or underover-estimation (negative values); values close to zero are preferable. The RMSE is a measure of the overall error of the estimation and can be used to compare performance of different PTFs.
R n
n p R
adj
2 = −1 −1 1 2
− ∗ −
(1)
where: n is the number of samples; p is the number of parameters, including the intercept; for models with in-tercept, i = 1 and i = 0 for all other cases; R2 is the regression coefficient of determination.
ME
ni xi xi n
=
(
−)
=
∑
1
1
ˆ (2)
RMSE
x x
n
i i
i n
=
−
(
)
=
∑
ˆ 21
(3)
In equations 2 and 3, xi represents the measured value of ρb, xˆi the estimated value; and n the total
num-ber of samples used in the estimation.
The accuracy of PTFs developed from RF was as-sessed using a validation dataset, splitting the dataset into training and validation subsets. For each data group, 15 % of the samples were randomly selected to apply the model and compute the accuracy indices. Similarly, validation dataset was used when comparing predictions of PTFs derived from RF and MLR using soil properties.
The relative importance of predictors for PTFs derived by RF was measured using the mean squared error of the regression using a method implemented into the RF package (Breiman, 2001). For PTFs devel-oped with MLR, the Relaimpo package was used. This package computes the average increase in the R-square when predictors are added to the regression equation (see Grömping, 2006).
Random forest
Random Forest (RF) modeling has the potential to improve predictions made using classification and regression trees (Breiman, 2001). Trees are constructed using a bootstrap of the entire dataset and the splits at each node are made from the best randomly selected subset of predictors from the entire suite of input vari-ables, which prevents over-fitting (Liaw and Wiener, 2002).
as-sessed by predicting the mean square error (MSE) of the “out-of-bag” (OOB) portion of the data at each tree, fol-lowed by averaging over the entire forest (Equation 4). RF modeling provides a measure of fit comparable to the R2 values of other models. This “pseudo R2” is labeled as “percent variance explained” and calculated using Equa-tion 5.
MSE
n zi z
OOB i
OOB
i n
=
(
−)
=
∑
1 2
1 ˆ
(4)
VARex MSE OOB
y
= −1 2 ˆ
α
(5)
In equations 4 and 5, zˆi OOB
is the mean out-of-bag prediction for the i-th observation, αˆy
2 is the total vari-ance of the dependent variable, calculated with n as the divisor, rather than n-1 (Liaw and Wiener, 2002).
The default setting for mtry is one third of the num-ber of predictors. Liaw and Wiener (2002) suggest test-ing this value by both doubltest-ing and halvtest-ing the default. For this study, the optimal parameter combination was selected by simulation, choosing the setting that gave the highest accuracy using one of the following values: mtry
= 3, 5, 10, 15, 30, 55, 80; ntree = 100, 500, 750, 1000, 1250, and number of variables in the terminal node of each tree from 3 to 5.
RF advantages include its assumption of free distribution of the data and its flexibility to work with categorical variables without the need to create nu-merical dummy variables (Sequeira et al., 2014). In addition, RF has the ability to rank predictor variables according to their importance in the model, which is done by calculating how much the estimate er-ror increases when “out-of-bag” data for a particular variable is removed from the analysis and the other variables are left intact. This is done on a tree-by-tree basis for the entire forest.
PTFs compiled from literature
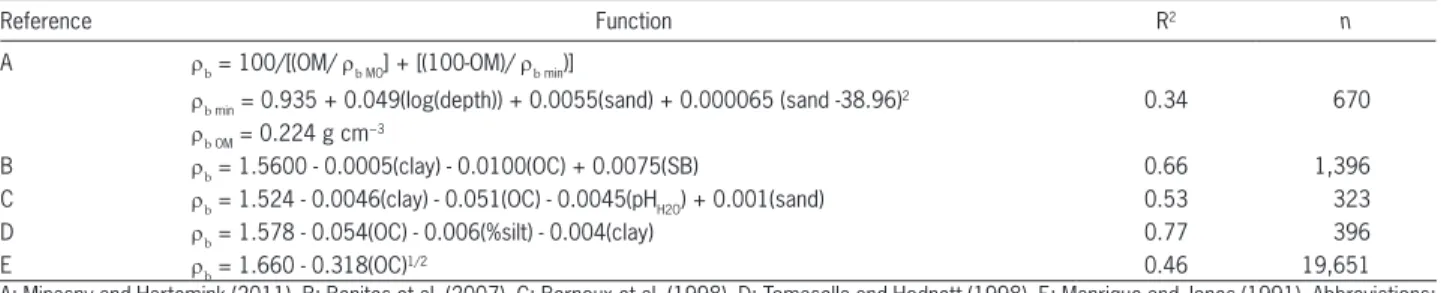
For comparison, PTFs from the literature were compiled based on equivalence in model and soil prop-erties used to develop the functions (Table 1). Among the reviewed so-called ‘compiled PTFs’, three functions were developed for Brazilian soils. Bernoux et al. (1998)
and Tomasella and Hodnett (1998) used soil profile data from the Amazon Region, whereas Benites et al. (2007) considered soil profile data from different states in the country. Alternatively, Manrique and Jones (1991) used profiles from the United States and several countries in Central America, while Minasny and Hartemink (2011) considered soil profiles from Tropical areas.
All compiled PTFs included OC content and at least one particle size class as predictor variables. Fur-ther, pH and SB were included respectively by Bernoux et al. (1998) and Benites et al. (2007). According to vari-ous studies (Dupouey et al., 1997; Idowu, 2011), there may be indirect relationships between soil pH and bulk density because of interactions with other soil properties such as clay type, exchangeable cations, porosity, and structure. Alternatively, Manrique and Jones (1991) pre-dicted ρb as a function of OC content only. None of the compiled PTFs considered thickness of horizon and CEC as possible predictors.
Results and Discussion
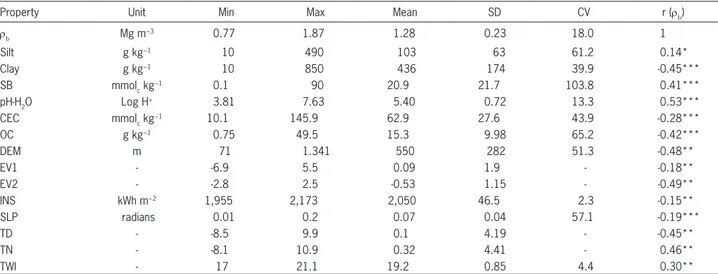
Descriptive statistics
The descriptive statistics for the data used to de-rive the PTFs are shown in Table 2. Bulk density ranges from 0.77 to 1.87 Mg m−3 with a mean of 1.28 Mg m−3. The highest coefficient of correlation (r) between ρb and the soil properties under consideration, when expressed in absolute terms, is observed for pH (0.53), followed by the clay content (-0.45), OC content (-0.42) and total bases (0.41). A negative correlation is observed between
ρb and clay content, CEC and OC content. The Pearson coefficient for correlation between environmental co-variates and ρb was higher for the slope (p < 0.01) and lower than 5 % for the other covariates. Overall, the magnitude of the correlation varied from -0.49 to 0.46 with p < 0.05.
PTFs developed using multiple linear regression The PTFs developed using all soil profile data, re-spectively data grouped into soil horizons and soil class-es, are presented in Table 3 according to their respective indexes of accuracy from cross-validation and validation (all data).
Table 1 − Summary of ‘compiled PTFs’ to estimate ρb.
Reference Function R2 n
A ρb = 100/[(OM/ρb MO] + [(100-OM)/ρb min)]
ρb min = 0.935 + 0.049(log(depth)) + 0.0055(sand) + 0.000065 (sand -38.96)2 0.34 670 ρb OM = 0.224 g cm
−3
B ρb = 1.5600 - 0.0005(clay) - 0.0100(OC) + 0.0075(SB) 0.66 1,396
C ρb = 1.524 - 0.0046(clay) - 0.051(OC) - 0.0045(pHH2O) + 0.001(sand) 0.53 323
D ρb = 1.578 - 0.054(OC) - 0.006(%silt) - 0.004(clay) 0.77 396
E ρb = 1.660 - 0.318(OC)1/2 0.46 19,651
The assessment of PTF accuracy showed a slightly smaller R2 when using external validation, compared to the PTF with the ‘leave-one-out’ approach. The valida-tion methods gave equal RMSE and the difference in performance can be related to the smaller size of the dataset available for validation.
Using cross validation, the general PTF based on the whole dataset had R2 = 0.47. For this function, the partial coefficient of determination (Table 4) shows that OC was the main predictor, accounting for 31 % of the total R2, followed by pH (27 %), clay content (26 %) and SB (17 %). Grouping did not lead to a significant im-provement per horizon. For B horizons, the function
pro-vided R2 4 % higher; the RMSE and ME were also higher. The PTF for A horizons was similar to that obtained us-ing all data.
As shown by Table 3, the grouping of soil classes did not increase accuracy of predictions. R2 varied from 0.21 to 0.43 with the highest value found for the PTF for Ferralsols and the lowest for Acrisols, while for Cambi-sols, R2 was 0.30. The functions underestimated ρ
b, as shown by the negative ME value for Acrisols and Cambi-sols. The RMSE was 0.15 Mg m−3 for Ferralsols and 0.16 Mg m−3 for all profile data combined.
Differently from our observations for profiles grouped according to main soil classes, Manrique and
Table 2 − Descriptive statistics for soil properties and environmental covariates used to develop PTFs for bulk density.
Property Unit Min Max Mean SD CV r (ρb)
ρb Mg m−3 0.77 1.87 1.28 0.23 18.0 1
Silt g kg−1 10 490 103 63 61.2 0.14*
Clay g kg−1 10 850 436 174 39.9 -0.45***
SB mmolc kg
−1 0.1 90 20.9 21.7 103.8 0.41***
pH-H2O Log H
+ 3.81 7.63 5.40 0.72 13.3 0.53***
CEC mmolc kg−1 10.1 145.9 62.9 27.6 43.9 -0.28***
OC g kg−1 0.75 49.5 15.3 9.98 65.2 -0.42***
DEM m 71 1.341 550 282 51.3 -0.48**
EV1 - -6.9 5.5 0.09 1.9 - -0.18**
EV2 - -2.8 2.5 -0.53 1.15 - -0.49**
INS kWh m−2 1,955 2,173 2,050 46.5 2.3 -0.15**
SLP radians 0.01 0.2 0.07 0.04 57.1 -0.19***
TD - -8.5 9.9 0.1 4.19 - -0.45**
TN - -8.1 10.9 0.32 4.41 - 0.46**
TWI - 17 21.1 19.2 0.85 4.4 0.30**
ρb = bulk density; SB = sum of exchangeable bases; pH in H2O (1:2.5 v/v); CEC = cation exchange capacity at pH 7; OC = organic carbon; DEM = elevation above the sea level; EV1 = first principal components of vegetation index; EV2 = second principal components of vegetation index; INS = solar radiation; TD = first principal components of monthly daytime surface temperature; TN = first principal components of monthly nighttime surface temperature; SLP = slope; TWI = topographic wetness index; SD = standard deviation; CV = coefficient of variation (%); r = Pearson's coefficient of correlation; Statistical significance: ***p < 0.01, **p < 0.05, *p < 0.1. All maps of covariates were generated at 100 by 100 m spatial resolution. Number of samples (242); PTF = pedotransfer functions.
Table 3 − Accuracy of PTFs for ρb derived using MLR for the whole dataset and data grouped according to major soil classes and horizons using leave-one-out and validation dataset.
Intercept Clay Silt SB OC CEC pH R2
adj ME RMSE n
All data (validation dataset)
0.9039322 -0.0044017 -0.0695201 0.1249228 0.41 0.0271 0.16 206
All data
1.075000 -0.0003877 0.001533 -0.007864 0.085800 0.47 0.0003 0.16 242
A horizon
1.618376 -0.001996 0.030326 -0.062456 -0.026794 0.48 0.0002 0.16 125
B horizon
0.9718094 -0.000312 0.0028462 -0.0118018 0.0975471 0.51 0.0128 0.17 117
Acrisols
1.456077 0.004871 -0.005451 -0.002490 0.21 -0.0001 0.16 82
Cambisols
0.7217441 -0.0008874 -0.0075855 0.1491163 0.30 -0.0027 0.16 36
Ferralsols
1.5950000 -0.0006553 0.003196 -0.001937 0.43 0.0232 0.15 115
SB = sum of exchangeable bases; OC = organic carbon content; CEC = cation exchange capacity at pH7; R2
Jones (1991) reported notable improvement for ρb esti-mated for data group according to soil classes at the sub-order level. However, in their study, soil water content at permanent wilting point was used as a possible covariate, although it is rarely available from routine soil surveys. Although Manrique and Jones (1991) considered a data-set of approximately 12,000 samples, R2 of their best per-forming PTF was 0.58, while for their simplest model (as considered for comparison in the present work) R2 was 0.46. Later R2 is considered comparable with the accuracy of the PTF developed here for Rio Doce basin (R2 = 0.47).
The use of MLR with mixed-data model (soil prop-erties and environmental covariates, excluding pedo-logical and geopedo-logical data) resulted in 5 % increase of performance (R2 = 0.52); RMSE and ME were equal to those observed for the model using all data (0.16 Mg m−3 and 0.003, respectively). Among the step-wise selected predictor variables, soil properties had the highest rela-tive importance (clay (26 %), pH (21 %) and OC (19 %)) vis-à-vis the environmental covariates ((EV2 (16 %), TN (13 %) and TWI (5 %)).
Studies for predicting ρb using soil data grouped into classes have been assessed using different criteria. Bernoux et al. (1998) estimated ρb for A, and B + C ho-rizons using soils from the Brazilian Amazon basin and found no significant differences in R2 when compared to the function developed for the whole set of data. Simi-larly, the PTFs of Benites et al. (2007) to estimate ρb for specific soil depths (0-30 and 30-100 cm) only had a 7 % higher R2 compared to PTFs that considered all data.
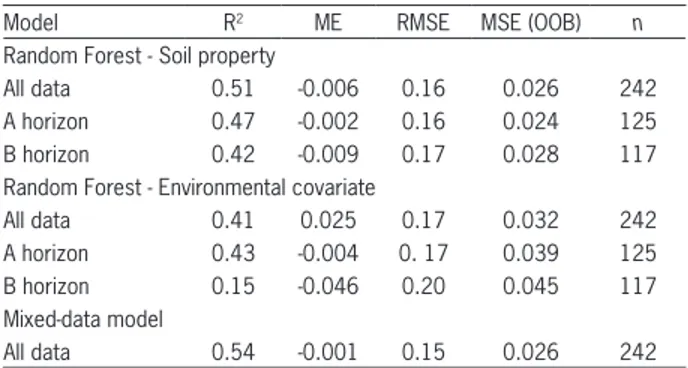
PTFs derived from Random Forest
Similarly, for the MLR-based approach, RF consid-ers a number of environmental covariates. Initial studies for the Rio Doce dataset showed that RF performed best with a configuration of 3-mtry, 10-node size and 750 trees using soil properties, whereas with environmental covari-ates the best setup was 5-mtry, 10-node size and 500 trees.
The RF-based PTF developed using only soil prop-erties has R2 = 0.51 and RMSE of 0.16 Mg m−3. The
function underestimated ρb as reflected by the negative ME value. Alternatively, using environmental covariates, the PTF yielded an R2 = 0.41 and RMSE 0.17 Mg m−3; the ME shows that ρb is overestimated using environ-mental covariates with all data and underestimated us-ing data from A and B horizons (Table 5).
The relative importance of individual variables to the PTFs, developed using soil properties respective en-vironmental covariates (Table 6), shows that the main predictors of PTFs developed using soil properties are SB, OC, and clay content, which accounted respectively to a 29 %, 27 % and 24 % decrease for the MSE predic-tion using all data. Silt presented a negative contribupredic-tion (-4) to the PTF for the B horizons, and therefore was left out of the prediction model. Best results were observed when considering all data, compared to the individual prediction for A and B horizons with R2 = 0.47 and 0.42, respectively (Table 5).
Of the categorical covariates, the pedological map contributed most (28 %) while the relative importance of the geological map was 18 %. Similarly, Hengl et al. (2014) highlighted the importance of such maps as pre-dictors in broad scale digital soil mapping. For the con-tinuous environmental covariates, the three main predic-tors were the second principal components of vegetation (39 %), DEM (32 %), and nighttime surface temperature (30 %). The other environmental covariates (i.e. slope, solar radiation, and topographic wetness index) contrib-uted from 21 to 25 % to reduce the MSE.
The relative importance of environmental pre-dictors in PTFs for the A and B horizons markedly de-creased with depth (Table 6), reflecting the nature of surface-based landscape maps and remote sensing data from MODIS. DEM and EV2 were the main predictors of ρb in both horizons. For A horizons, surface tempera-ture for day and nighttime (TD/TN) were also important. Predictors with negative importance were not included to the final model. Validation with external data showed
Table 4 − Relative importance of predictors expressed by the partial coefficient of determination in PTFs developed for ρb using MLR
for the whole dataset and data sets grouped according to horizons respectively and major soil classes.
Soil
property All data
Horizon Soil class
A B Acrisols Cambisols Ferralsols %
---CEC 29 17 22
Clay 26 23 15 62
OC 31 30 27 26 28
pH 27 32 49
SB 17 26 57 16
Silt 18 23
SB = sum of exchangeable bases; OC = organic carbon; CEC = cation exchange capacity pH7; R2 = partial coefficient of determination; MLR = multi-linear regression; PTF = pedotransfer functions.
Table 5 − Accuracy of PTFs for ρb developed with RF using soil properties respectively environmental covariates and mixed-data model MLR model.
Model R2 ME RMSE MSE (OOB) n
Random Forest - Soil property
All data 0.51 -0.006 0.16 0.026 242
A horizon 0.47 -0.002 0.16 0.024 125
B horizon 0.42 -0.009 0.17 0.028 117
Random Forest - Environmental covariate
All data 0.41 0.025 0.17 0.032 242
A horizon 0.43 -0.004 0. 17 0.039 125
B horizon 0.15 -0.046 0.20 0.045 117
Mixed-data model
All data 0.54 -0.001 0.15 0.026 242
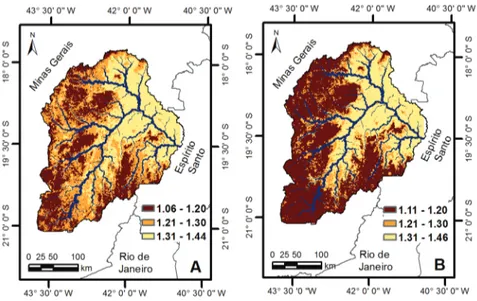
an R2 of 0.43 and 0.15, respectively, for PTF for A and B horizons. The PTF-derived ρb maps for A and B horizons are shown in Figure 2. This information may be used, for example, in subsequent studies of soil organic carbon stocks and changes in the Rio Doce basin
Estimating ρb from freely-available environmental covariates is supported by the fact that the cost for soil sampling can be prohibitive on a large scale(Taalab et al., 2013). Furthermore, the use of remote sense data and auxiliary maps in soil modeling makes this approach very promising for areas with limited soil data.Martin et al. (2009) included land use to adjust PTFs whereas Calhoun et al. (2001) included parent material. Alterna-tively, Jalabert et al. (2010) spatially estimated ρb using a mixed data source, combining soil properties and maps of environmental covariates.
The mixed-data MLR model, which consid-ers soil properties and environmental covariates as predictors, performed somewhat better (R2 = 0.54; RMSE = 0.15) than the PTFs developed for the two separate groups (Table 5). Similar relative importance of the four main predictors (soil properties SB, OC, Clay and pH, resp. environmental covariates EV2, DEM, TN, and pedological map) are reported in Table 6. These findings suggest that, for ρb mapping pur-poses, a dual approach may be beneficial. First, apply the PTF derived from soil properties to fill gaps in horizons with missing ρb data and second, use envi-ronmental covariates to obtain spatial estimates for
ρb. This dual approach could be of great interest for regions with limited soil legacy data, yet adequate co-variate maps.
Table 6 − Relative importance measured by percentage decrease in mean squared error (MSE) due to permutation of variables in PTFs for ρb developed using RF with environmental covariates, soil properties, resp. the mixed-data model that considers environmental covariates and soil properties.
Environmental covariate
Random Forest model Mixed-data model
All data A Horizon B Horizon Soil property All data A horizon B horizon Envir. covariate Soil property --- % --- %
---EV2 39 21 12 SB 29 30 14 13 15
DEM 32 16 11 OC 27 23 21 12 11
TN 30 14 3 Clay 24 14 16 12 19
Pedological 28 1 -3 pH 19 14 15 9 17
EV1 25 -4 -3 CEC 16 3 17 3 10
INS 23 -3 1 Silt 2 5 -4 3 2
TWI 23 4 1 4
TD 22 10 2 8
SLP 21 1 -2 1
Geological 18 1 6 4
SLP = slope; DEM = elevation above the sea level; TWI = topographic wetness index; INS = solar radiation; EV1 = first principal components of vegetation index; EV2 = second principal components of vegetation index; TD = first principal components of the monthly series of daytime surface temperature; TN = first principal components of the series of monthly nighttime surface temperature; CEC = cation exchange capacity at pH7; OC = organic carbon content; SB = sum of exchangeable bases; PTF = pedotransfer functions. See text for details about the Random Forest (RF) respectively mixed-data model.
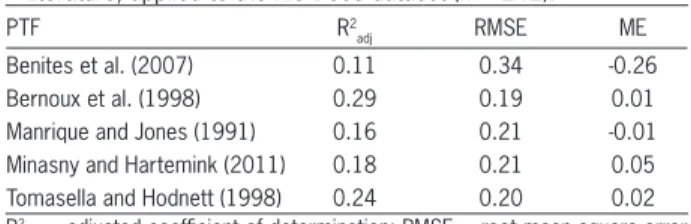
Table 7 − Accuracy of estimates for PTFs for ρb, compiled from the literature, applied to the Rio Doce dataset (n = 242).
PTF R2
adj RMSE ME
Benites et al. (2007) 0.11 0.34 -0.26
Bernoux et al. (1998) 0.29 0.19 0.01
Manrique and Jones (1991) 0.16 0.21 -0.01
Minasny and Hartemink (2011) 0.18 0.21 0.05
Tomasella and Hodnett (1998) 0.24 0.20 0.02
R2
adj = adjusted coefficient of determination; RMSE = root mean square error (Mg m−3); ME = mean error; PTF = pedotransfer functions.
As indicated, RF supports punctual and spatial predictions. However, it does not generate an equation for estimating single ρb data without having to rerun the model. Still, RF has been shown to be a promising model to obtain ρb data, particularly when using environmental covariates that allow for direct spatial predictions. Us-ing soil properties alone, on the other hand, implies that only point data will be generated, requiring further steps to allow spatial predictions.
PTFs compiled from the literature
The ‘compiled PTFs’, as derived from the litera-ture, applied to the Rio Doce dataset, estimated ρb with R2 ranging from 0.11 to 0.29, while RMSE, it varied from 0.19 to 0.34 Mg m−3 (Table 7). Among the PTFs developed for soil profiles from Brazil, the function proposed by Benites et al. (2007) presented the lowest R2 (0.11) and gave the largest error of estimates, RMSE = 0.34 Mg m−3. Alternatively, PTFs developed by Ber-noux et al. (1998) and Tomasella and Hodnett (1998), also using soils from Brazil, showed the best perfor-mance among the evaluated functions with R2 = 0.29, and 0.24 respectively, and RMSE = 0.19 and 0.20Mg m−3. The poorer PTF performance proposed by Benites et al. (2007) may be related to the larger variability of the dataset used to develop their function, as these data were collected for geographically scattered locations across Brazil. The functions that considered soil data from a wider range of tropical countries (Minasny and Hartemink, 2011) data from North and Central Ameri-ca (Manrique and Jones, 1991) showed similar results, with R2 = 0.18 and 0.16, respectively. Although these functions performed slightly better than the function proposed by Benites et al. (2007), they did not perform better than the functions developed specifically for Bra-zil. The PTFs proposed by Benites et al. (2007), and Manrique and Jones (1991), underestimated ρb, as re-flected by a negative value for ME. The other functions under consideration here gave a positive value for ME, hence overestimated ρb (Table 7).
None of the ‘compiled PTFs’ performed better than the PTFs developed in our study for the Rio Doce basin. PTFs developed using RF and environmental co-variates (R2 = 0.41) explained more variation of ρ
b than the best ‘compiled’ PTF (R2 = 0.29) that considered soil properties (Tables 5 and 7). This shows that more
accu-rate estimates can be achieved using PTFs developed directly using data for the study area to which they will be applied (e.g. to compute stocks of organic carbon).
Conclusions
PTFs developed using MLR and RF estimated ρb from soil properties more accurately than from envi-ronmental covariates. Similar results were observed when ρb was estimated from soil properties, with a slightly better performance of RF (R2 = 0.51) over MLR (R2 = 0.47).
RF showed good performance when only environ-mental covariates were used (R2 = 0.41). Because this approach allows to directly generate spatial representa-tions for ρb,it is proposed as a feasible alternative to de-rive ‘first estimates’ for ρb for areas lacking soil survey information. Consideration and availability of more de-tailed environmental datasets, however, would probably lead to better predictions.
Grouping data into major soil classes did not im-prove ρb estimates. There was no significant difference between predictions obtained with the general PTF, us-ing all data, and the PTF for Ferralsols. For groups by horizons, estimates were more accurate for superficial than for subsurface horizons, both for soil properties and environmental covariates. Likewise, grouping according to horizon did not improve the PTFs.
The estimates of ρb obtained with the PTFs com-piled from the literature presented lower accuracy than those derived from the PTFs derived for our study. The later outperformed the compiled PTF, as reflected by 18 % to 36 % higher R2.
The best PTFs developed here will be used to cal-culate soil organic carbon stocks in the Rio Doce basin to provide baseline estimates.
The study indicated that, for the Rio Doce basin, the performance of a PTF depends on both the covari-ates and the type of model used.
Acknowledgements
The Minas Gerais State Foundation for Research Support (FAPEMIG) is gratefully thanked for funding the data collection and analysis (grant number: APQ-03862-09). The Coordination for the Improvement of Higher Level Personnel (CAPES) provided a scholarship for the fulfillment of the research, part of which was carried out by the first author as a post doc guest researcher at ISRIC – World Soil Information, The Netherlands. The Editor’s and anonymous reviewer’s insightful comments helped to improve the manuscript.
References
Batjes, N.H. 1996. Total carbon and nitrogen in the soils of the world. European Journal of Soil Science 47: 151-163.
Benites, V.M.; Machado, P.L.O.A.; Fidalgo, E.C.C.; Coelho, M.R.; Madari, B.E. 2007. Pedotransfer functions for estimating soil bulk density from existing soil survey reports in Brazil. Geoderma 139: 90-97.
Bernoux, M.; Arrouays, D.; Cerri, C.; Volkoff, B.; Jolivet, C. 1998. Bulk densities of Brazilian Amazon soils related to other soil properties. Soil Science Society of America 62: 743-749.
Bouma, J. 1989. Using soil survey data for quantitative land evaluation. v. 9, p. 177-213. In: Stewart, B.A., ed. Advances in soil science. Springer, New York, NY, USA.
Breiman, L. 2001. Random forests. Machine Learning 45: 5-32. Calhoun, F.G.; Smeck, N.E.; Slater, B.L.; Bigham, J.M.;
Hall, G.F. 2001. Predicting bulk density of Ohio soils from morphology, genetic principles, and laboratory characterization data. Soil Science Society of America 65: 811-819.
CGIAR. 2014. Consortium for spatial information. SRTM 90m digital elevation data. Available at: http://srtm.csi.cgiar.org/ [Accessed Sept 8, 2014]
Companhia de Pesquisa de Recursos Minerais [CPRM]. 2004. Brazilian Geological Chart to the Million, 1:1,000,000. Geological Survey of Brazil. CPRM, Brasília, DF, Brazil. CD-ROM = Carta Geológica do Brasil ao Milionésimo (Folhas SE 23 / 24, SF 23) (in Portuguese).
Dupouey, J.L.; Thimonier, A.; Behr, P. 1997. Bulk density of forest soils in northeastern France in relation to soil chemical and physical properties. Etude et Gestion des Sols 4: 43-51 (in French, with abstract in English).
Empresa Brasileira de Pesquisa Agropecuária [EMBRAPA]. 1997. Manual of Soil Analysis Methods = Manual de Métodos de Análise de Solo. 2ed. Embrapa, Rio de Janeiro, RJ, Brazil (in Portuguese).
Fundação Estadual do Meio Ambiente [FEAM]. 2011. Soil Survey and Land Use Capability of Rio Doce Basin, State of Minas Gerais = Levantamento de Solos e Aptidão Agrícola das Terras da Bacia do Rio Doce, Estado de MG. Report and Digital Soil Map, 1:600,000. FEAM, Belo Horizonte, MG, Brazil (in Portuguese).
Han, G.; Zhang, G.; Gong, Z.; Wani, G. 2012. Pedotransfer functions for estimating soil bulk density in China. Soil Science 177: 158-164.
Hengl, T.; Jesus, J.M.; Macmillan, R.A.; Batjes, N.H.; Heuvelink, G.B.M.; Ribeiro, E.; Samuel-Rosa, A.; Kempen, B.; Leenaars, J.G.B.; Walsh, M.G.; Gonzalez, M.R. 2014. SoilGrids1km - Global soil information based on automated mapping. PLoS ONE 9: e114788.
Hengl, T.; Heuvelink, G.B.M.; Tadić, M.P.; Pebesma, E.J. 2012. Spatio-temporal prediction of daily temperatures using time-series of MODIS LST images. Theoretical and Applied Climatology 107: 265-277.
Idowu, O.J. 2011. Organic matter and pH are the most important properties to consider when predicting soil aggregate stability. Communications in Soil Science and Plant Analysis 34: 695-708.
Instituto Mineiro de Gestão das Águas [IGAM]. 2010. Integrated Plan for the Water Resources of the Rio Doce Basin and Action Plans of Water Management for Units of Planning and Management of Water Resources in the Framework of the Rio Doce Basin = Plano Integrado de Recursos Hídricos da Bacia do Rio Doce e dos Planos de Ações de Recursos Hídricos para as Unidades de Planejamento e Gestão de Recursos Hídricos no Âmbito da Bacia do Rio Doce. IGAM, Belo Horizonte, MG, Brazil. (Technical Report. ECOPLAN/LUME) (in Portuguese). Isaaks, E.H.; Srivastava, R.M. 1989. An Introduction to Applied
Geostatistics. Oxford University Press, New York, NY, USA. Jalabert, S.S.M.; Martin, M.P.; Renaud, J.P.; Boulonne, L.; Jolivet,
C.; Montanarella, L.; Arrouays, D. 2010. Estimating forest soil bulk density using boosted regression modeling. Soil Use and Management 26: 516-528.
Jenny, H. 1941. Factors of Soil Formation: A System of Quantitative Pedology. McGraw-Hill, New York, NY, USA.
Grömping, U. 2006. Relative importance for linear regression in R: the package relaimpo. Journal of Statistical Software 17: 1-27. Liaw, A.; Wiener, M. 2002. Classification and regression by
random forest. R News 2-3: 18-22.
Manrique, L.A.; Jones, C.A. 1991. Bulk-density of soils in relation to soil physical and chemical properties. Soil Science Society of America 55: 476-481.
Martin, M.P.; Wattenbach, M.; Smith, P.; Meersmans, J.; Jolivet, C.; Boulonne, L.; Arrouays, D. 2011. Spatial distribution of soil organic carbon stocks in France. Biogeosciences 8: 1053-1065. Martin, M.P.; Lo Seen, D.; Boulonne, L.; Jolivet, C.; Nair, K.M.;
Bourgeon, G.; Arrouays, D. 2009. Optimizing pedotransfer functions for estimating soil bulk density using boosted regression trees. Soil Science Society of America 73: 485-493. McBratney, A.B.; Minasny, B.; Tranter, G. 2011. Necessary
meta-data for pedotransfer functions. Geoderma 160: 627-629. McBratney, A.B.; Minasny, B.; Cattle, S.R.; Vervoort, R.W.
2002. From pedotransfer functions to soil inference systems. Geoderma 109: 41-73.
McBratney, A.B.; Santos, M.L.M.; Minasny, B. 2003. On digital soil mapping. Geoderma 117: 3-52.
Minasny, B.; Hartemink, A.E. 2011. Predicting soil properties in the tropics. Earth Science Reviews 106: 52-62.
Ministério do Meio Ambiente [MMA]. 2006. Mapping of Native Vegetation of Brazilian Biomes: Atlantic Forest Biome. Digital Map, Scale 1:250.000 = Mapeamento da Cobertura Vegetal Nativa dos Biomas Brasileiros: Bioma Mata Atlântica. MMA, Brasilia, DF, Brazil (in Portuguese).
MODIS. 2013. MOD13A3/ MOD11A2. NASA EOSDIS land processes DAAC, USGS Earth Resources Observation and Science (EROS) Center, Sioux Falls, South Dakota Available at: https://lpdaac.usgs.gov/data_access/glovis [Accessed Aug 5, 2013]
Nanko, K.; Ugawa, S.; Hashimoto, S.; Imaya, A.; Kobayashi, M.; Sakai, H.; Ishizuka, S.; Miura, S.; Tanaka, N.; Takahashi, M.; Kaneko, S. 2014. A pedotransfer function for estimating bulk density of forest soil in Japan affected by volcanic ash. Geoderma 213: 36-45.
RADAMBRAZIL Project. 1983. Natural Resource Survey. Chart SE.24: Rio Doce. IBGE, Rio de Janeiro, RJ, Brazil (in Portuguese, with abstract in English).
Ruiz, H.A. 2005. Increased accuracy in particle-size analysis by sampling the silt + clay suspension. Revista Brasileira de Ciência do Solo 29: 297-300 (in Portuguese, with abstract in English).
Sequeira, C.H.; Wills, S.A.; Seybold, C.A.; West, L.T. 2014. Predicting soil bulk density for incomplete databases. Geoderma 213: 64-73.
Souza, E.; Hengl, T.; Kempen, B.; Heuvelink, G.B.M.; Fernandes Filho, E.I.; Schaefer, C.E.G.R. 2014. Spatial prediction methods for mapping soil properties in Brazil: Rio Doce basin. p. 267-271. In: Arrouays, D.; McKenzie, N.; Hempel, J.; Forges, A.R.; McBratney, A.B., eds. GlobalSoilMap: basis of the global spatial soil information system. CRC Press, Boca Raton, FL, USA. Taalab, K.P.; Corstanje, R.; Creamer, R.; Whelan, M.J. 2013.
Modeling soil bulk density at the landscape scale and its contributions to C stock uncertainty. Biogeosciences 10: 4691-4704.
Tomasella, J.; Hodnett, M.G. 1998. Estimating soil water retention characteristics from limited data in Brazilian Amazonia. Soil Science 163: 190-202.
Tranter, G.; Minasny, B.; McBratney, A.B.; Murphy, B.; McKenzie, N.J.; Grundy, M.; Brough, D. 2007. Building and testing conceptual and empirical models for predicting soil bulk density. Soil Use and Management 23: 437-443.
Walkley, A.J.; Black, I.A. 1934. Estimation of soil organic carbon by the chromic acid titration method. Soil Science 37: 38-39. Wösten, J.H.M.; Pachepsky, Ya.A.; Rawls, W.J. 2001. Pedotransfer