www.soil-journal.net/2/25/2016/ doi:10.5194/soil-2-25-2016
© Author(s) 2016. CC Attribution 3.0 License.
SOIL
Pedotransfer functions for Irish soils – estimation of bulk
density (
ρ
b
) per horizon type
B. Reidy, I. Simo, P. Sills, and R. E. Creamer
Teagasc, Johnstown Castle, Environment Research Centre, Co. Wexford, Ireland
Correspondence to:B. Reidy ([email protected])
Received: 20 September 2015 – Published in SOIL Discuss.: 9 October 2015 Accepted: 28 December 2015 – Published: 18 January 2016
Abstract. Soil bulk density is a key property in defining soil characteristics. It describes the packing structure of the soil and is also essential for the measurement of soil carbon stock and nutrient assessment. In many older surveys this property was neglected and in many modern surveys this property is omitted due to cost both in laboratory and labour and in cases where the core method cannot be applied. To overcome these oversights pedotransfer functions are applied using other known soil properties to estimate bulk density. Pedotransfer func-tions have been derived from large international data sets across many studies, with their own inherent biases, many ignoring horizonation and depth variances. Initially pedotransfer functions from the literature were used to predict different horizon type bulk densities using local known bulk density data sets. Then the best performing of the pedotransfer functions were selected to recalibrate and then were validated again using the known data. The predicted co-efficient of determination was 0.5 or greater in 12 of the 17 horizon types studied. These new equations allowed gap filling where bulk density data were missing in part or whole soil profiles. This then al-lowed the development of an indicative soil bulk density map for Ireland at 0–30 and 30–50 cm horizon depths. In general the horizons with the largest known data sets had the best predictions, using the recalibrated and validated pedotransfer functions.
1 Introduction
Soils are a vital global resource providing a range of ecosys-tem services, upon which we depend. Such services include the platform on which we produce food, fibre and raw ma-terials, purifying and regulating water, cycling of carbon and nutrients, and providing a habitat for biodiversity (EU, 2002). To understand many of the processes on-going in soils that deliver these ecosystem services, we must quantify soil char-acteristics, as these vary considerably according to soil type. Bulk density (ρb) is defined as the oven-dry mass per unit volume of a soil (IUSS 20 Working Group, 2006). This is an integral soil property, as it not only describes the packing structure of soils (Dexter, 1988), but is essential for the mea-surement of soil carbon and nutrient stock assessment (Ellert and Bettany, 1995). Bulk density measures can also describe the permeability of a soil, whereby it defines drainage char-acteristics (Arya and Paris, 1981) and is used in pedotransfer functions that model soil hydraulic characteristics (Murphy
et al., 2003; Van Alphen et al., 2001; Minasny and McBrat-ney, 2007). Bulk density can also indicate compacted lay-ers resulting from machinery or animal trafficking (Saffih-Hdadi, 2009), which can then impact the nutrient availability in soils (Douglas and Crawford, 1998).
2009). Pedotransfer functions (PTF) based on readily mea-sured soil attributes, such as organic carbon and clay content, show strong potential to replaceρbmeasurements as their di-rect measurement are not feasible or lacking from historical records.
However, bulk density has been found to vary with depth (Leonaviˇciut˙e, 2000) and soil type (Manrique and Jones, 1991), while the use of generic pedotransfer functions can result in large errors in the calculation of SOC stocks. In say-ing this, De Vos indicates there is a need for specific PTF to be calibrated and validated on a regional basis (De Vos et al., 2005). Others take this further and report that PTF should be developed for particular horizon types or designations (Su-uster et al., 2011). Correlation with international data sets can be employed to generate PTF where local information is lacking. There is information available from large interna-tional soil survey databases (Hollis et al., 2006; Batjes, 2005, 2009), but in many cases bulk density is poorly documented. In these instances the use of splines or models of bulk density are then used with their own inherent variances, which can be problematic without large validation data sets (Lettens et al., 2005).
With the launch of the Irish Soil Information System (Irish SIS) and the publication of the 3rd edition of the Irish soil map, there is the opportunity to measure, interpolate, and map bulk density values on a national scale. The latest soil map for Ireland has been published online by the Irish soil information system (Creamer et al., 2014).
The research presented in this paper will use new data generated by the Irish SIS to provide primary data for the calculation of PTF at the soil horizon level. This was done using soil bulk density measurements which were available for 15.9 % of the soil profiles described in Ireland in the last 40 years. In addition to this, PTF from the literature were used with known texture and organic carbon data to develop the calculations for bulk density. These PTF were then recal-ibrated for Irish soil horizons, whereρbwas measured. The PTF were then applied to the soil horizons with unknownρb. This allowed the calculation of soil bulk density to a depth of 50 cm for all soil profiles described. Using the PTF, bulk density is now known at different horizon designations. This has led to an indicative map of soil bulk density in Ireland being developed.
2 Materials and methods
2.1 Soil profiles
From 2012 to 2014 the Irish SIS sampled 246 soil pits as part of its field survey. The pits were selected by using an extensive auger survey of the Irish SIS. Pits were dug in ar-eas where a high density of augers were found representing a particular soil type. From a practical position multiple pits were selected within a 10 km×10 km area when possible. This allowed excavation costs to be reduced greatly. The pits
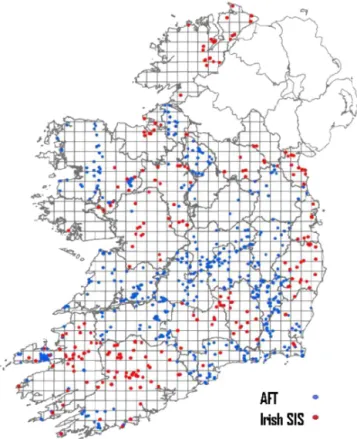
Figure 1.Location of Irish soil information system (Irish SIS) and An Foras Talúntais (AFT) soil profile pits. The blue circles corre-spond to AFT and the red circles correcorre-spond to Irish SIS.
were distributed across 16 counties in Ireland (Fig. 1). At each site a pit was excavated to approximately 1 m, where this was not possible, it was excavated to the depth of under-lying bedrock preceding this. The pit face was at least 1 m wide. In total there were 1028 soil horizons identified (Simo et al., 2014). Within these pits, 470 horizons were sampled for bulk density (ρb). The remainder could not be measured for bulk density as the stainless steel rings were unusable due to coarse fragments. Therefore these horizons (528) required ρbpredictions and pedotransfer functions were developed for this, detailed below.
2.2 Legacy data
an-alytical data for a number of soil parameters, such as texture and SOC. In total there were 2950 horizons described across 809 soil profiles located across the whole of Ireland (Fig. 1).
2.3 Field sampling
In the centre of each horizon, a smooth undisturbed ver-tical soil surface was prepared for ρb sampling. Three 50 mm×50 mm stainless steel rings were hammered into place. When possible, the rings were taken at 25, 50 and 75 cm from the edge of the pit wall. Care was taken to just fill the ring and not compact the soil. The ring plus soil was then removed from the surface of the soil matrix with as little disturbance as possible using a flat sided trowel. Any excess soil was trimmed from the ring edges before being placed in a sealed plastic bag. Also if protruding coarse fractions were present, they were marked and retained for cutting in the lab-oratory. For other soil parameters (texture, SOC, pH, cation exchange capacity, Fe/Al content), within the same horizon 2 kg of soil was sampled with a trowel into plastic bags and then sealed.
2.4 Bulk density analysis
The laboratory method followed that of the method applied during the few sites collected during the An Foras Talún-tais survey (Massey et al., 2014). This method corresponds to ISO 11272:1998 – Soil Quality Part 5: Physical methods Sect. 5.6 – Determination of dry bulk density. The primary difference between the ISO and An Foras Talúntais method-ologies is that the ISO does not account for stone mass and volume in its core method, whereas the methodology applied here does include this Eq. (1).
To calculate bulk density (stone-free):
ρb
g cm−3
=(Md−Ms)/(V−Vs), (1)
where Md=oven dry soil material weight (g), Ms=oven dry stone weight (g), V=volume of soil core (cm−3), Vs=volume of stones (mL). The resultingρb values were the mean of three field replicate samples.
2.5 Pedotransfer functions review and selection
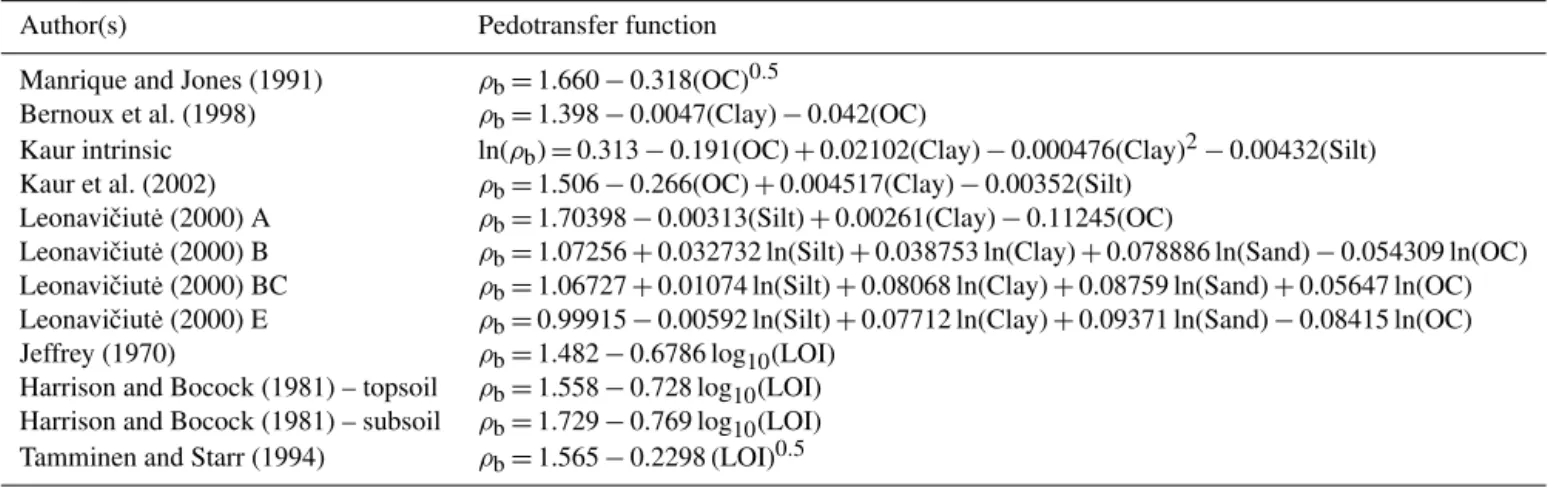
Following a detailed review of the literature, 22 pedo-transfer functions (PTF) were collated (Alexander, 1980; Adams, 1973; Rawls and Brakensiek, 1985; Honeysett and Ratkowsky, 1990; Federer, 1983; Huntington et al., 1989; Manrique and Jones, 1991; Bernoux et al., 1998; Leonav-iˇciut˙e, 2000; Kaur et al., 2002; Jeffrey, 1970; Harrison and Bocock, 1981; Tamminen and Starr, 1994). A first stage as-sessment was conducted using the Irish SIS data whereρb information was available for a range of soil horizon types. At this stage several (n=10) PTFs were removed as nega-tive and/or extremely low or high values were obtained and
the PTF did not appear to suit Irish data sets. The best re-maining 12 PTFs for the various horizon types were then se-lected for use in further investigation (Table 2).These PTFs were chosen from the particular papers due to their de-velopment using high sample number (n >100); sampling depth to at least 80 cm; wide range of soils covered and statistical evaluation (R2). In most cases topsoils and sub-soils were investigated and in others particular horizon types were investigated. For mineral soils eight PTFs were applied: Manrique and Jones (1991), Bernoux et al. (1998), Leon-aviˇciut˙e (2000) (x4), Kaur et al. (2002) (x2). For organic soils four PTFs were applied: Jeffrey (1970), Harrison and Bocock (1981), Manrique and Jones (1991), Tamminen and Starr (1994) (Table 2). As these PTF required soil organic carbon data, soil texture data and loss on ignition data, the methods below were applied to samples from the field cam-paign.
2.6 Soil organic carbon analysis
The soil was placed on aluminium trays and placed in an oven at 40◦C for 4 days. The dry weight was recorded and the soil sieved to 2 mm and stored. A LECO TrueSpec CN elemental analyser was used to measure SOC. Concentrated hydrochloric acid was used to remove inorganic carbon. The method followed that of Massey et al. (2014), which is an adaptation of Organic Application Note of the analysis of Carbon and Nitrogen in Soil and Sediment (LECO Corpo-ration). This method corresponds to ISO 10694: 1995 – Soil quality Part 3: Chemical methods Sect. 3.8 – Determination of organic and total carbon after dry combustion (elemental analysis). The soils in the AFT survey had organic carbon es-timated by the Walkley-Black dichromate oxidation method as described by Jackson (1958) and modified for colorimet-ric estimation. A comparison of archive samples using both methods was comparable with anR2of 97 %.
2.7 Soil texture analysis
analysed by both laboratories (85.4 % of soil samples were in agreement in textural class).
2.8 Loss on ignition
The soil organic matter content was estimated via loss on ig-nition (LOI) of any sample found to be over 10 % organic carbon via the elemental analyser. A subsample of the 2 mm dried and sieved soil was dried initially at 105◦C, cooled, and reweighed and then placed in a muffle furnace at 550◦C for 16 h. The difference in mass was equivalent to the organic matter content. This method is described in detail by Massey et al. (2014), which corresponds to BS EN 13039:2000 – Soil improvers and growing media – Determination of organic matter content and ash.
2.9 AFT and Irish SIS horizons
The horizon designations in the AFT survey were correlated to modern Irish Soil Information System definitions (Ta-ble 1). The Irish SIS designations are similar to the World Reference Base (WRB) system except for O, AB and Cr hori-zons which are equivalent to H, BA and CR in the WRB. The AFT designations were based on the soil horizon classi-fication of soil survey staff, USDA (1960). When the equiv-alent horizon designation was identified the newly derived PTF could be applied to all horizons of this type. The soil horizon designation Ah indicating a lack of cultivation had no equivalent in the AFT records. The AFT survey did not record a non-cultivated A horizon.
2.10 Evaluation of PTFs
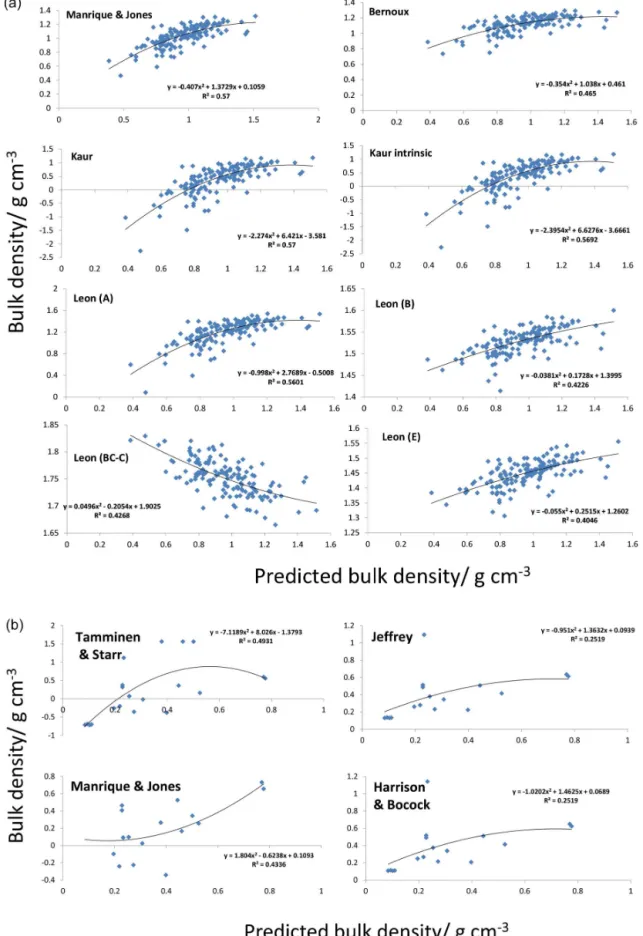
The individual ρb values were grouped together based on horizon designation. Each individual observedρbvalue was predicted by each of the eight PTF in the case of mineral soils and the four PTF in the case of organic soils. A polynomial regression equation was generated for observed versus pre-dictedρbwithin each horizon type per PTF. The coefficient of determination (R2) was compared across the PTF (Fig. 2a and Table 4).
The same data points were then compared using comple-mentary prediction quality indices (De Vos et al., 2005). Here the quality of the prediction was determined via Eq. (2), the mean predicted error (MPE); Eq. (3), the standard devia-tion of the predicdevia-tion error (SDPE); Eq. (4), the root mean squared prediction error (RMSPE); and Eq. (5) and the pre-diction coefficient of determination (Rp2). These are defined as
MPE=1
n
n
X
i=1
(P b, iˆ −P b, i) (2)
SDPE= v u u t 1 n−1
n
X
i=1
(P b, iˆ −P b, i)MPE2 (3)
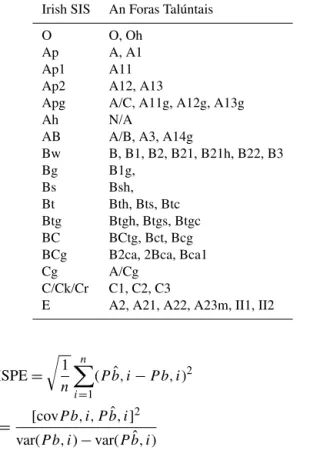
Table 1.Irish SIS horizon designations used in this study and equiv-alent horizon titles used in the national soil survey by An Foras Talúntais.
Irish SIS An Foras Talúntais
O O, Oh
Ap A, A1
Ap1 A11
Ap2 A12, A13
Apg A/C, A11g, A12g, A13g
Ah N/A
AB A/B, A3, A14g
Bw B, B1, B2, B21, B21h, B22, B3
Bg B1g,
Bs Bsh,
Bt Bth, Bts, Btc Btg Btgh, Btgs, Btgc BC BCtg, Bct, Bcg BCg B2ca, 2Bca, Bca1
Cg A/Cg
C/Ck/Cr C1, C2, C3
E A2, A21, A22, A23m, II1, II2
RMSPE= r 1 n n X i=1
(P b, iˆ −P b, i)2 (4)
Rp2= [covP b, i, ˆ P b, i]2
var(P b, i)−var(P b, iˆ ) (5)
wherePb,i, andP b, iˆ are the observed and predictedρb val-ues, respectively;nthe number of observations; and var and cov, variance and the covariance function, respectively. MPE allows the evaluation of the bias of the PTF. The SDPE shows the random variation of the predictions after correction for global bias. The RMSPE is the overall error of the prediction. Rp2is a measure of the strength of the linear relationship be-tween measurements and predictions, and indicates the frac-tion of the variafrac-tion that is shared between them. The PTF generating the variousRp2values were compared (Table 5).
2.11 Calibration of the PTF
Table 2.Published pedotransfer functions with corresponding authors used in this study. OC is organic carbon.ρbis bulk density in g cm−3.
Author(s) Pedotransfer function
Manrique and Jones (1991) ρb=1.660−0.318(OC)0.5
Bernoux et al. (1998) ρb=1.398−0.0047(Clay)−0.042(OC)
Kaur intrinsic ln(ρb)=0.313−0.191(OC)+0.02102(Clay)−0.000476(Clay)2−0.00432(Silt) Kaur et al. (2002) ρb=1.506−0.266(OC)+0.004517(Clay)−0.00352(Silt)
Leonaviˇciut˙e (2000) A ρb=1.70398−0.00313(Silt)+0.00261(Clay)−0.11245(OC)
Leonaviˇciut˙e (2000) B ρb=1.07256+0.032732 ln(Silt)+0.038753 ln(Clay)+0.078886 ln(Sand)−0.054309 ln(OC) Leonaviˇciut˙e (2000) BC ρb=1.06727+0.01074 ln(Silt)+0.08068 ln(Clay)+0.08759 ln(Sand)+0.05647 ln(OC) Leonaviˇciut˙e (2000) E ρb=0.99915−0.00592 ln(Silt)+0.07712 ln(Clay)+0.09371 ln(Sand)−0.08415 ln(OC) Jeffrey (1970) ρb=1.482−0.6786 log10(LOI)
Harrison and Bocock (1981) – topsoil ρb=1.558−0.728 log10(LOI) Harrison and Bocock (1981) – subsoil ρb=1.729−0.769 log10(LOI) Tamminen and Starr (1994) ρb=1.565−0.2298 (LOI)0.5
Table 3.Statistics of observed bulk density,ρb(g cm−3) for each horizon type, used in the development of pedotransfer functions.
Hz type N Meanρb Standard Co-efficient Min Max Variance observed deviation of variation
E 9 1.347 0.090 6.682 0.911 1.687 0.077
Ap 111 0.976 0.071 7.275 0.475 1.514 0.039
Ap1 28 1.044 0.061 5.843 0.386 1.289 0.035
Ap2 16 1.072 0.069 6.437 0.817 1.331 0.014
Apg 18 1.180 0.047 3.983 0.626 1.789 0.076
Ah 16 0.879 0.043 4.892 0.624 1.483 0.037
AB 12 1.014 0.075 7.396 0.881 1.373 0.020
O 20 0.329 0.039 11.854 0.196 0.777 0.032
Bw 52 1.147 0.094 8.195 0.758 1.844 0.053
Bg 56 1.381 0.080 5.793 0.902 1.762 0.035
Bs 7 1.086 0.058 5.341 0.710 1.353 0.052
Bt 8 1.307 0.036 2.754 0.907 1.501 0.058
Btg 15 1.521 0.072 4.734 1.131 1.770 0.033
BC 15 1.444 0.084 5.817 0.770 1.754 0.051
BCg 15 1.498 0.067 4.473 1.146 1.859 0.044
C/Ck/Cr 21 1.396 0.088 6.304 0.487 1.833 0.089
Cg 12 1.566 0.067 4.278 1.146 1.949 0.049
of the selected PTF were updated using multiple regression analysis (Table 7).
2.12 Model validation
After the recalibration the validation process was applied, using 20 % of the observed data points, again randomly se-lected. In some cases there were too few data points when 20 % of the observations were extracted. In this instance no validation could be performed, this affected four horizons (Bs, Bt, C/Ck/Cr and E, Table 7).
2.13 Digital Soil Mapping (DSM) techniques
The application of PTF has facilitated the prediction of soil bulk density for each genetic horizon for a total of 809 soil
profiles. The availability of this bulk density data allowed the development of maps derived upon these data points. Depths of the horizons were recorded, but these were not consistent across all sites as indicated earlier. Therefore, to obtain the bulk density at the different depths the horizon average was used (average of horizons that fall within the depth crite-rion).The horizon average was used for estimating bulk den-sity at 0–30 and 30–50 cm depths (Fig. 4a and b). The DSM technique applied was a model which utilized the Universal Kriging method in R software. This involved the develop-ment of surface grids from the above profile bulk density data using spatial analyst interpolation.
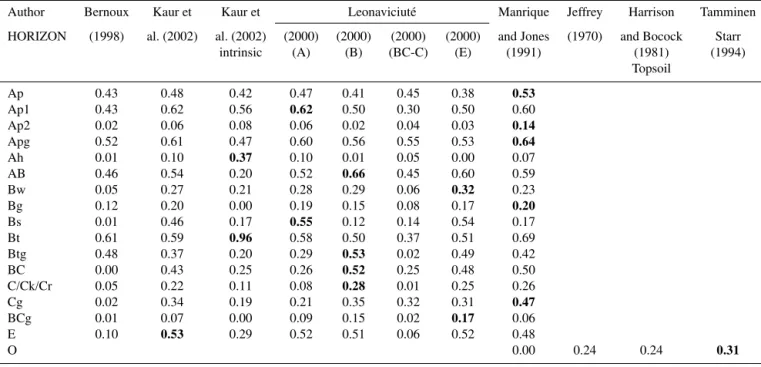
El-Table 4.Co-efficient of determination values (R2) when comparing original bulk density values to predicted values for each horizon type, using the listed pedotransfer functions. Bold indicates the highestR2value for a particular horizon type.
Author Bernoux Kaur et Kaur et Leonaviciuté Manrique Jeffrey Harrison Tamminen N
HORIZON (1998) al. (2002) al. (2002) (2000) (2000) (2000) (2000) and Jones (1970) and Bocock and Starr
intrinsic (A) (B) (BC-C) (E) (1991) (1981) (1994)
Topsoil
Ap 0.46 0.57 0.57 0.56 0.42 0.43 0.40 0.57 111
Ap1 0.57 0.74 0.60 0.74 0.54 0.52 0.52 0.70 29
Ap2 0.48 0.36 0.25 0.36 0.30 0.35 0.26 0.36 16
Apg 0.59 0.69 0.50 0.69 0.59 0.55 0.55 0.69 18
Ah 0.34 0.34 0.42 0.36 0.13 0.17 0.43 0.31 16
AB 0.34 0.59 0.38 0.58 0.60 0.59 0.55 0.63 12
Bw 0.09 0.32 0.21 0.35 0.33 0.10 0.36 0.28 52
Bg 0.21 0.22 0.04 0.19 0.25 0.19 0.25 0.32 56
Bs 0.36 0.64 0.43 0.79 0.50 0.65 0.57 0.31 7
Bt 0.99 0.99 0.96 0.96 0.82 0.84 0.78 0.96 8
Btg 0.57 0.59 0.21 0.40 0.65 0.18 0.63 0.69 15
BC 0.09 0.55 0.26 0.41 0.58 0.28 0.55 0.59 15
C/Ck/Cr 0.06 0.22 0.12 0.09 0.33 0.03 0.27 0.34 21
Cg 0.02 0.71 0.52 0.63 0.39 0.33 0.41 0.64 12
BCg 0.41 0.07 0.24 0.09 0.26 0.33 0.26 0.19 15
E 0.48 0.61 0.78 0.62 0.52 0.44 0.57 0.49 9
O 0.43 0.25 0.25 0.49 20
Table 5.Co-efficient of determination values (Rp2) when comparing original bulk density values to predicted values for each horizon type, using complimentary prediction quality indices (De Vos et al., 2005). Bold indicates the highestR2pvalue for a particular horizon type.
Author Bernoux Kaur et Kaur et Leonaviciuté Manrique Jeffrey Harrison Tamminen
HORIZON (1998) al. (2002) al. (2002) (2000) (2000) (2000) (2000) and Jones (1970) and Bocock Starr
intrinsic (A) (B) (BC-C) (E) (1991) (1981) (1994)
Topsoil
Ap 0.43 0.48 0.42 0.47 0.41 0.45 0.38 0.53
Ap1 0.43 0.62 0.56 0.62 0.50 0.30 0.50 0.60
Ap2 0.02 0.06 0.08 0.06 0.02 0.04 0.03 0.14
Apg 0.52 0.61 0.47 0.60 0.56 0.55 0.53 0.64
Ah 0.01 0.10 0.37 0.10 0.01 0.05 0.00 0.07
AB 0.46 0.54 0.20 0.52 0.66 0.45 0.60 0.59
Bw 0.05 0.27 0.21 0.28 0.29 0.06 0.32 0.23
Bg 0.12 0.20 0.00 0.19 0.15 0.08 0.17 0.20
Bs 0.01 0.46 0.17 0.55 0.12 0.14 0.54 0.17
Bt 0.61 0.59 0.96 0.58 0.50 0.37 0.51 0.69
Btg 0.48 0.37 0.20 0.29 0.53 0.02 0.49 0.42
BC 0.00 0.43 0.25 0.26 0.52 0.25 0.48 0.50
C/Ck/Cr 0.05 0.22 0.11 0.08 0.28 0.01 0.25 0.26
Cg 0.02 0.34 0.19 0.21 0.35 0.32 0.31 0.47
BCg 0.01 0.07 0.00 0.09 0.15 0.02 0.17 0.06
E 0.10 0.53 0.29 0.52 0.51 0.06 0.52 0.48
O 0.00 0.24 0.24 0.31
evation Model (DEM 20 m resolution). Land-use data were applied as this reflected the soil management types, in terms of compaction and/or poaching etc, which are major drivers of soil bulk density. The DEM provided information on alti-tude and slope degree, these data types were selected as they represent natural changes in bulk density as a result of the major topographical features and provide an indicator of the
climatic influence on soils at high altitudes (colder, wetter more acidic conditions). The soil association map was not included in this analysis, as this map is also a predicted prod-uct, SIS Final Technical Report 5, which uses the co-variants described within the prediction (Mayr et al., 2014).
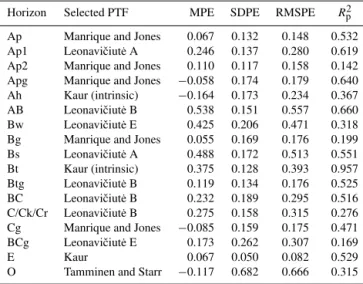
Table 6. The mean predicted error (MPE, g cm−3); the standard deviation of the prediction error (SDPE, g cm−3); the root mean squared prediction error (RMSPE, g cm−3); and the prediction coefficient of determination (Rp2) using complimentary prediction quality indices (De Vos et al., 2005) for each horizon type and se-lected pedotransfer function type.
Horizon Selected PTF MPE SDPE RMSPE Rp2
Ap Manrique and Jones 0.067 0.132 0.148 0.532 Ap1 Leonaviˇciut˙e A 0.246 0.137 0.280 0.619 Ap2 Manrique and Jones 0.110 0.117 0.158 0.142 Apg Manrique and Jones −0.058 0.174 0.179 0.640 Ah Kaur (intrinsic) −0.164 0.173 0.234 0.367 AB Leonaviˇciut˙e B 0.538 0.151 0.557 0.660 Bw Leonaviˇciut˙e E 0.425 0.206 0.471 0.318 Bg Manrique and Jones 0.055 0.169 0.176 0.199 Bs Leonaviˇciut˙e A 0.488 0.172 0.513 0.551 Bt Kaur (intrinsic) 0.375 0.128 0.393 0.957 Btg Leonaviˇciut˙e B 0.119 0.134 0.176 0.525 BC Leonaviˇciut˙e B 0.232 0.189 0.295 0.516 C/Ck/Cr Leonaviˇciut˙e B 0.275 0.158 0.315 0.276 Cg Manrique and Jones −0.085 0.159 0.175 0.471 BCg Leonaviˇciut˙e E 0.173 0.262 0.307 0.169
E Kaur 0.067 0.050 0.082 0.529
O Tamminen and Starr −0.117 0.682 0.666 0.315
soil profile pit descriptions. This includes areas of peat, rock, alluvium, water and Sand. A matrix was compiled based on the legend of dunes, tidal marshes, and urban areas (Creamer et al., 2014).
2.14 Map validation methodology
For the validation of the map, independent data were used from the SoilH project having 72 locations sampled for bulk density (Kiely, 2015). The De Vos indexes (De Vos et al., 2005, covered in Sect. 2.10 above) were applied to establish the prediction quality of the Universal Kriging of the indica-tive bulk density maps. The map validation methodology is covered in detail in the SIS Final Technical Report 18 (Simo et al., 2015).
2.15 Mapping confidence
The validation applied indicated low confidence for both bulk density maps (for 0–30 and 30–50 cm, having anR2=0.32 and R2=0.25, respectively. The main problem is that the data used for mapping bulk density were not taken with this purpose in mind. Bulk density is a soil property that it is strongly influenced by the management practices and the sampling point strategy could influence directly the map product. Some features of the distribution may reflect re-gional variations in land use and management practices as well as the underlying soil properties, and the analysis may be influenced by sampling density across land use types. Therefore, these maps should be considered as indicative maps, guarantees cannot be made that the map gives the full
actual picture, hence the bulk density could vary in a par-ticular location, thus the map legend shows ranges and not unique single values (Simo et al., 2015).
3 Results
3.1 Bulk density
The observedρbvalues were grouped together based on hori-zon designation (Ap, Ap1, Ap2, Apg, Ah, O, E, AB, Bw, Bg, Bs, Bt, Btg, BC, BCg, C/Ck/Cr and Cg) and statistics ap-plied in preparation for PTF application (Table 3).The min-imum number of replicates per horizon type was seven for the Bs horizon and the maximum number of replicates per horizon was 111 for Ap. Horizons Ap1 and Ap2 are gener-ally considered unique to Ap, this reflects the adoption of shallow till ploughing in some areas, however the bulk den-sities of both were similar, 1.044 and 1.072 g cm−3, respec-tively. These designations were not unfounded as Ap hori-zons were generally lower (0.976 g cm−3) when compared to Ap1 and Ap2 horizons. The largest bulk density was in Cg horizons (1.566 g cm−3) and the lowest in the O horizons (0.329 g cm−3). The Bt horizons had the lowest standard de-viation and co-efficient of variation, 0.036 and 2.75 %, re-spectively. The O horizons had the largest co-efficient of vari-ation at 11.854 %.
3.2 Application of pedotransfer functions
The selected eight mineral PTF and four organic PTF were applied to all horizon types (Table 4). The coefficient of de-termination for each PTF used is presented in Table 4. Those highlighted in bold indicate the highestR2value for a partic-ular horizon type. This may span multiple PTF, for example horizon Ap has anR2 value of 0.57 using the Kaur, Kaur intrinsic, and Manrique and Jones equations. The highest se-lectedR2value from all the PTF was for horizon Bt at 0.99, this was for both Bernoux and Kaur PTFs. The lowest se-lectedR2value for a specific horizon was the Bg with 0.32 using Manrique and Jones PTF. The highest R2 value for O horizons was 0.49 using the Taminen and Starr PTF.
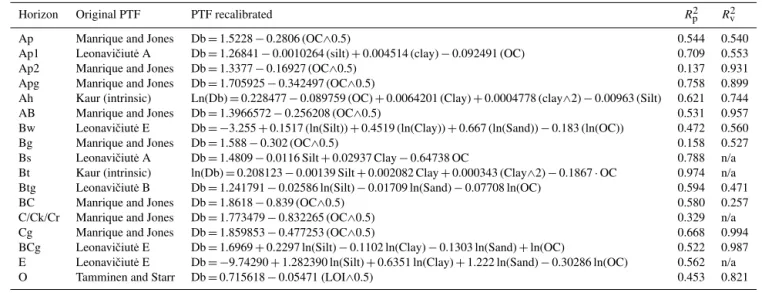
Table 7.Recalibrated pedotransfer functions (PTF) using Irish input data compared to measured bulk density.Rp2Ris the prediction coeffi-cient of determination,R2vis the validation coefficient of determination, both based on prediction quality indices (De Vos et al., 2005).ρbis bulk density (g cm−3). OC is organic carbon.
Horizon Original PTF PTF recalibrated R2p Rv2
Ap Manrique and Jones Db=1.5228−0.2806 (OC∧0.5) 0.544 0.540
Ap1 Leonaviˇciut˙e A Db=1.26841−0.0010264 (silt)+0.004514 (clay)−0.092491 (OC) 0.709 0.553
Ap2 Manrique and Jones Db=1.3377−0.16927 (OC∧0.5) 0.137 0.931
Apg Manrique and Jones Db=1.705925−0.342497 (OC∧0.5) 0.758 0.899
Ah Kaur (intrinsic) Ln(Db)=0.228477−0.089759 (OC)+0.0064201 (Clay)+0.0004778 (clay∧2)−0.00963 (Silt) 0.621 0.744
AB Manrique and Jones Db=1.3966572−0.256208 (OC∧0.5) 0.531 0.957
Bw Leonaviˇciut˙e E Db= −3.255+0.1517 (ln(Silt))+0.4519 (ln(Clay))+0.667 (ln(Sand))−0.183 (ln(OC)) 0.472 0.560
Bg Manrique and Jones Db=1.588−0.302 (OC∧0.5) 0.158 0.527
Bs Leonaviˇciut˙e A Db=1.4809−0.0116 Silt+0.02937 Clay−0.64738 OC 0.788 n/a Bt Kaur (intrinsic) ln(Db)=0.208123−0.00139 Silt+0.002082 Clay+0.000343 (Clay∧2)−0.1867·OC 0.974 n/a Btg Leonaviˇciut˙e B Db=1.241791−0.02586 ln(Silt)−0.01709 ln(Sand)−0.07708 ln(OC) 0.594 0.471
BC Manrique and Jones Db=1.8618−0.839 (OC∧0.5) 0.580 0.257
C/Ck/Cr Manrique and Jones Db=1.773479−0.832265 (OC∧0.5) 0.329 n/a
Cg Manrique and Jones Db=1.859853−0.477253 (OC∧0.5) 0.668 0.994
BCg Leonaviˇciut˙e E Db=1.6969+0.2297 ln(Silt)−0.1102 ln(Clay)−0.1303 ln(Sand)+ln(OC) 0.522 0.987 E Leonaviˇciut˙e E Db= −9.74290+1.282390 ln(Silt)+0.6351 ln(Clay)+1.222 ln(Sand)−0.30286 ln(OC) 0.562 n/a
O Tamminen and Starr Db=0.715618−0.05471 (LOI∧0.5) 0.453 0.821
n/a=not applicable.
generated using Manrique and Jones was considered. Again on inspection this PTF also had generated negative values. The R2 values of 0.251 for both Jeffrey and Harrison and Bocock were deemed too low to pursue even with all pos-itive values. Taminen and Starr was finally selected as the PTF for further investigation.
3.3 Selection of the best PTF
The performance of the selected PTF were further scrutinized using the prediction quality indices. The first of the indices to be examined was the prediction coefficient of determina-tion, Rp2, across the eight mineral and four organic PTF. In many cases where theR2was the same across two or more PTF (Table 4), there was a clear Rp2 value, larger than the others (bold, Table 5). For example Ap, where Manrique and Jones (0.53) is greater than Kaur and Kaur intrinsic at 0.48 and 0.42, respectively. The same situation occurred for hori-zon Ap1 (Leonaviˇciut˙e A) and Apg (Manrique and Jones). The best performing PTF based on R2 value, changed for horizons Ap2, Ah, Bt, Btg, BC, BCg, Cg. C/Ck/Cr and E, due to a higherRp2value with a different PTF. For horizons AB, Bw, Bg, Bs and O the original best performing PTF based on highestR2value, was still appropriate, displaying the highest Rp2, value also.
In Table 6 other indices were applied (MPE, SDPE and RMSPE) to support the most appropriate PTF selection. In general, the results show a positive MPE indicating an over-estimation of ρb values (Table 6). However, horizons Apg, Ah, Cg, and O displayed a negative MPE indicating an un-derestimation of ρb values. The Bg horizon displayed the highest accuracy with a low MPE value of 0.055 g cm−3,
whereas the AB horizon had the poorest level of accuracy (0.538 g cm−3).
RMSPE is the overall prediction error; this was highest with horizon O, 0.666 g cm−3, and lowest for horizon E, 0.082 g cm−3 (Table 6). The prediction coefficient of de-termination (Rp2) had a large range from 0.142 (Ap2) to 0.957 (Bt) and a median of 0.516 (BC). This was indicating that for horizons Ap2, Bg, and BCg there was low correlation and hence an unstable prediction. The SDPE value was con-verging to RMSPE value for horizons Ap, Apg, Bg, Cg, and O, therefore overall predictive error was due to precision er-ror (SDPE). In contrast the total erer-ror was due to accuracy in the case of AB horizons with the large difference between the SDPE value and RMSPE value (0.406 g cm−3). There was no pattern where low or high levels of MPE, SDPE or RMSPE or combinations thereof, resulted in a higherRp2value.
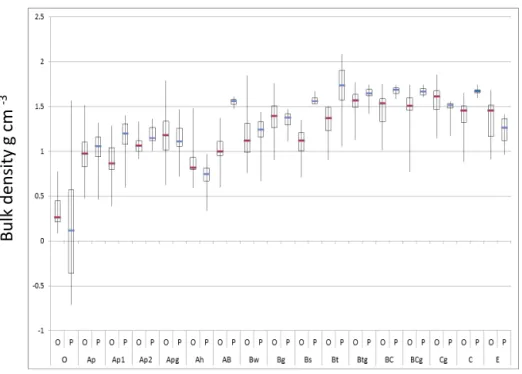
Horizon type
Bul
k densi
ty
g cm
-3
Figure 3.Observed bulk density (O) and predicted bulk density (P) g cm−3, for each horizon type. Prediction based on selected PTF with bestR2pRfollowing prediction quality indices.
3.4 Recalibration of the selected PTF
Having selected the best performing PTF for each horizon type using the prediction quality indices, 80 % of the ob-served data set was randomly selected for the recalibration of the PTF. The recalibrated PTF are presented in Table 7. For Ap, Ap2, AB, and Bg the Manrique and Jones intercept and coefficients have decreased due to lower densities in the data set. The intercept and coefficients increased with this PTF for Apg, BC, C/Ck/Cr, and Cg indicating higher densities in the data set. Leonaviˇciut˙e A (Ap1), Kaur intrinsic (Ah and Bt) and Leonaviˇciut˙e E (Bw), have decreased intercept and coef-ficients. Leonaviˇciut˙e B increased intercept and coefficients, in both the cases of recalibration for Btg and BC. Leonav-iˇciut˙e E increased the coefficients and intercepts in the case of BCg and decreased in the case of E horizons.
TheRp2values have increased in most cases following re-calibration (Table 7 compared to Table 6), especially in the case of Ah, Bs, and BCg (0.254, 0.237 and 0.353) however, there was a slight decrease for Ag and Bg horizons (0.129 and 0.041).
3.5 Validation of the recalibrated PTF
Validation has improved the coefficient of determination once again (Table 7), where 20 % of the observed values were again randomly selected andR2generated. There have been increases in the R2 validation values in comparison to the
Rp2 values of 0.3 or more for Ap2, AB, Bg, Cg, BCg, and O. There was a large decrease for BC (0.323) and a small de-crease for Ap1 and Btg (0.156 and 0.123). Except for horizon BC all other horizons have anR2of at least 0.47 or higher. Horizon BC with a low correlation (0.257) would have an un-stable predictability. For horizons Bs, Bt, C, and E there were not enough data points in the validation data set of 20 % to generate any validation indices.
3.6 Indicative soil bulk density map
Figure 4.(a)Indicative soil bulk density distribution map for Ireland (0–30 cm, g cm−3).(b)Indicative soil bulk density distribution map (30–50 cm, g cm−3).
4 Discussion
4.1 Observedρbvalues
The observedρb values across all horizons have a mean of 1.187 g cm−3with a standard deviation of 0.305 g cm−3. Re-moving the O horizon value of 0.329 g cm−3, the mean and standard deviation are 1.214 and 0.217 g cm−3, respectively. This mean value compares favourably to Manrique and Jones (1991) on a range of agricultural soils 1.2–1.5 g cm−3. The ForSite study of De Vos et al. (2005) reported another comparable value of 1.23 g cm−3for topsoil. This value also compares well to the subsurface soils of Harrison and Bo-cock (1991), 1.29 g cm−3, and forest soils of Taminen and Starr, 1.19 g cm−3.
Kiely et al. (2010), looking in particular at Irish soils to 50 cm depth found bulk densities for Brown Earths in the range of 1.02 to 1.22 g cm−3, Brown Podzolics 0.94 to 1.07 g cm−3, Gleys and Grey Brown Podzolics (Lu-visols) 0.86 to 1.3 g cm−3and Podzols 0.53 to 1.23 g cm−3. Reidy and Bolger (2013) reported ρb values of 1.018 to 1.063 g cm−3 on Gley soils in the Irish midlands to 30 cm depth. The generally higher levels in this study may be at-tributable to the greater depth studied and reported ρb in-crease with depth. This study’s measuredρbvalues are well within the general ranges reported nationally and interna-tionally. The O horizon value of 0.329 g cm−3 in this study appears to be greater than those reported in the literature. Wellock et al. (2011) reportρbvalues for Irish raised,
high-and low-level blanket peats of 0.133, 0.118 high-and 0.125 g cm−3 and Kiely et al. (2010) report values of 0.15 to 0.25 g cm−3 for Irish peat soils. It should be noted that the O horizons in this present study included only horizons with greater than 12 % organic carbon. It is likely that these other studies, which indicate lowerρb values, are due to the peats having at least 40 % organic carbon content.
Looking at the mean values per horizon, the use of this approach appears justified with the large differences between surface horizons and sub-surface horizons (Ap, 0.976 g cm−3, and Cg, 1.566 g cm−3, Table 3). The differ-ence between each type of surface horizon is also notable, where O horizons are 0.329, and Ap1 and Ap2 (while close together at 1.044 and 1.072 g cm−3) are different from Ap, reflecting differences in organic matter content and manage-ment, respectively. Therefore where possible predictions for soil bulk density should be at horizon level rather than topsoil or subsoil categorization.
The practice of splitting the bulk density of a singular pro-file into horizons has other advantages, especially when mod-elling systems. Many studies note that high levels of SOC are found at the surface, particularly at 0–30 cm depth. However more SOC could be found in the 30–100 cm range where the soils are denser. Adhikari et al. (2014) modelled ρb values using quadratic splines, when different horizon data were not available. This is a method to reflect the changes ofρbin soil profiles by using discrete soil depths. It was noted that accu-rate quantification of SOC stocks required a depth function. Tranter et al. (2007) also included a depth function when de-scribing PTF based on soil mineral packing structures and soil structure. However it should also be noted that the fitting quality of splines to profile data depends on smoothing pa-rameters, which introduces another source of error (Malone et al., 2009). In this study the data have been directly mea-sured across the various horizons which avoids this error.
4.2 Application of literature PTF
The decision was made to apply our data set to PTF derived from the literature and then recalibrate. De Vos et al. (2005) indicated that the global predictive capacity of these func-tions appeared to be amenable to further improvement. Mar-tin et al. (2011) stated that recalibration of exisMar-ting PTF is worthwhile as the PTF itself defining more generally a func-tion type, may be valid across several regions. However cau-tion is required as parameters obtained under the given con-ditions can be too dependent on the data set characteristics. Generating new PTF from limited data could be prone to propagation of errors. In the Khalil et al. (2013) study for particular Great Groups, in Ireland, there was only SOC data to 10 cm available. The SOC had to be predicted to 50 cm and this predicted value was used once again to predictρbvalues to 50 cm. This process was then repeated to generate values to 100 cm.
Nevertheless compartmentalization of bulk density data also has its merits; Heuscher et al. (2005) who analysed 47 000 measurements in the USDA survey improved theρb predictions of their soils by placing the soils into suborders and then applying modelling techniques. The R2value im-proved from 0.45 to 0.62 in this process. Similar results were found by Manrique and Jones (1991) when they developed and applied the predictions within soil orders. This highlights an area for further investigation with data from the Irish SIS.
4.3 Recalibration of literature PTF
When recalibrating the PTF, it allowed the refinement of the equations for the Irish scenario. To date this is the most com-prehensive model of Irish soils using the largest available data set, with soil profile, soil horizon, and depth coverage. The use of 80 % of the data points also followed the accepted De Vos et al. (2005) method. Where the categorization into
horizon PTF is justified and theR2values increased or are equalled for 14 out of the 17 horizons studied (Table 6).
The study of Xu et al. (2011) desired more data for deeper soils and greater site number (in the Irish context) to calibrate that studies PTF. They had used 0-10 cm soil depth carbon values to predict, firstly carbon content to 50 cm depth and then to predict soil bulk density to 50 cm depth. The use of sequential empirical regressions in developing PTF can prop-agate errors (Meersmans et al., 2008). The use of a singular PTF for peat and mineral soils in the Xu et al. (2011) study is also unlikely to be useful once actual peatρband SOC es-timations at depth are required. This present study had both the depth and sample number data to calculate different PTF for various horizon types. The data generated in this study will avoid the propagation of errors described above and al-low more accurate SOC calculation.
4.4 Validation of the recalibrated PTF
De Vos et al. (2005) emphasized the need for recalibration and local validation. This would aid the decision making process with reference to the level of what prediction er-ror is acceptable. Getting this right is crucial as it has been recognized that correction factors led to an increase in the Belgian SOC prediction by 22 %, which also affected their projections due to landuse change and climate change (Let-tens et al., 2007). Although prediction errors between 10 and 20 % were deemed acceptable in the study of Prévost (2004). Huang et al. (2003) state that model acceptance would re-quire between 10 and 20 % of the variance observed. For horizons with many replicates such as Ap (n=111), the MPE falls within this criteria 0.067 g cm−3, or 6.8 % of 0.976 g cm−3. However this is not the case for many other horizon types which clearly need more replicates for example Bs (n=7) MPE is 0.488 g cm−3, or 44 % of 1.086 g cm−3. Though, in most cases where a validation could be performed the predicted coefficient of variation was equalled or im-proved (Rv2, Table 7).
4.5 Mapping application
ρb was measured but site number was restrictive (n=44). However, in both cases mapping criteria were not developed for greater areas. Most SOC studies and inventories are con-fined to 30 cm soil depth but the amount of SOC stored be-low 30 cm is of relevance in many ecosystems (Adhikari et al., 2014).
The PTF developed in this study allows the estimation of national organic carbon coverage of all soil types to 1 m depth with bulk density. This deficit of data was recognized with the initial development and is now further realized be-cause of the recent availability of the Irish soil information system and its carbon data (Creamer et al., 2014). The same set of principles of method development of the PTF and map-ping application could be applied to any national data set lacking in bulk density coverage.
5 Conclusions
The ρb values reported for horizon type allowed a greater range of soils in the Irish SIS to have ρb values allocated in the cases where there are omissions and to depth (recom-mended 1 m). The same process was applied to the AFT sam-ples that did not haveρbvalues measured in the field. This paper covers the methodology of producing soil horizon PTF given the measured data available. Related predictions are based on the best data available after screening for accuracy and precision of PTF; they were then recalibrated and even-tually validated within the Irish scenario. The methodology enabled the researcher to return to the Irish SIS to produce a validatedρbmap at two depths, 0–30 cm and 30–50 cm (de-tails of validation of map are given in Simo et al., 2015). Now that aρbvalue is available for the different soil depths, val-ues could be attributed to each soil mapping unit using Irish SIS into the future. Potentially this data could then be com-bined with known carbon data to produce a soil carbon map to 1 m. The data could also be used to produce a drainage map for the country. Another area for potential use would be the PTF used in hydrology studies, which use bulk density values. Furthermore, where nutrient management is a con-cern in soils, areas prone to compaction can be identified via this map. The PTF produced are valid for some horizons (with large R2 values) and have limited success with other horizons. It is hoped in time as the sample number of these rarer horizons increases that the accuracy of the prediction increases. In general the greater sample number the better the prediction and validation.
Acknowledgements. This work was conducted as part of the Irish Soil Information System Project, managed by Teagasc (the Irish Agriculture and Food Development Authority) and co-funded by the Environmental Protection Agency (EPA) of Ireland through their Science, Technology, Research and Innovation for the Environment (STRIVE) Programme, as part of the National Development Plan 2007–2013. In addition, the authors would like to thank the lab staff of Johnstown Castle for their contribution to
this work, the student interns working in the field and the many landowners who gave access freely to their land.
Edited by: H. Reuter
References
Adams, W. A.: The effect of organic matter on the bulk and true densities of some uncultivated podzolic soils, J. Soil Sci., 24, 10– 17, 1973.
Adhikari, K., Hartemink, A. E., Minasny, B., BouKheir, R., Greve, M. B., and Greve, M. H.: Digital Mapping of Soil Organic Car-bon Contents and Stocks in Denmark, PLoS ONE, 9, e105519, doi:10.1371/journal.pone.0105519, 2014.
Alexander, E. B.: Bulk densities of California soils in relation to other soil properties, Soil Sci. Soc. Am. J., 44, 689–692, 1980. An Foras Talúntais staff: West Cork Resource Survey, Soil Survey
Bulletin, Dublin, 1963.
An Foras Talúntais staff: West Donegal Resource Survey, Part 1 Soils and other physical resources, Soil Survey Bulletin, Dublin, 1969.
An Foras Talúntais staff: County Leitrim Resource Survey, Soil Sur-vey Bulletin No. 29, Dublin, 1973, 1973.
Arya, L. M. and Paris, J. F.: A physicoempirical model to predict the soil moisture characteristic from particle-size distribution and bulk density data, Soil Sci. Soc. Am. J., 45, 1023–1030, 1981. Batjes, N.: SOTER-Based Soil Parameter Estimates for Central and
Eastern Europe (Version 2.0), Report 2005/4, ISRIC World Soil Information, Wageningen, 2005.
Batjes, N. H.: Harmonized soil profile data for applications at global and continental scales: updates to the WISE database, Soil Use Manage., 25, 124–127, 2009.
Bernoux, M., Arrouays, D., Cerri, C., and Bourennane, H.: Mod-eling vertical distribution of carbon in oxisols of the western Brazilian Amazon (Rondonia), Soil Sci., 163, 941–951, 1998. Black, K. G. and Farrell, E. P. (Eds.): Carbon sequestration and Irish
forest ecosystems, COFORD, Dublin, 2006.
CARBiFOR: II: Carbon Sequestration in Irish Forest Ecosys-tems, available at: http://www.ucd.ie/carbifor, last access: 14 May 2015.
Conry, M. J. and Ryan, P.: Soils of Co. Carlow, Soil Survey Bulletin No. 17, Dublin, 1967.
Conry, M. J., Hammond, R. F., and O’Shea, T.: Soils of County Kildare, Soil Survey Bulletin, Dublin, 1970.
Conry, M. J.: Soils of Co. Laois, Soil Survey Bulletin No. 41, Dublin, 1987.
Creamer, R., Simo, I., Reidy, B., Carvalho, J., Fealy, R., Hallett, S., Jones, R., Holden, A., Holden, N., Hannam, J., Massey, P., Mayr, T., McDonald, E., O’Rourke, S., Sills, P., Truckell, I., Zawadzka, J.. and Schulte, R.: Irish Soil 501 Information System., 2007-S-CD-1-S1, EPA STRIVE Programme 2007–2013, EPA, Dublin, 2014.
Culleton, E.: Laboratory analyses in soil survey investigations: the-ory and techniques, An Foras Talúntais National Soil Survey, Johnstown Castle, Wexford, Republic of Ireland, 1972. De Vos, B., Meirvenne, M. V., Quataert, P., Deckers, J., and Muys,
Dexter, A. R.: Advances in characterization of soil structure, Soil Till. Res., 11, 199–238, 1988.
Diamond, J. and Sills, P.: Soils of Co. Waterford, National Soil Sur-vey of Ireland, Soil SurSur-vey Bulletin No. 44, Teagasc, Oak park, Carlow, Co. Carlow, Grehan Printers, Dubin, 314 pp., 2011. Douglas, J. T. and Crawford, C. E.: Soil compaction effects on
uti-lization of nitrogen from livestock slurry applied to grassland, Grass Forage Sci., 53, 31–40, 1998.
Ellert, B. H. and Bettany, J. R.: Calculation of organic matter and nutrient stored in soils under constrain management regimes, Can. J. Soil Sci., 75, 529–538, 1995.
EU – European Union: Towards a Thematic Strategy for Soil Pro-tection, Communication from the Commission to the Council, the European Parliament, the Economic and Social Committee and the Committee of the Regions, COM (2002) 179 final, Brus-sels, 35 pp., 2002.
Federer, C. A.: Nitrogen mineralization and nitrification: Depth variation in four New England forest soils, Soil Sci. Soc. Am. J., 47, 1008–1014, 1983.
Finch, T. F. and Gardiner, M. J.: Soils of Co. Westmeath, Soil Sur-vey Bulletin No. 37, Dublin, 1977.
Finch, T. P. and Gardiner, M. J.: Soils of Tipperary North Riding, Soil Survey Bulletin No. 42, Dublin, 1993.
Finch, T. F. and Ryan, P.: Soils of Co. Limerick, Soil Survey Bul-letin No. 16, Dublin, 1966.
Finch, T. F., Culleton, E., and Diamond, S.: Soil Survey Bulletin No. 23, Dublin, 1971.
Finch, T. F., Gardiner, M. J., Comey, A., and Radford, T.: Soils of Co. Meath, Soil Survey Bulletin No. 37, Dublin, 1983.
Gardiner, M. J. and Radford, T.: Soil Associations of Ireland and their land use potential, Soil Survey Bulletin No. 36, Dublin, 1980.
Gardiner, M. J. and Ryan, P.: Soils of Co. Wexford, Soil Survey Bulletin No. 1, Dublin, 1964.
Hammond, R. F. and Brennan, L. E.: Soils of Co. Offaly, Soil Sur-vey Bulletin No. 43, Dublin, 2003.
Harrison, A. F. and Bocock, K. L.: Estimation of soil bulk-density 476–481, from loss-on-ignition values, J. Appl. Ecol., 8, 919– 927, 1981.
Heuscher, S. A., Brandt, C. C., and Jardine, P. M.: Using soil phys-ical and chemphys-ical properties to estimate bulk density, Soil Sci. Soc. Am. J., 69, 51–56, 2005.
Hollis, J., Jones, R., Marshall, C., Holden, A., van de Veen, J., and Montanarella, L.: SPADE 2: The Soil Profile Database for Eu-rope version 2.0, EuEu-ropean Soil Bureau Research Report No. 19, EUR 22127 EN, Office for the Official Publications of the Euro-pean Communities, Luxembourg, 2006.
Honeysett, J. L. and Ratkowsky, D. A.: The use of ignition loss to estimate bulk density of forest soils, J. Soil Sci., 40, 299–308, 1989.
Huang, S., Yang, Y., and Wang, Y.: A critical look at procedures for validating growth and yield models, in: Modelling forest sys-tems, edited by: Amaro, A., Reed, D., and Soares, P., CAB Inter-national, Wallingford, UK, 271–293, 2003.
Huntington, T. G., Johnson, C. E., Johnson, A. H., Siccama, T. G., and Ryan, D. F.: Carbon, organic matter, and bulk density rela-tionships in a forested spodosol, Soil Sci., 148, 380–386, 1989.
IUSS Working Group WRB: World Reference Base for soil re-sources, World Soil Resources Report No. 103, FAO, Rome, 128 pp., 2006.
Jackson, M. L.: Soil Chemical Analysis, Prentice-Hall, Inc., New Jersey, 1958.
Jeffrey, D. W.: A note on the use of ignition loss as a means for the approximate estimation of soil bulk density, J. Ecol., 58, 297– 299, 1970.
Kaur, R., Sanjeev, K., and Gurung, H.: Apedo-transfer func-tion (PTF) for estimating soil bulk density from basic soil data and its comparison with existing PTFs, Aust. J. Soil Res., 40, 847–857, 2002.
Khalil, M. I., Kiely, G., O’Brien, P., and Müller, C.: Organic carbon stocks in agricultural soils in Ireland using combined empirical and GIS approaches, Geoderma, 193–194, 222–235, 2013. Kiely, G.: Interactions of Soil Hydrology, Land Use and Climate
Change and their Impact on Soil Quality, Datasets Available at: Secure Archive for Environmental Research Data managed by Environmental Protection Agency Ireland, http://erc.epa.ie/safer/ resource?id=e6df65fa-e1b8-11e3-b233-005056ae0019, last ac-cess: 6 October 2015.
Kiely, G., Eaton, J., McGoff, N., Xu, X., and Leahy, P.: SoilC mea-surement and modelling of soil carbon stocks and stock changes in Irish soils. Final Report, Environmental Protection Agency, Johnstown Castle, Ireland, 2010.
Kiely, J., Diamond, S., Burke, P. J., and Collins, T.: Soil Map of West Mayo, An Foras Talúntais, Dublin, 1974.
Leonaviˇciut˙e, N.: Predicting soil bulk and particle densities by pe-dotransfer functions from existing soil data in Lithuania, Ge-ografijosmetraštis, 33, 317–330, 2000.
Lettens, S., Van Orshoven, J., Van Wesemael, B., De Vos, B., and Muys, B.: Stocks and fluxes of soil organic carbon for landscape units in Belgium derived from heterogeneous data sets for 1990 and 2000, Geoderma, 127, 11–23, 2005.
Lettens, S., De Vos B., Quatarert, P., Van Wesemael, B., Muys, B., and Van Orshoven, J.: Variable carbon recovery of Walkley-Black analysis and implications for national soil organic carbon accounting, Eur. J. Soil Sci., 58, 1244–1253, 2007.
Malone, B. P., McBratney, A. B., Minasny, B., and Laslett, G. M.: Mapping continuous depth functions of soil carbon storage and available water capacity, Geoderma, 154, 138–152, 2009. Manrique, L. A. and Jones, C. A.: Bulk density of soils in relation
to soil physical and chemical properties, Soil Sci. Soc. Am. J., 55, 476–481, 1991.
Martin, M. P., Wattenbach, M., Smith, P., Meersmans, J., Jolivet, C., Boulonne, L., and Arrouays, D.: Spatial distribution of soil organic carbon stocks in France, Biogeosciences, 8, 1053–1065, doi:10.5194/bg-8-1053-2011, 2011.
Massey, P., O’Connor, C., Sills, P., Fenelon, A., Maloney-Finn, L., Reidy, B., and Creamer, R.: Irish Soil Information System: Lab-oratory Standard Operating Procedures (2007-S-CD-1-S1), EPA STRIVE Programme 2007–2013, Report 7, EPA, Dublin, 2014. Mayr, T. R., Zawadzka, J. E., Corstanje, R., Lo Papa, G., and
Fealy, R.,: Predictive Mapping, Final Technical Report 5, Irish Soil Information System (2007-S-CD-1-S1), EPA STRIVE Pro-gramme 2007–2013, EPA, Dublin, 2014.
distribution of Soil Organic Carbon (SOC) at the regional scale (Flanders, Belgium), Geoderma, 143, 1–13, 2008.
Minasny, B. and McBratney, A.: Estimating the Water Retention Shape Parameter from Sand and Clay Content, Soil Sci. Soc. Am. J., 71, 1105–1110, 2007.
Murphy, B., Geeves, G., Miller, M., Summerell, G., Southwell, P., and Rankin, M.: The application of pedotransfer functions with existing soil maps to predict soil hydraulic properties for catchment-scale hydrologic and salinity modelling, Proceedings MODSIM Conference, Townsville, Australia, 2003.
O’Sullivan, L., Creamer, R. E., Fealy, R., Lanigan, G., Simo, I., Fen-ton, O., Carfrae, J., and Schulte, R. P. O.: Functional land man-agement for managing soil-based ecosystem services: A case-study of the trade-off between primary productivity and carbon storage in response to the intervention of drainage systems in Ire-land, Land Use Policy, 47, 42–54, 2015.
Prévost, M.: Predicting soil properties from organic matter content following mechanical site preparation of forest soils, Soil Sci. Soc. Am. J., 68, 943–949, 2004.
Rawls, W. J. and Brakensiek, D. L.: Prediction of soil water prop-erties for hydrologic modelling, in: Watershed Management in the Eighties, edited by: Jones, E. and Ward, T. J., Proc of a Symp. ASCE, 30 April–2 May 1985, Denver, CO, ASCE, New York, 293–299, 1985.
Reidy, B. and Bolger, T.: Soil carbon stocks in a Sitka spruce chronosequence following afforestation, Irish Forestry, 70, 200– 219, 2013.
Saffih-Hdadi, K., Défossez, P., Richard, G., Cui, Y. J., Tang, A. M., and Chaplain, V.: A method for predicting soil susceptibility to the compaction of surface layers as a function of water content and bulk density, Soil Till. Res., 105, 96–103, 2009.
Simo, I., Creamer, R., Reidy, B., Jahns, G., Massey, P., Hamilton, B., Hannam, J. A., Jones, R. J. A., McDonald, E., Sills, P., and Spaargaren, O.: Irish Soil Information System Soil profile hand-book (2007-S-CD-1-S1), EPA STRIVE Programme 2007–2013, Report 10, EPA, Dublin, 2014.
Simo, I., Creamer, R. E., O’Sullivan, L., Reidy, B., Schulte, R. P. O., and Fealy, R. M.: Final Technical Report 18, Irish Soil In-formation System (2007-S-CD-1-S1) EPA STRIVE Programme 2007–2013, EPA, Dublin, 2015.
Suuster, E., Ritz, C., Roostalu, H., Reintam, E., Kõlli, R., and As-tover, A.: Soil bulk density pedotransfer functions of the humus horizon in arable soils, Geoderma, 163, 74–82, 2011.
Tamminen, P. and Starr, M.: Bulk density of forested mineral soils, Silva Fennica, 28, 53–60, 1994.
Tranter, G., Minasny, B., McBratney, A. B., Murphy, B., McKenzie, N. J., Grundy, M., and Brough, D.: Building and testing concep-tual and empirical models for predicting soil bulk density, Soil Use Manage., 23, 437–443, 2007.
USDA: Soil survey staff of the United States Department of Agri-culture: Soil Classification – A Comprehensive System, 7th Ap-proximation, Soil Conservation Service, US Department of Agri-culture, Washington, D.C., p. 265, 1960.
Van Alphen, B. J., Booltink, H. W. G., and Bouma, J.: Combining pedotransfer functions with physical measurements to improve the estimation of soil hydraulic properties, Geoderma, 103, 133– 147, 2001.
Vanguelova, E. I., Bonifacio, E., De Vos, B., Hoosbeek, M. R., Bergere, T. W., Armolaitis, K., Celi, L., Dinka, L., Kjønaas, O. J., Pavlenda, P., Pumpanen, J, Püttsepp, Ü., Reidy, B., Simonˇciˇc, P., Tobin, B., Vesterdal, L., and Zhiyanski, M.: Forest soil carbon stocks at different scales – uncertainties and recommendations, Environ. Monit. Assess., submitted, 2016.
Wellock, M. L., Reidy, B. J., LaPerle, C. M., Bolger, T., and Kiely, G.: Soil carbon stocks of afforested peat in Ireland, Forestry, 84, 441–451, 2011.