Spectral analysis of the
electromyograph of the erector
spinae muscle before and after
a dynamic manual load-lifting test
Laboratório de Biomecânica, Departamento de Educação Física,
Instituto de Biociências, Universidade Estadual Paulista, Rio Claro, SP, Brasil A.C. Cardozo,
M. Gonçalves and A.C.F. Gauglitz
Abstract
The aim of the present study was to assess the spectral behavior of the erector spinae muscle during isometric contractions performed before and after a dynamic manual load-lifting test carried out by the trunk in order to determine the capacity of muscle to perform this task. Nine healthy female students participated in the experiment. Their average age, height, and body mass (± SD) were 20 ± 1 years, 1.6 ± 0.03 m, and 53 ± 4 kg, respectively. The development of muscle fatigue was assessed by spectral analysis (median frequency) and root mean square with time. The test consisted of repeated bending movements from the trunk, starting from a 45º angle of flexion, with the application of approximately 15, 25 and 50% of maximum individual load, to the stand up position. The protocol used proved to be more reliable with loads exceeding 50% of the maximum for the identification of muscle fatigue by electromyography as a function of time. Most of the volunteers showed an increase in root mean square versus time on both the right (N = 7) and the left (N = 6) side, indicating a tendency to become fatigued. With respect to the changes in median frequency of the electromyographic signal, the loads used in this study had no significant effect on either the right or the left side of the erector spinae muscle at this frequency, suggesting that a higher amount and percent-age of loads would produce more substantial results in the study of isotonic contractions.
Correspondence
A.C. Cardozo
Laboratório de Biomecânica Departamento de Educação Física Instituto de Biociências, UNESP Avenida 24-A, 1515 13506-900 Rio Claro, SP Brasil:
Fax: +55-19-3526-4321 E-mail: [email protected]
Research partially supported by Fundação para o Desenvolvimento da UNESP (FUNDUNESP).
Publication supported by FAPESP.
Received June 24, 2003 Accepted March 11, 2004
Key words
•Electromyography •Spectral analysis •Root mean square •Load lifting •Fatigue
Introduction
Manual load lifting continues to be a concern in everyday activities, particularly in occupational ones. Many variables inter-fere with the action of manual load lifting (1), hindering the establishment of definitive rules. Several researchers have attempted to develop testing protocols that would permit the assessment of muscle behavior in this extremely demanding activity (1-7).
Overload-related lumbar lesions caused by manual load lifting can be prevented by tests specifically developed to identify mus-cular activity patterns characteristic of a state of fatigue. Because fatigue results from the repetition of tasks and overloads, it is one of the major causes of musculoskeletal injuries of the spine.
as pelvic belts (4), which have been found to reduce electromyographic activity but not to interfere with the development of the fatigue process (3).
Among the protocols developed for the identification of muscular fatigue, most of those based on the methodology of deVries et al. (8) show a steadily stronger electromyogra-phy (EMG) signal along timethrough the root mean square (RMS) of the signal (4,9-12).
Another tool for the analysis of muscular fatigue is spectral analysis (5), which is used to interpret the behavior of motor units in re-sponse to repetitive tasks, particularly those involving isometric contractions. One of the main characteristics of this behavior is the reduction of firing frequency, which can be re-presented by the mean power frequency (13-15) and more clearly by the median frequency (2). The determination of the evolution of median frequency may be applied clinically (16) in studies in which spectral analysis is used to help monitor the rehabilitation of patients with lower back pain (7).
Other factors possibly related to fatigue are accumulation of hydrogen and metabolic ions (17,18), as well as a deviation of sodium and potassium concentrations. Thus, biomechan-ics together with physiology of exercise seek to quantify the muscular effort required for given workloads over a given period of time. The EMG signal is an index of the energy expended in performing the task and fatigue is an important factor in the characterization of this pattern of movement and its efficiency (19). The RMS of this signal indicates varia-tions in the firing frequency and amplitude of muscular activity (20), variables that are nor-mally affected in the fatigue process.
In an attempt to identify more reliable protocols based on the use of EMG, the objective of the present study was to assess the spectral behavior of the erector spinae muscle during isometric contractions per-formed before and after a dynamic manual load-lifting test of the trunk in order to diag-nose the capacity to carry out the task.
Material and Methods
Subjects
Nine healthy female students participated in the experiment. Their average age, height, and body mass (± SD) were 20 ± 1 years, 1.6 ± 0.03 m, and 53 ± 4 kg, respectively. The protocol was approved by the local Ethics Committee, and all subjects signed informed consent forms prior to the experiment. None of the subjects reported any history of lower back pain.
Instrumentation
For the experiment, the subjects stood up straight, hips leaning on a horizontal support rod, knees stretched straight, and the trunk supported on a mobile rod. In this position, the trunk performed bending movements, from its initial position to a 45° angle, in both isometric and isotonic contractions.
A videocamera (JVC 30 Hz) was used in order to ensure that the subjects maintained the correct posture during manual load lifting and to identify the beginning and the end of the manual load-lifting movement. The image re-corded by the camera was displayed in real time to the subject as the test was performed, serving as a feedback of the initial and final limits of the extent of the movement allowed. A metronome (Qwik Time) was used to en-sure that all subjects performed the exercise at the same pace (20 bpm).
To synchronize the acquisition of the elec-tromyographic data and the corresponding posture during the movement, a photoelec-tronic system (21) was used to activate an incandescent bulb, which emitted a common signal to the EMG apparatus (Lynx - Tecnolo-gia Eletrônica Ltda.) and to the videocamera.
Procedure
deter-mined based on the protocol proposed by Bittencourt (22).
The experiment consisted of performing a maximum voluntary contraction (MVC) of 3 s before and after the isotonic contractions (manual load lifting and lowering with the trunk), using an M.A. ISOSTATION 2000 device (Rio Claro, SP, Brazil) (Figure 1). The isotonic contractions lasted 1 min and were performed using a cable coupled to a system of double pulleys (Riguetto) using 50% of the maximum load obtained by each subject.
Data analysis
A biological signal acquisition module (Lynx) was used, with four channels con-nected to monopolar (differential way) pas-sive surface electrodes (Ag/AgCl) measuring 1 cm in diameter. The electrodes were posi-tioned along the muscle at a distance of 4 cm from one another bilaterally to the subject’s back after cleaning and gentle abrasion of the skin. The EMG signals were recorded from the portions of the erector spinae muscle (spi-nal process L1) where the electrodes were attached, according to the procedure described by Kumar (6).
The EMG signals were sampled at a rate of 1000 Hz, with filters at 20 and 500 Hz and were amplified 1000 times. The conversion from analog-to-digital signals was performed by an A/D circuit board with an input range of -5 to +5 volts (CAD 1026 - Lynx). The common mode rejection ratio was 80 dB. A specific software program (Aqdados - Lynx) was used to capture the signals.
The RMS obtained for the concentric phase was calculated and correlated with the number of data recorded during the 1-min test. The spectral analysis was based on the isometric contractions (3 s).
Resultsand Discussion
Table 1 reports the median frequency before and after the 1-min test and Table 2
Table 1. Median frequency (MF in Hz) before and after the 1-min test on both the right and left sides with the application of 15, 25 and 50% of maximum load.
Subject Load Right side Left side
MF before MF after MF before MF after
1 15% 72.26 74.21 56.64 66.40
25% 74.21 76.17 69.33 65.42
50% 65.42 68.35 57.61 53.71
2 15% 82.03 83.98 75.19 74.21
25% 59.57 67.38 73.24 71.28
50% 62.50 55.66 69.33 68.35
3 15% 67.38 62.50 63.47 71.28
25% 85.93 75.19 59.57 68.35
50% 61.52 61.52 62.50 69.33
4 15% 77.14 69.33 65.42 64.45
25% 71.28 72.26 62.50 63.47
50% 76.17 61.52 73.24 59.57
5 15% 66.40 58.59 68.35 70.31
25% 75.19 76.17 66.40 70.31
50% 73.24 75.19 65.42 66.40
6 15% 70.31 69.33 65.42 63.47
25% 70.31 69.33 78.12 64.45
50% 61.52 57.61 65.42 62.50
7 15% 64.45 67.38 73.24 71.28
25% 75.19 66.40 115.23 83.00
50% 65.42 63.47 71.28 63.47
8 15% 73.24 74.21 73.26 62.50
25% 76.17 73.24 66.40 69.33
50% 69.33 63.47 66.40 60.54
9 15% 81.05 77.14 73.24 83.00
25% 83.00 68.35 83.00 73.24
50% 63.47 57.61 70.31 69.33
Mean ± SD 15% 72.70 ± 6.31 70.74 ± 7.67 68.25 ± 6.09 69.66 ± 6.44
25% 74.54 ± 7.56 71.61 ± 3.85 74.87 ± 16.84 69.87 ± 5.90
50% 66.71 ± 5.29 62.71 ± 6.05 66.83 ± 4.84 63.69 ± 5.25
No significant differences were observed (Wilcoxon test).
Figure 1. M.A. ISOSTATION 2000 device. A, Isometric contractions and initial position in the 1-min test; B, final position in the 1-min test.
erector spinae muscle in the lumbar area using spectral analysis and identifying fa-tigue by the evident drop in median fre-quency.
Since surface electrodes were used in the present study, the reduction of median fre-quency is consistent with the findings of Bigland-Ritchie et al. (25) and Moritani et al. (26), who highlighted the presence of low frequency components associated with an increase in the amplitude of the EMG signal in their study of sustained contractions. This can be explained by the shape of the motor unit action potential wave, which showed a longer duration and lower conduction speed for a longer time lapse to cross the electrode. Because the present protocol failed to present the results expected regarding the fatigue process, we suggest that adjustments should be made in order to use it to assess individuals that usually subject this muscle to overloads.
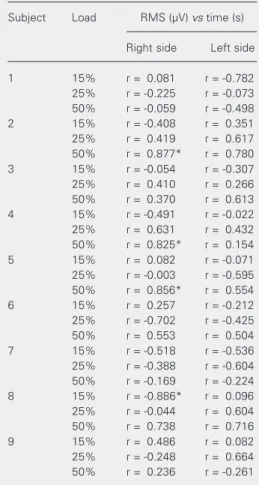
No marked increase in RMS versus time was found on either the right (N = 4) or the left (N = 3) side during the load-lifting phase using 15% of the maximum load (Table 2). With 25% of the maximum load, however, although no predominant increase of RMS versus time was observed on the right side (N = 3), a slight increase did occur on the left side (N = 5). Last, with 50% of maximum load, most of the volunteers showed an in-crease in RMS versus time on both the right (N = 7) and the left (N = 6) side, indicating a tendency to become fatigued. These find-ings are consistent with those reported by Bigland-Ritchie et al. (27) and Wittekopf et al. (18), who observed that, when the muscle displays localized fatigue after repeated con-tractions, the EMG signals increase. This is even more explicitly reported in the study by Sparto and Parnianpour (28), whose evalua-tions of erector spinae muscle fatigue re-vealed a 75% increase of EMG activity with decreased loads.
The protocol tested here proved to be more reliable with the use of loads exceed-Table 2. Correlation between root mean square
(RMS) and time during the 1-min test on both the right and left sides with the application of 15, 25 and 50% of maximum load.
Subject Load RMS (µV) vs time (s)
Right side Left side
1 15% r = 0.081 r = -0.782
25% r = -0.225 r = -0.073
50% r = -0.059 r = -0.498
2 15% r = -0.408 r = 0.351
25% r = 0.419 r = 0.617
50% r = 0.877* r = 0.780
3 15% r = -0.054 r = -0.307
25% r = 0.410 r = 0.266
50% r = 0.370 r = 0.613
4 15% r = -0.491 r = -0.022
25% r = 0.631 r = 0.432
50% r = 0.825* r = 0.154
5 15% r = 0.082 r = -0.071
25% r = -0.003 r = -0.595
50% r = 0.856* r = 0.554
6 15% r = 0.257 r = -0.212
25% r = -0.702 r = -0.425
50% r = 0.553 r = 0.504
7 15% r = -0.518 r = -0.536
25% r = -0.388 r = -0.604
50% r = -0.169 r = -0.224
8 15% r = -0.886* r = 0.096
25% r = -0.044 r = 0.604
50% r = 0.738 r = 0.716
9 15% r = 0.486 r = 0.082
25% r = -0.248 r = 0.664
50% r = 0.236 r = -0.261
*P < 0.05, correlation of RMS vs time (linear regression test).
ing 50% of the maximum for the identifica-tion of muscle fatigue by EMG as a funcidentifica-tion of time. The loads used in this study had no significant effect on the identification of fa-tigue related to alterations in median fre-quency in the erector spinae muscle on either
References
1. Gonçalves M (1998). Variáveis biomecânicas analisadas durante o levantamento manual de carga. Motriz, 4: 85-88.
2. Cardozo AC, Gauglitz ACF & Gonçalves M (2001). Resposta espec-tral do músculo eretor da espinha durante contrações isométricas obtidas por eletromiografia de superfície. Anais do Nono Congresso Brasileiro de Biomecânica, Gramado, RS, Brazil, 348(a)-348(f). 3. Gauglitz ACF, Gonçalves M, Cardozo AC, Malagodi BM & Silva SRD
(2001). Levantamento de carga durante o movimento repetitivo com e sem o uso do cinto pélvico: uma análise eletromiográfica. Anais do Nono Congresso Brasileiro de Biomecânica, Gramado, RS, Brazil, 332-337.
4. Gonçalves M (2000). Levantamento manual de carga a partir do solo com e sem uso de cinto pélvico, e com diferentes posturas do tronco: um estudo eletromiográfico. Revista Brasileira de Biomecâ-nica, 1: 49-54.
5. Gonçalves M & Silva SRD (2001). O efeito do uso de cinto pélvico em teste para determinação do limiar de fadiga eletromiográfico. Anais do Nono Congresso Brasileiro de Biomecânica, Gramado, RS, Brazil, 311-316.
6. Kumar S (1997). The effect of sustained spinal load on intra-abdomi-nal pressure and EMG characteristics of trunk muscles. Ergonom-ics, 40: 1312-1334.
7. Roy SH, De Luca CJ, Emley M & Bujis RJ (1995). Spectral electro-myographic assessment of back muscles in patients with low back pain undergoing rehabilitation. Spine, 20: 38-48.
8. deVries HA, Moritani T, Nagata A & Magnussen K (1982). The relation between critical power and neuromuscular fatigue as esti-mated from electromyographic data. Ergonomics, 25: 783-791. 9. Matsumoto T, Ito K & Moritani T (1991). The relationship between
anaerobic threshold and electromyographic fatigue threshold in col-league women. European Journal of Applied Physiology, 63: 1-5. 10. Moritani T, Takaishi T & Matsumoto T (1993). Determination of
maximal power output at neuromuscular fatigue threshold. Journal of Applied Physiology, 31: 1729-1734.
11. Pavlat JD, Housh TJ, Johnson GU & Eckerson JM (1995). Electro-myographic responses at the neuromuscular fatigue threshold. Jour-nal of Sports Medicine and Physical Fitness, 35: 31-37.
12. Vitasalo JT, Luhtanen P, Rahkila P & Rusko H (1985). Electromyo-graphic activity related to aerobic and anaerobic threshold in ergom-eter bicycling. Acta Physiologica Scandinavica, 124: 287-293. 13. Dolan P, Mannion AF & Adams MA (1995). Fatigue of the erector
spinae muscles. A quantitative assessment using “frequency band-ing” of the surface electromyography signal. Journal of Biomechan-ics, 20: 149-159.
14. Kim SH & Chung MK (1995). Effects of posture, weight and fre-quency on trunk muscular activity and fatigue during repetitive lifting tasks. Ergonomics, 38: 853-863.
15. Van Dieen JH, Oude Vrielink HHE & Toussaint HM (1993). Trunk
extensor endurance and its relationship to electromyogram param-eters. European Journal of Applied Physiology and Occupational Physiology, 66: 388-396.
16. Ng JK & Richardson CA (1996). Reliability of electromyographic power spectral analysis of back muscle endurance in healthy sub-jects. Archives of Physical Medicine and Rehabilitation, 77: 259-264.
17. Nakamaru Y & Schwartz A (1972). The influence of hydrogen ion concentration on calcium binding and release by skeletal muscle sarcoplasmatic reticulum. Journal of General Physiology, 59: 22-32. 18. Wittekopf TG, Schaaf E & Taubenheim H (1975). Use of electromy-ography for quantification of local muscular fatigue following a known strength-endurance load. Proceedings of Biomechanics V-A International Series on Biomechanics, University Park Press, Balti-more, MD, USA, 1-A: 185-193.
19. Basmajian JV & De Luca CJ (1985). Muscles Alive: Their Functions Revealed by Electromyography. Williams and Wilkins, Baltimore, MD, USA.
20. Hänninen O, Airaksinen O, Karipohja M, Manninen K, Sihvonen T & Pekkarinen H (1989). On-line determination of anaerobic threshold with rms-EMG. Biomedica Biochimica Acta, 48: S493-S503. 21. Tortoza C & Gonçalves M (1994). Montagem de um sistema de
sinalização para aquisição simultânea de sinais eletromiográficos e cinematográficos. Resumos do Quinto Congresso de Iniciação Científica da UNESP, Campus de Rio Claro, Rio Claro, SP, Brazil, 98. 22. Bittencourt N (1984). Musculação: uma abordagem metodológica.
2nd edn. Sprint, Rio de Janeiro, RJ, Brazil.
23. Elfving B, Nemeth G, Arvidsson I & Lamontagne M (1999). Reliabil-ity of EMG spectral parameters in repeated measurements of back muscle fatigue. Journal of Electromyography and Kinesiology, 9: 235-243.
24. Seidel H, Beyer H & Bräuer D (1987). Electromyographic evaluation of back muscle fatigue with repeated sustained contractions of different strengths. European Journal of Applied Physiology, 56: 592-602.
25. Bigland-Ritchie B, Jones DA, Hosking GP & Edwards RNT (1978). Central and peripheral fatigue in sustained maximum voluntary contractions of human quadriceps muscle. Clinical Science and Molecular Medicine, 54: 609-614.
26. Moritani T, Nagata A & Muro M (1982). Electromyographic manifes-tations of muscular fatigue. Medicine and Science in Sports and Exercise, 14: 198-202.
27. Bigland-Ritchie B, Donovan EF & Roussos CS (1981). Conduction velocity EMG power spectrum changes in fatigue of sustained maximal efforts. Journal of Applied Physiology, 51: 1300-1305. 28. Sparto PJ & Parnianpour M (1998). Estimation of trunk muscle
forces and spinal loads during fatiguing repetitive trunk exertions. Spine, 23: 2563-2573.