SED
7, 3645–3687, 2015Soil indicators for dryland restoration
E. A. C. Costantini et al.
Title Page
Abstract Introduction
Conclusions References
Tables Figures
◭ ◮
◭ ◮
Back Close
Full Screen / Esc
Printer-friendly Version Interactive Discussion
Discussion
P
a
per
|
Discussion
P
a
per
|
Discussion
P
a
per
|
Discussion
P
a
per
|
Solid Earth Discuss., 7, 3645–3687, 2015 www.solid-earth-discuss.net/7/3645/2015/ doi:10.5194/sed-7-3645-2015
© Author(s) 2015. CC Attribution 3.0 License.
This discussion paper is/has been under review for the journal Solid Earth (SE). Please refer to the corresponding final paper in SE if available.
Soil indicators to assess the e
ff
ectiveness
of restoration strategies in dryland
ecosystems
E. A. C. Costantini1, C. Branquinho2, A. Nunes2, G. Schwilch3, I. Stavi4, A. Valdecantos5, and C. Zucca6
1
Consiglio per la ricerca in agricoltura e l’analisi dell’economia agraria, Agrobiology and Pedology Research Centre, Firenze, Italy
2
Centre for Ecology, Evolution and Environmental changes, Faculdade de Ciências da Universidade de Lisboa, Campo Grande, Lisboa, Portugal
3
Centre for Development and Environment (CDE), University of Bern, Bern, Switzerland
4
Dead Sea and Arava Science Center, Yotvata 88820, Israel
5
Centro de Estudios Ambientales del Mediterráneo (CEAM), Valencia, Spain and Dep. Ecologia, Universidad de Alicante, Alicante, Spain
6
SED
7, 3645–3687, 2015Soil indicators for dryland restoration
E. A. C. Costantini et al.
Title Page
Abstract Introduction
Conclusions References
Tables Figures
◭ ◮
◭ ◮
Back Close
Full Screen / Esc
Printer-friendly Version Interactive Discussion
Discussion
P
a
per
|
Discussion
P
a
per
|
Discussion
P
a
per
|
Discussion
P
a
per
|
Received: 24 November 2015 – Accepted: 24 November 2015 – Published: 8 December 2015 Correspondence to: E. A. C. Costantini ([email protected])
SED
7, 3645–3687, 2015Soil indicators for dryland restoration
E. A. C. Costantini et al.
Title Page
Abstract Introduction
Conclusions References
Tables Figures
◭ ◮
◭ ◮
Back Close
Full Screen / Esc
Printer-friendly Version Interactive Discussion
Discussion
P
a
per
|
Discussion
P
a
per
|
Discussion
P
a
per
|
Discussion
P
a
per
|
Abstract
Soil indicators may be used for assessing both land suitability for restoration and the ef-fectiveness of restoration strategies in restoring ecosystem functioning and services. In this review paper, several soil indicators, which can be used to assess the effectiveness of restoration strategies in dryland ecosystems at different spatial and temporal scales,
5
are discussed. The selected indicators represent the different viewpoints of pedology, ecology, hydrology, and land management.
The recovery of soil capacity to provide ecosystem services is primarily obtained by increasing soil rooting depth and volume, and augmenting water accessibility for veg-etation. Soil characteristics can be used either as indicators of suitability, that is,
inher-10
ently slow-changing soil qualities, or as indicators for modifications, namely dynamic, thus “manageable” soil qualities. Soil organic matter forms, as well as biochemistry, micro- and meso-biology, are among the most utilized dynamic indicators. On broader territorial scales, the Landscape Function Analysis uses a functional approach, where the effectiveness of restoration strategies is assessed by combining the analysis of
15
spatial pattern of vegetation with qualitative soil indicators. For more holistic and com-prehensive projects, effective strategies to combat desertification should integrate soil indicators with biophysical and socio-economic evaluation and include participatory approaches. The integrated assessment protocol of Sustainable Land Management developed by the World Overview of Conservation Approaches and Technologies
net-20
work is thoroughly discussed.
Two overall outcomes stem from the review: (i) the success of restoration projects re-lies on a proper understanding of their ecology, namely the relationships between soil, plants, hydrology, climate, and land management at different scales, which is particu-larly complex due to the heterogeneous pattern of ecosystems functioning in drylands,
25
SED
7, 3645–3687, 2015Soil indicators for dryland restoration
E. A. C. Costantini et al.
Title Page
Abstract Introduction
Conclusions References
Tables Figures
◭ ◮
◭ ◮
Back Close
Full Screen / Esc
Printer-friendly Version Interactive Discussion
Discussion
P
a
per
|
Discussion
P
a
per
|
Discussion
P
a
per
|
Discussion
P
a
per
|
1 Introduction
Restoring degraded drylands is a complex issue that can be pursued by means of several strategies, all of which consider soil characteristics, either directly or indirectly. If soil nature is of utmost importance in designing restoration strategies, soil dynamic properties can be used to monitor and assess the consequences of restoration
ac-5
tivities on ecosystem functioning and services. Finding suitable indicators to monitor restoration activities at different scales, both within ecosystems and in the broader socio-economic system, requires: (i) a full understanding of soil–plant–ecosystem re-lationships, (ii) an interdisciplinary and integrative approach to restoration issues. The integration of different viewpoints from complementary disciplines is, nevertheless, still
10
uncommon in restoration. Drylands’ restoration, due to their idiosyncratic characteris-tics of high spatial heterogeneity and temporal variability, represents an even greater challenge, requiring restoration indicators able to reflect different spatial and temporal scales. The objective of this review is to present and discuss soil indicators showing potential to check the effectiveness of restoration activities in drylands at different
spa-15
tial and temporal scales focusing on different ecosystem functions and by extension, to their services. The subject is treated from the viewpoints of specialists coming from different disciplines, namely pedology, ecology, hydrology, and land management, all dealing with the practice of ecosystems restoration. This paper is presented in three parts. The first part introduces linkages between land degradation, ecosystem
ser-20
vices and restoration, stressing specificities of dryland ecosystems; the second part deals with soil indices and indicators to be used before and after restoration at different scales, and their relationship with soil processes and ecosystem services; the third part addresses more integrated assessment of restoration, linking ecological issues with socio-economic perception. To achieve these aims, several soil indicators and indices
25
SED
7, 3645–3687, 2015Soil indicators for dryland restoration
E. A. C. Costantini et al.
Title Page
Abstract Introduction
Conclusions References
Tables Figures
◭ ◮
◭ ◮
Back Close
Full Screen / Esc
Printer-friendly Version Interactive Discussion
Discussion
P
a
per
|
Discussion
P
a
per
|
Discussion
P
a
per
|
Discussion
P
a
per
|
Restoration of ecosystem services in drylands
Land degradation is related to the loss of ecosystem services and is referred to as desertification when it occurs in drylands. Desertification is considered a process lead-ing to a final stage of land degradation, implylead-ing the loss of sustainable provisionlead-ing services such as agricultural and forestry production. This loss is irreversible, or has
5
very little chance of reversibility in the referenced socio-economic conditions without external inputs (“functional sterility”) (Costantini et al., 2009b).
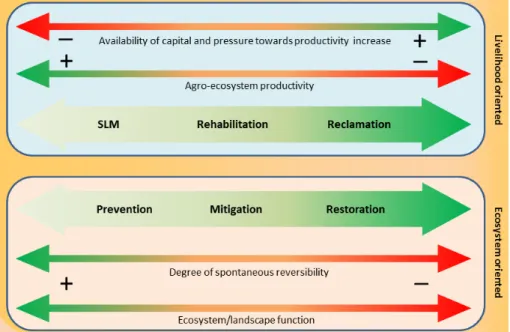
A wide range of options are available for restoring the ecosystem services in de-graded lands. Strategies intended to enhance ecosystem functions can be broadly classified as prevention, mitigation, and restoration interventions (Zucca et al., 2013a).
10
The interventions carried out in agro-ecosystems are focused at improving livelihood by conserving or increasing biological and economic productivity. In these cases, terms such as sustainable land management (SLM), rehabilitation, and reclamation are com-monly utilized for indicating increasing intervention intensities (Fig. 1).
The wide range of approaches and techniques forms a sequence of restoration
op-15
tions. Optimal choices must be context-adapted and depend on trade-off evaluation. Yet, while passive restoration activities could be effective under relatively moderate degraded conditions (e.g., removing disturbance factors), active approaches may be necessary in more heavily degraded or stressed environments. One of the passive restoration techniques, “inaction”, that is, stopping grazing in over-grazed rangelands
20
or leaving fallow intensively managed croplands, has proved to be effective over the long-term, although certain risks may threaten recovery, such as wildfires or the spread of invasive species. On the other hand, active restoration activities would require plant introduction with utilization of resources that are often limited, such as human labor, machinery, chemical products, tree planting, etc. Using vegetation is the most common
25
avail-SED
7, 3645–3687, 2015Soil indicators for dryland restoration
E. A. C. Costantini et al.
Title Page
Abstract Introduction
Conclusions References
Tables Figures
◭ ◮
◭ ◮
Back Close
Full Screen / Esc
Printer-friendly Version Interactive Discussion
Discussion
P
a
per
|
Discussion
P
a
per
|
Discussion
P
a
per
|
Discussion
P
a
per
|
ability, the restoration of degraded drylands is more challenging than those under more humid environments. It is therefore reasonable that restoration efforts in drylands by planting would primarily work to increase rooting depth and soil volume, in order to in-crease the access to larger and more stable water supplies. However, restoration of de-graded lands is more than the recovery of soil ability to support vegetation. In addition
5
to biomass production, restoration strategies should target restoration of ecosystem processes (e.g. nutrient cycling, decomposition, etc.), increasing additional ecosys-tem services such as biodiversity, carbon stock increase, greenhouse gases reduction, flood and sediment regulation, and more (MEA, 2005).
2 Specificities of dryland ecosystems: vegetation structure and dynamic 10
Drylands are water-limited environments, where evaporative demands are not compen-sated by moisture inputs through precipitation and biomass production is constrained. In general, the lower the precipitation, the higher the bare soil occurrence between shrubs and herbaceous plants. Nonetheless, the relationships between precipitation rates and vegetation cover may not be linear (Hirota et al., 2011). The frequency of
15
intermediate states between forest, grassland and savannahs is small, highlighting the occurrence of tipping points where ecosystems can shift from one physiognomic state to the other. The different vegetation physiognomies of drylands (e.g. shrublands, grasslands) have different demands of soil water and nutrients, and different soil depths at which roots uptake water.
20
Spatial heterogeneity is another important feature of drylands. In arid areas, plant spatial distribution is generally patchy and more influenced by local soil conditions and slope aspect than in humid areas (Príncipe et al., 2014). The spatial pattern of vegeta-tion causes discontinuities in biomass producvegeta-tion, affects soil fertility and interacts with trophic chains, including soil microorganisms and rate of decomposition. This spatial
25
SED
7, 3645–3687, 2015Soil indicators for dryland restoration
E. A. C. Costantini et al.
Title Page
Abstract Introduction
Conclusions References
Tables Figures
◭ ◮
◭ ◮
Back Close
Full Screen / Esc
Printer-friendly Version Interactive Discussion
Discussion
P
a
per
|
Discussion
P
a
per
|
Discussion
P
a
per
|
Discussion
P
a
per
|
resources, coupled with improved micro-climatic conditions, may facilitate the estab-lishment of other plant species underneath the canopy of trees or shrubs.
Drylands are also characterized by a high seasonal and inter-annual climatic vari-ability, resulting in a highly variable distribution of precipitation over time. This temporal variability, along with soil characteristics (e.g., soil water holding capacity), determine
5
how much water is available to plants and for how long, influencing vegetation structure and cover. Disturbance dynamics, such as livestock management, shrub clearing, or deforestation also greatly affect plant cover and vegetation structure.
2.1 Soil–plant relationships critical for restoration
The success of vegetation establishment in restoration projects of degraded drylands
10
largely depends on the extensive understanding of the relationships between soil char-acteristics and plant rooting features.
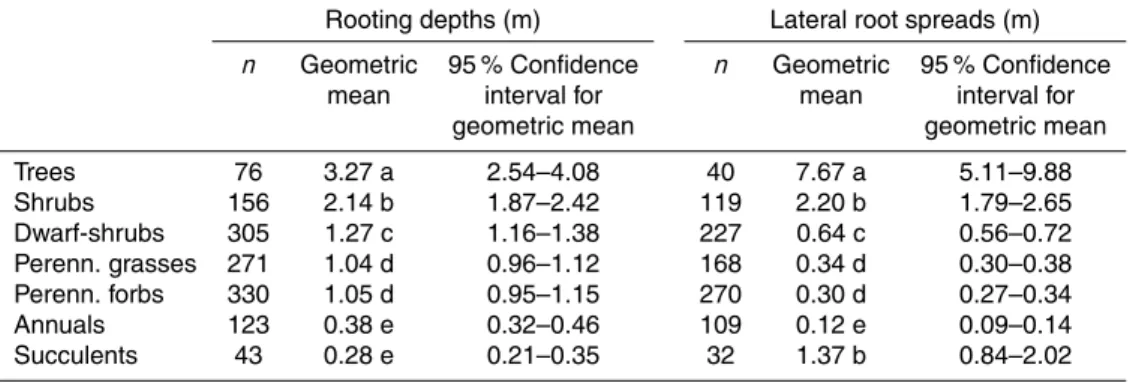
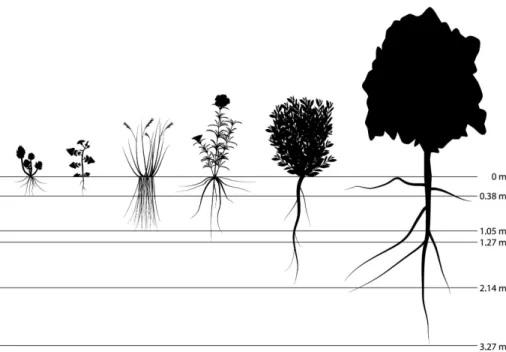
Globally, the soil depth at which different plant growth forms absorb water varies considerably (Canadell et al., 1996). In water-limited ecosystems, root sys-tems’ mean depths increase with above ground size: annuals<perennial forbs and
15
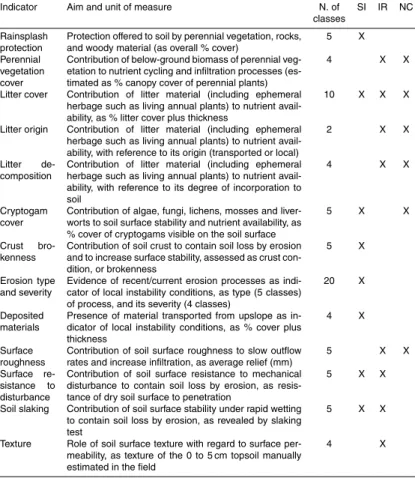
grasses<dwarf-shrubs<shrubs<trees (Table 1, Fig. 2). Stem succulents are as shal-lowly rooted as annuals but have relatively high lateral root spreads (Schenk and Jack-son, 2002a). Hence, soil properties that determine water availability along the soil pro-file largely determine the type of vegetation with potential for establishment.
For instance, savannah-like systems of holm oak (Quercus ilex L.) and cork oak
20
(Quercus suberL.) woodlands, found in western Mediterranean Basin drylands, have a grassy understory dominated by annuals, with most of the roots concentrated in the upper 20–30 cm of the soil. In general, this upper layer includes organic soil hori-zons, where the overall root density is highest, most likely because it stores nutrients and has higher water-holding capacity. However, grassland areas are often
intermin-25
SED
7, 3645–3687, 2015Soil indicators for dryland restoration
E. A. C. Costantini et al.
Title Page
Abstract Introduction
Conclusions References
Tables Figures
◭ ◮
◭ ◮
Back Close
Full Screen / Esc
Printer-friendly Version Interactive Discussion
Discussion
P
a
per
|
Discussion
P
a
per
|
Discussion
P
a
per
|
Discussion
P
a
per
|
may improve water-use efficiency. When soils are deeper, shallow rooted shrubs may coexist with deeper rooting plants such as the strawberry tree (Arbutus unedo L.) or the mastic tree (Pistacia lentiscusL.) that may get water lower than 2 m (Silva et al., 2002). Deep roots play a fundamental role during the dry season, because they reach deeper layers where water depletion is not as widespread as at the surface. In fact, the
5
dominant oak trees in Mediterranean woodlands seem to get water from even deeper depths (groundwater), particularly during the dry season (Kurz-Besson et al., 2006).
Another example is the Ibero–North African dryland steppe, dominated by the peren-nial alpha grass (Stipa tenacissimaL.). Its root system goes no further than 50 cm depth (Cortina et al., 2009), somewhat similar to the aforementioned shallow-rooting shrubs,
10
enabling the species to access upper soil layers after small rainfall events. In these en-vironments, biological soil crusts are a prominent feature covering bare soil. They play an important role by protecting soil surface from wind and water erosion, participating in nutrient cycling, reducing loss of water due to evaporation, and taking part in biotic interactions (e.g. influencing seed germination of vascular plants) (Bowker et al., 2014).
15
Biological soil crusts have been introduced in deserts in several parts of the world in order to help prevent erosion and desertification (e.g., USA, China, Israel).
Soil heterogeneity is reflected in water distribution and availability for root uptake along the soil profile. The major factors affecting this distribution are soil particle size and seasonality of precipitation. Water-limited ecosystems tend to have deeper root
20
systems in coarse-textured soils than in fine-textured soils, because the former have lower water-holding capacity and water tends to percolate more deeply, where ground-water, or a temporary perched water table, may be present. Conversely, the existence of a restrictive soil layer, for instance, in soils with a compacted or cemented layer, or high clay content in the subsoil, or showing shrink-swell properties (Vertisols), may
25
SED
7, 3645–3687, 2015Soil indicators for dryland restoration
E. A. C. Costantini et al.
Title Page
Abstract Introduction
Conclusions References
Tables Figures
◭ ◮
◭ ◮
Back Close
Full Screen / Esc
Printer-friendly Version Interactive Discussion
Discussion
P
a
per
|
Discussion
P
a
per
|
Discussion
P
a
per
|
Discussion
P
a
per
|
The residence time of water in soil, i.e., the period during which water remains avail-able at a certain soil layer after a precipitation event, is particularly important for plant community in water limited ecosystems, especially during the growing season. The longer the period during which water is available, the greater the opportunity for plants to survive, grow and reproduce. For instance and in general, if water is retained in the
5
uppermost soil layers, that may be beneficial for shallow-rooting herbaceous species germination and establishment. On the other hand, if water percolates rapidly to deeper layers, that may favor woody vegetation.
Precipitation distribution and seasonality, i.e., if precipitation is evenly distributed throughout the year or occurs during the cold or warm seasons of the year, plays a key
10
role regarding water availability for plants along the soil profile. In drylands, shrubs are more shallowly rooted in climates with summer than winter precipitation regimes (Schenk and Jackson, 2002b). This is likely because in climates with summer precip-itations, the residence time of water in the soil is shorter, and a wider and shallower root system is better able to uptake water before it evaporates. Good examples of this
15
are succulent species, which are in general as shallowly rooted as annuals, but have denser lateral root systems, similar to shrubs. This life form becomes very widespread when low precipitation amounts are coupled with high temperatures, and hence water residence time is very short.
The assessment of water residence time in soils, and in particular, the information
20
about when and for how long soil water is available to plants, is thus of major impor-tance to predict the most suitable type of plant community for a given site.
3 The interaction between climatic aridity and soil characteristics: the soil aridity index
The aridity index (rainfall/evapotranspiration ratio, AI) has been taken by the United
Na-25
rela-SED
7, 3645–3687, 2015Soil indicators for dryland restoration
E. A. C. Costantini et al.
Title Page
Abstract Introduction
Conclusions References
Tables Figures
◭ ◮
◭ ◮
Back Close
Full Screen / Esc
Printer-friendly Version Interactive Discussion
Discussion
P
a
per
|
Discussion
P
a
per
|
Discussion
P
a
per
|
Discussion
P
a
per
|
tive ease it can be calculated from standard climatic data. However, the AI has several drawbacks. For example, it does not take into account the capacity of the soil to regu-late water availability, deep drainage and runoff, which can vary noticeably inside the same climatic region. This is particularly true in transitional eco-zones, such as in the Mediterranean basin, where lands at high and low risk of desertification are very often
5
finely intermingled (Costantini et al., 2009b).
Pedoclimate, that is soil moisture and temperature regimes, has also been used to characterize areas with a certain desertification risk (Eswaran and Reich, 1998). Ac-tually, the American Soil Taxonomy considers soil moisture regime based on a yearly assessment of the number of days in which the soil moisture control section is
ei-10
ther moist, partially dry, or completely dry, while soil temperature regime classification refers to mean annual temperature at 50 cm depth (Soil Survey Staff, 1999). Pedocli-mate can be used as an indicator of inherent soil quality at different geographic scales. On a broader level, soil moisture and temperature regimes are used to delineate the areas at potential risk of desertification. In particular, the aridic, xeric, dry xeric and
us-15
tic soil moisture regimes refer to areas with varying degrees of potential water deficit, while soils with thermic and hyperthermic temperature regimes refer to lands with high temperatures in the root zone. At a more detailed level, the soil aridity index (SAI) was calculated as the average cumulative days per year when the soil moisture control sec-tion was completely dry (number of days with dry soil) (Costantini et al., 2009a). The
20
SAI was specifically aimed at highlighting the differences in pedoclimate that may result from the rather detailed combinations of shallow soils, or with limited available water capacity. This value was estimated using software based on the Erosion/Production In-dex Calculation (EPIC) model. SAI was related to easily available climatic and soil data through a multiple regression, linking the SAI value to long-term mean annual air
tem-25
SED
7, 3645–3687, 2015Soil indicators for dryland restoration
E. A. C. Costantini et al.
Title Page
Abstract Introduction
Conclusions References
Tables Figures
◭ ◮
◭ ◮
Back Close
Full Screen / Esc
Printer-friendly Version Interactive Discussion
Discussion
P
a
per
|
Discussion
P
a
per
|
Discussion
P
a
per
|
Discussion
P
a
per
|
the AI (Costantini et al., 2009b). Being influenced by both soil and climate variations, SAI is particularly useful in highlighting vulnerable lands where increased rainfall deficit and enhanced soil erosion could lead to desertification. However, the use of the SAI at scales finer than national and regional should be improved by adding the influence of local morphology on runoffand subsurface water flows.
5
4 Soil indicators
Soil ecosystem services are determined by soil properties and their assessment re-quires the use of selected indicators (Calzolari et al., 2016). A wide range of soil indi-cators may be used, depending on the purpose and scale of evaluation. In restoration planning, soil indicators are needed to support both the design and monitoring phases.
10
However, different information is needed for these two purposes. The design phase mainly requires information about soil (and site) attributes that may affect the probability of success of the intervention. The input properties used to work the indicators can be both inherent characteristics (De la Rosa and Sobral, 2008) such as topographic slope angle and aspect, surface rockiness, soil depth, texture, stoniness, structure, presence
15
of subsoil pans, and subsoil wetness conditions, or more dynamic attributes such as acidity and salinity. Planning can be supported by the identification of “optimal” ranges of values of such variables that increase chances of success of restoration and/or de-crease risks and costs, and this can be done by means of land suitability schemes. Several approaches are available to create indicators, ranging from traditional
categor-20
ical or parametric schemes (Giordano, 2009) to more complex approaches integrating multicriteria analysis and decision support frameworks (Yi and Wang, 2013; Uribe et al., 2014).
The soil information needed to monitor and assess restoration depends on the time and spatial scales. In the short term, it might be important to focus on dynamic
prop-25
SED
7, 3645–3687, 2015Soil indicators for dryland restoration
E. A. C. Costantini et al.
Title Page
Abstract Introduction
Conclusions References
Tables Figures
◭ ◮
◭ ◮
Back Close
Full Screen / Esc
Printer-friendly Version Interactive Discussion
Discussion
P
a
per
|
Discussion
P
a
per
|
Discussion
P
a
per
|
Discussion
P
a
per
|
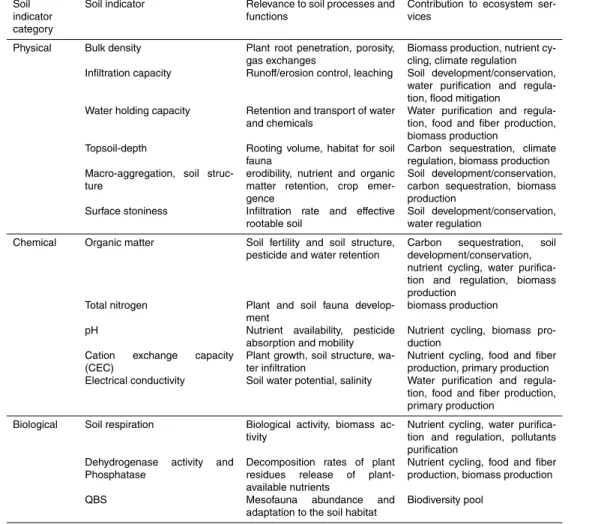
of ecosystems, particularly in drylands, it is critical that indicators focus on “slow vari-ables” (Carpenter and Turner, 2000) so that the assessment of long-term changes and of the sustainability of land management is not confused by short-term variations in land and socio-economic conditions (Zucca et al., 2013a). Slow indicators can more directly reflect impacts on inherent soil qualities, e.g., through improved structure and
5
porosity and increased topsoil depth and water holding capacity. Table 2 shows a list of the most frequently used soil indicators, specifying their functional relevance.
4.1 Physical and hydrological soil indicators
In drylands, the most important soil indicators refer to the factors regulating water avail-ability, which by itself, directly or indirectly depends on several morphological and
phys-10
ical soil properties, as well as on physiographic and land-use factors (Table 3).
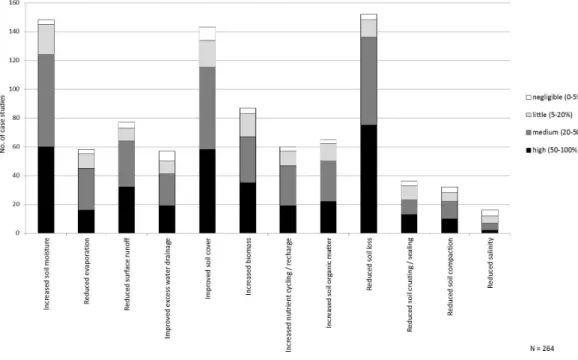
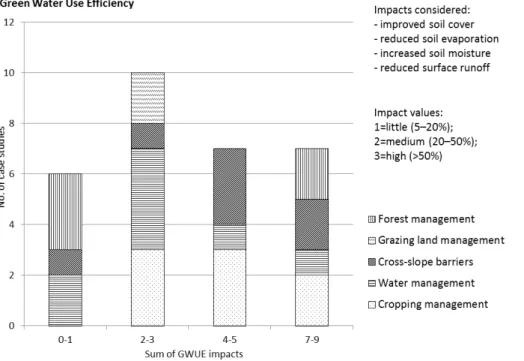
A number of physical and hydrological soil indicators are available in order to assess efficiency of restoration activities such as sustainable land management (SLM) prac-tices. Analyzing the SLM practices documented in the World Overview of Conserva-tion Approaches and Technologies database (WOCAT, 2015) regarding these impacts
15
confirms that water is the most common limiting factor for the provisioning service in drylands (Fig. 3). Improving soil moisture through in-situ conservation of rainwater or irrigation water often result in increased ecosystem services like production of food, fodder, fiber or fuel. Yet, runoffcontrol is also important not only for increasing water availability but also for decreasing erosional processes and restoring the water cycle
20
and regulation (e.g., flood control).
Rainfall and water availability are the crucial threat in drylands due to scarcity and variability, thus, improving water use efficiency is of utmost importance. The concept of Green Water Use Efficiency (GWUE), expressed as the fraction of plant transpiration over precipitation (Stroosnijder, 2009), provides a useful indicator in order to evaluate
25
hy-SED
7, 3645–3687, 2015Soil indicators for dryland restoration
E. A. C. Costantini et al.
Title Page
Abstract Introduction
Conclusions References
Tables Figures
◭ ◮
◭ ◮
Back Close
Full Screen / Esc
Printer-friendly Version Interactive Discussion
Discussion
P
a
per
|
Discussion
P
a
per
|
Discussion
P
a
per
|
Discussion
P
a
per
|
drology and hydrological processes allows quantifying the effect of land management on blue and green water distribution. The concept of blue and green water aims at shift-ing non-productive evaporation towards productive transpiration to improve biomass production without reducing the amount of blue water leaving a watershed. Reducing direct soil evaporation and thereby forcing it to be transpired through the plants is thus
5
one of the key ideas behind turning blue water into green water. Better utilization of rainfall to capitalize on green water requires appropriate land and crop management systems, which can improve water-use efficiency. These can be evaluated again with the GWUE indicator as described above. Many indicators are difficult to measure and thus visual soil indicators are often used instead. These methods include the visual
10
soil assessment (VSA), the visual evaluation of soil structure (VESS), the visual as-sessment of aggregate stability and more. A recent study by Moncada et al. (2014) demonstrated that visual examinations are reliable semi-quantitative methods to as-sess soil structural quality and can be considered as visual predictors of soil physical properties (Moncada et al., 2014).
15
4.2 Chemical soil indicators
Several chemical soil properties may affect and be affected by restoration interventions. The inherent soil fertility is linked to the capacity of the soil to retain and exchange nutrients, a measure of which is the cation exchange capacity (CEC). The CEC is directly related to soil mineral composition, particularly clay content and type, and the
20
soil organic matter content. By increasing the latter, restoration interventions can have a direct impact on soil fertility.
Soil pH has an important role in restoration planning, as many plants used for restoration purposes have ranges of pH tolerance. For this reason, soil acidity is gen-erally included in land suitability schemes for either farming or forestry. On the other
25
SED
7, 3645–3687, 2015Soil indicators for dryland restoration
E. A. C. Costantini et al.
Title Page
Abstract Introduction
Conclusions References
Tables Figures
◭ ◮
◭ ◮
Back Close
Full Screen / Esc
Printer-friendly Version Interactive Discussion
Discussion
P
a
per
|
Discussion
P
a
per
|
Discussion
P
a
per
|
Discussion
P
a
per
|
and inland acid sulfate soils. High acidity is often found in contaminated soils of mining sites, where pH values can be very low. Restoration of such sites can be challeng-ing and amendment of soils (e.g., limchalleng-ing) may be needed before plantation in order to reduce the availability of heavy metals and, hence, phytotoxicity to target plants.
Soil alkalinity and salinity are common in degraded drylands, particularly in irrigated
5
lands degraded by inappropriate irrigation practices. Halophyte plants have been suc-cessfully used for restoring natural vegetation and/or recovering agricultural productiv-ity in degraded saline and alkaline soils, and also for remediating these soils by actively extracting salt (Hasanuzzaman et al., 2014). On the other hand (Zucca et al., 2015a), contrasting effects were observed in sites located in arid central Morocco where
halo-10
phyte shrubs (Atriplex nummularia Lindl.) were used to rehabilitate pastures. In this case, besides increasing soil organic matter and water infiltration, the plants have con-sistently increased the topsoil alkalinity (measured as SAR, or sodium adsorption ratio), showing that possible trade-offs have to be considered. Other restoration practices that imply the application of organic matter such as manures or biosolids might increase soil
15
electric conductivity and affect seedling survival during severe drought years (Fuentes et al., 2010), although this effect also depends on the target species (Oliveira et al., 2011).
4.3 Soil organic matter
Soil organic matter and its functional fractions 20
Among the several factors of the soil capacity to provide ecosystem services, soil or-ganic matter (SOM) is considered one of the most important. The main source of SOM is the above- and below-ground residues of vegetation. The humification and decompo-sition of these organic materials sustains the soil food chain, as the SOM gets utilized as a source of energy for the soil micro- and meso-fauna and fungi. At the same time,
25
SED
7, 3645–3687, 2015Soil indicators for dryland restoration
E. A. C. Costantini et al.
Title Page
Abstract Introduction
Conclusions References
Tables Figures
◭ ◮
◭ ◮
Back Close
Full Screen / Esc
Printer-friendly Version Interactive Discussion
Discussion
P
a
per
|
Discussion
P
a
per
|
Discussion
P
a
per
|
Discussion
P
a
per
|
SOM has a complex nature and the different forms which result from the humifica-tion and decomposihumifica-tion processes have varying residence time in soil (Marschner et al., 2008). However, recent analytical and experimental advances have demonstrated that SOM molecular structure has only a secondary role in controlling its stability, which instead mainly depends on the biotic and abiotic environment (Schmidt et al., 2011).
5
Actually, soil organic matter is subjected to microbial degradation and its persistence can vary depending on both chemical recalcitrance and physical protection. The dis-crepancy between chemical recalcitrance and residence time can be explained through physical protection mechanisms and physical disconnection between soil organic mat-ter and microorganisms. Physical protection mechanisms can occur at particle-size
10
and aggregate-size level through OC sorption on clay particles, as well as inclusion into micro-aggregates.
In drylands, the production of biomass, which constitutes the SOM source, is limited by water availability. In general, the size of SOM pools in natural ecosystems decreases exponentially with temperature (Lal, 2004). Consequently most drylands contain∼1 % 15
of SOM, and frequently less than 0.5 % SOM. At the same time, the smaller moisture content of soil controls decomposition rates, increasing the SOM residence time in dry-lands. SOM has an important role in determining the soil physical quality, and therefore, regulating the availability of water for vegetation. It impacts soil structure formation, par-ticularly through its positive effects on macroporosity, and macro-aggregates formation
20
and stability. As such, SOM regulates soil water infiltration and retention capacity. Be-sides regulating water availability, SOM also controls a range of ecosystem services.
In degraded drylands, where plant cover has been disrupted, the input of organic residues into the soil is considerably reduced. Furthermore, the susceptibility of de-graded drylands to accelerated erosional processes becomes exacerbated, increasing
25
SED
7, 3645–3687, 2015Soil indicators for dryland restoration
E. A. C. Costantini et al.
Title Page
Abstract Introduction
Conclusions References
Tables Figures
◭ ◮
◭ ◮
Back Close
Full Screen / Esc
Printer-friendly Version Interactive Discussion
Discussion
P
a
per
|
Discussion
P
a
per
|
Discussion
P
a
per
|
Discussion
P
a
per
|
attention should be paid to the specific restoration of this uppermost soil layer. Yet, standardized methodologies for assessing the state of SOC depletion are still missing. Besides the on-site and direct agronomic effects of SOC in terms of soil quality and pro-ductive capacity, the importance of SOC also stems from its indirect impact on surface processes. Low inputs of fresh organic matter would lead to slow macro-aggregation
5
rate, reduced macro-aggregate stability, and decreased infiltration capacity of water. Regardless, besides the overall SOC concentrations and pools, the SOC composition is also important, as it affects its persistence in soil (SOC sequestration) on the one hand, and its availability for decomposition by microbial activity, which determine the soil fertility, on the other hand.
10
SOC is composed of different functional fractions, which are defined according to their persistence capacity (vs. decomposability). The three main groups are: (1) the transient fraction, which encompasses the easiest decomposable fraction, such as polysaccharides, with a turnover rate of weeks to months; (2) the temporary fraction, which comprises fine roots and fungal hyphae that are vulnerable to land-use and
15
management; and (3) the persistent fraction, which includes the most resistant part of SOC, such as humified organic materials. These materials tend to get associated with amorphous iron, aluminum, and aluminosilicates, binding soil particles into micro-aggregates through clay–polyvalent metal–organic matter complexes, which can last for very long periods of time.
20
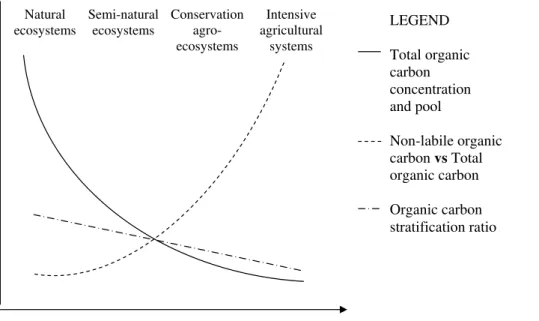
Of the above mentioned SOC functional fractions, the transient or “active” fraction, which is the most labile organic carbon (LOC) fraction, encompasses only very few percent of the overall SOC pool. Yet, since the LOC is the most responsive to land-use change and management practices (Fig. 5), it should be considered as a land-useful indicator of the overall status of soils. Moreover, the measurement of both LOC and total
25
SOC enables to determine the carbon lability (L), which indicates the ratio between LOC and non-LOC organic carbon (Blair et al., 1995).Lis determined by the equation:
SED
7, 3645–3687, 2015Soil indicators for dryland restoration
E. A. C. Costantini et al.
Title Page
Abstract Introduction
Conclusions References
Tables Figures
◭ ◮
◭ ◮
Back Close
Full Screen / Esc
Printer-friendly Version Interactive Discussion
Discussion
P
a
per
|
Discussion
P
a
per
|
Discussion
P
a
per
|
Discussion
P
a
per
|
Three carbon-management related indices can be utilized for monitoring the impact of land-use change and management practices on the SOC pool. The first is the carbon pool index (CPI), which indicates the effect of land-use change or management prac-tice on aggradation or degradation of the total SOC, and calculated according to the equation:
5
CPI=(total SOC in treatment soil)/(total SOC in reference soil). (2)
The second is the lability index (LI), which indicates the ratio between carbon lability in the treatment soil and carbon lability in the reference soil:
LI=(L in treatment soil)/(Lin reference soil). (3)
The third is the carbon management index (CMI), which predicts changes in
seques-10
tration and lability of SOC as a result of changes in agricultural practices:
CMI=CPI×LI. (4)
An additional advantage of the SOC-management related indices stems from their standardized (normalized) nature, easing the comparisons among different soils, ecosystems, and biomes, and their ranking according to the state along the
15
degradation-restoration continuum.
Besides concentrations, pools, and composition, another important determinant of SOC is its stratification throughout the soil profile (Franzluebbers, 2002a). Stratification ratio of SOC is calculated by the SOC concentration in a shallow depth divided by this in a deeper depth. Overall, in undisturbed soils, a clear stratification occurs, with larger
20
SOC concentrations in shallower than that in deeper layers. In disturbed soils, the SOC stratification becomes blurred (Fig. 5). Therefore, if comparing the same soil type, in the same climatic region and biome, and in the same geomorphic unit, the clear strat-ification of SOC would indicate an undisturbed soil profile, while lesser stratified SOC would indicate a certain rate of land degradation. It was suggested that the greater
SED
7, 3645–3687, 2015Soil indicators for dryland restoration
E. A. C. Costantini et al.
Title Page
Abstract Introduction
Conclusions References
Tables Figures
◭ ◮
◭ ◮
Back Close
Full Screen / Esc
Printer-friendly Version Interactive Discussion
Discussion
P
a
per
|
Discussion
P
a
per
|
Discussion
P
a
per
|
Discussion
P
a
per
|
stratification ratio in natural lands stems from the combined effect of accumulation of organic materials on the ground surface, coupled with the undisturbed soil profile. Fur-thermore, in addition to the stratification ratio of the total SOC, the stratification of active SOC fractions seems to be more sensitive to degradation than that of the total SOC (Franzluebbers, 2002b). Therefore, the SOC stratification ratio can be considered as
5
a valuable indicator of both the biological and hydrological functioning of soil. The SOC stratification ratio easily allows the comparison of different soils, since it normalizes SOC into a unitless value and overcomes the inherited soil characteristics.
4.4 Soil biochemical and microbiological indicators
It is well known that the size, composition and activity of the soil microbial communities
10
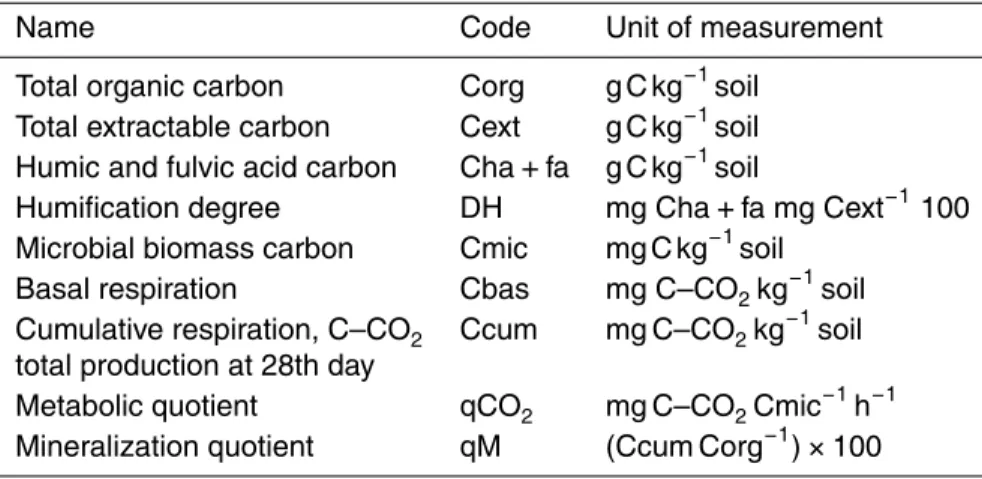
may indicate the possible success of restoration of degraded lands, and the impact of management strategies upon them (Harris, 2003). Biological indicators have been widely used to monitor soil quality changes in space and time and to assess biological fertility (Marinari et al., 2010). Most used indicators include microbial biomass carbon, microbial respiration, enzyme activities, and related indices (Table 4) (Kieft et al., 1998;
15
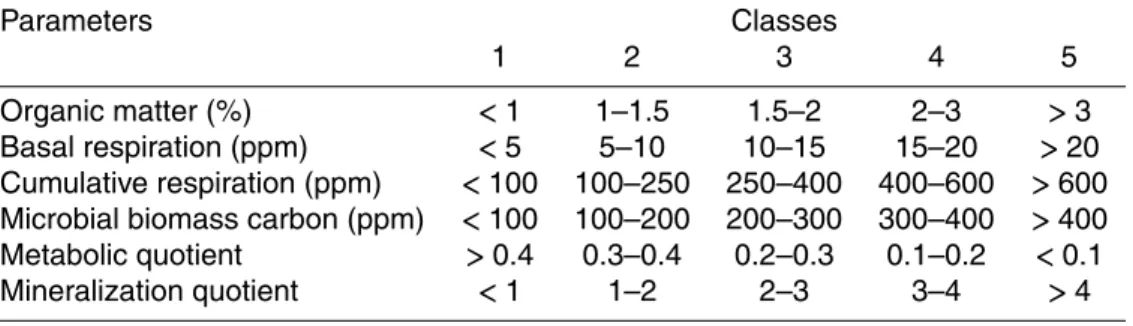
Bastida et al., 2006). Tentative classes of indicators have also been suggested to sim-plify the estimation of soil biological stress (Benedetti and Mocali, 2008) (Table 5).
In general, a number of selected microbiological indicators are already available for assessing soil functioning (Bloem et al., 2005) which are usually divided into three es-sential groups, depending on the information they provide: (1) Soil microbial biomass
20
and number, (2) Soil microbial activity, (3) Soil microbial diversity and community struc-ture.
Group (1). Several conventional methods capable of determining weight and number of soil microorganisms are based on direct or indirect procedures (Alef and Nannipieri, 1995). The assessment of the total size of the viable microbial community requires
cul-25
SED
7, 3645–3687, 2015Soil indicators for dryland restoration
E. A. C. Costantini et al.
Title Page
Abstract Introduction
Conclusions References
Tables Figures
◭ ◮
◭ ◮
Back Close
Full Screen / Esc
Printer-friendly Version Interactive Discussion
Discussion
P
a
per
|
Discussion
P
a
per
|
Discussion
P
a
per
|
Discussion
P
a
per
|
extraction (Vance et al., 1987) and substrate-induced respiration (SIR) are the most commonly used.
Group (2). The metabolic turnover of the microbial biomass and the conversion of nu-trient pools are usually assessed aspotentialactivity, as to date, no serial and routine methods are available for open field measurements. Potential activity means metabolic
5
activity, including enzymatic activities that soil microbes are capable of developing un-der optimal conditions in the laboratory. As previously reported, SOM decomposition is carried out by microorganisms through the enzymatic attack of SOM and microbial respiration: in fact, extracellular enzymes degrade SOM through hydrolytic or oxida-tive processes, producing assimilable dissolved OM that can be rapidly incorporated
10
by microbes. It is known that when substrate availability and enzyme activity do not constrain reaction rates, decomposition rates increase with temperature. Biologically-active forms of SOM can function as short-term indicators of longer-term changes in SOM.
Group (3). Currently, a number of methods are available for the assessment of soil
15
microbial diversity. The use of molecular techniques for investigating microbial diver-sity of soil communities continues to provide new understanding of soil properties and quality. The analysis of the soil-extracted nucleic acid sequences (DNA and RNA) provides a powerful tool for the characterization of the entire microbial community. Among the most useful and commonly used methods are those in which small
sub-20
unit RNA genes are amplified via Polymerase Chain Reaction (PCR) and analyzed by means of several fingerprinting techniques such as Denaturing Gradient Gel Elec-trophoresis (DGGE), Terminal Restriction Fragment Length Polymorphysm (T-RFLP) or single-strand conformational polymorphism (SSCP) (Kowalchuk, 2004). Recently, various omics approaches are rapidly advancing in soil science, although they are
25
SED
7, 3645–3687, 2015Soil indicators for dryland restoration
E. A. C. Costantini et al.
Title Page
Abstract Introduction
Conclusions References
Tables Figures
◭ ◮
◭ ◮
Back Close
Full Screen / Esc
Printer-friendly Version Interactive Discussion
Discussion
P
a
per
|
Discussion
P
a
per
|
Discussion
P
a
per
|
Discussion
P
a
per
|
The analysis of types and amounts of different phospholipid fatty acids (PLFA) is a biochemical approach that offers an alternative to molecular techniques, since it re-flects both microbial taxonomic and functional diversity. The amount of total PLFA can be used as an indicator for viable microbial biomass; a further characterization can be done based on specific signature of biomarker fatty acids. Unfortunately, this technique
5
does not include Archea organisms, since their cell membrane contains ether-linked rather than ester-linked phospholipid fatty acids (Pennanen, 2001). Functional and metabolic features of soil microbial communities have been also analyzed through the assessment of the Community-level-physiological profile (CLPP) using Biolog plates (Pignataro et al., 2012).
10
The future challenges will be addressed towards standardizing some methodolo-gies, in order to provide quick, reliable and inexpensive information. All the omics, in particular, have the potential to provide comprehensive and complementary informa-tion to tradiinforma-tional techniques, and help monitoring changes in soil funcinforma-tions at the very detailed spatial and temporal scales.
15
4.5 Soil mesofauna
Beyond the approaches to soil quality evaluation based on the use of physical, chemical and microbiological indicators, new methods, based on soil mesofauna composition (microarthropods <2 mm), have been proposed for the evaluation of soil ecosystem services, in particular, biodiversity pools. In fact, soil-dwelling animals have a significant
20
role in the colonization and in the restoration of degraded biological habitats (Star´y, 2002); their role includes litter fragmentation, soil aggregation and porosity formation, water infiltration and distribution of organic matter in soil horizons (Bird et al., 2004). According to Dickinson et al. (2005), soil biodiversity is probably the most important factor for maintaining ecosystem function in disturbed environments. The higher the
25
SED
7, 3645–3687, 2015Soil indicators for dryland restoration
E. A. C. Costantini et al.
Title Page
Abstract Introduction
Conclusions References
Tables Figures
◭ ◮
◭ ◮
Back Close
Full Screen / Esc
Printer-friendly Version Interactive Discussion
Discussion
P
a
per
|
Discussion
P
a
per
|
Discussion
P
a
per
|
Discussion
P
a
per
|
et al., 2011). Mesofauna responds to land-use and management practices and can be considered an efficient bio-indicator of ecosystem health.
Yet, one of the main problems related to the bioindices remains in the difficulty in classifying organisms at the species level. For this reason, an approach based on the types of edaphic microarthropods, the QBS-ar index, has been developed (Parisi et al.,
5
2005). It overcomes difficulties linked to the identification at species level, by focus-ing on the evaluation of the adaptability to the hypogeal life (Madej et al., 2011). The method itself is rather simple and easy: a soil sample is put in a Berlese–Tullgren ex-tractor to collect organisms, which are then observed under a stereomicroscope and identified at the taxonomic level requested by the index. According to the species
adap-10
tation to soil environment, a score from 1 to 20 (eco-morphological index, EMI) is as-signed. The QBS-ar index results from the sum of these scores. Higher values corre-spond to more complex and soil-adapted communities (Mazza et al., 2011). QBS-ar has been applied on a range of soil types and land uses and its validity was evaluated for assessing soil biodiversity in different settings.
15
5 Functional approaches in the monitoring of dryland ecosystems: the Landscape Function Analysis
Most commonly, mitigation and restoration actions are evaluated based on vegeta-tion cover and composivegeta-tion. However, funcvegeta-tional approaches that also account for the spatial pattern of vegetation seem to be more suited to the assessment of soil
ecosys-20
tem functioning. As previously highlighted, many drylands around the world present a patchy distribution of vegetation following a sink-source spatial pattern. Source ar-eas have a negative balance of resources that accumulate in the sink arar-eas. Beyond this redistribution of resources at the detailed scale, a fully functional ecosystem in-cludes the retention within the system. In dry ecosystems, vegetation patchiness can
25
SED
7, 3645–3687, 2015Soil indicators for dryland restoration
E. A. C. Costantini et al.
Title Page
Abstract Introduction
Conclusions References
Tables Figures
◭ ◮
◭ ◮
Back Close
Full Screen / Esc
Printer-friendly Version Interactive Discussion
Discussion
P
a
per
|
Discussion
P
a
per
|
Discussion
P
a
per
|
Discussion
P
a
per
|
description of the spatial distribution of vegetation (size and connectivity of different plant type patches) in combination with soil properties that determine the conservation of resources, especially regarding soil surface attributes. Landscape Function Analysis (LFA) (Tonway and Hindley, 2004) incorporates both approaches in the evaluation of dryland patchy ecosystems, using functional indicators instead of direct measures of
5
key processes which are expensive to implement. This method assigns a prominent role to the soil surface condition. The LFA uses semi-quantitative field-based indicators (Table 6) to evaluate soil surface condition at the hillslope scale in every identified type of patches and interpatches, targeting surface properties that control stability, nutrient cycling and infiltration processes. The stability index provides an idea of the
vulner-10
ability to erosion and the ability to recover after stresses, the infiltration/runoff index indicates the ratio of rainfall water available to plants and export by runoff, and the nutrient cycling index indicates the in situ recycling of organic matter. For every single type of patch or interpatch, the scores of the quantitative indicators that have an impact on a particular index are summed up and referred to the maximum possible score. The
15
final value of the index is calculated by weighing the attained values in all patch and interpatch types by its representativity in the working area.
Maestre and Puche (2009) observed significant relationships of the indices calcu-lated through LFA with measured soil variables in alpha-grass steppes in southeast Spain. These authors found that the infiltration index was positively related to soil
wa-20
ter holding capacity and negatively to soil compaction, and the nutrient cycling and stability indices were positively related to soil-nutrient variables and microbial activity. However, the sensitivity of the indices might vary depending on the scale and the con-trast between different situations. This assessment represents an inexpensive, rapid, accurate and repeatable methodology for the evaluation of soil functioning properties,
25
SED
7, 3645–3687, 2015Soil indicators for dryland restoration
E. A. C. Costantini et al.
Title Page
Abstract Introduction
Conclusions References
Tables Figures
◭ ◮
◭ ◮
Back Close
Full Screen / Esc
Printer-friendly Version Interactive Discussion
Discussion
P
a
per
|
Discussion
P
a
per
|
Discussion
P
a
per
|
Discussion
P
a
per
|
and also to monitor the effects of grazing and reforestations (Zucca et al., 2013b). LFA infiltration and nutrient cycling indexes have been observed to relate significantly to perennial species richness in Mediterranean drylands (Maestre and Cortina, 2004). In addition, some of the LFA indices, especially infiltration and nutrient cycling, show good correlations with remote sensing indices such as NDVI (Gaitán et al., 2013). The
5
combination of these two approaches at such different scales may provide useful infor-mation on ecosystem functioning and might be a good tool for dryland management by selecting and prioritizing areas to restore.
6 Integrated assessment protocols
Integrated assessment protocols combine field observations of key ecosystem
at-10
tributes, socio-economic surveys, and remote sensing (RS) based geospatial informa-tion. Particularly, to conduct the evaluation over wider areas, RS should be employed for land cover change and ecosystems’ natural temporal pattern detection, land degra-dation assessment, and analysis of the impacts of land restoration (Zucca et al., 2015b; Ramos et al., 2015). The quantification of the photosynthetically active herbaceous and
15
shrub biomass production in rangelands and savannahs is one of the most widely used metrics.
In order to more holistically assess the impacts of management and restoration mea-sures, i.e., to identify their ecological, economic and socio-cultural effects, both over the short- and long-term as well as on- and off-site, more comprehensive methods are
20
needed. The WOCAT network (www.wocat.net) has developed such methods in or-der to document and evaluate SLM technologies and approaches applied in the field. The methods are internationally standardized and since 2014, are accredited by the UNCCD as their documentation and knowledge sharing platform. The role of science in monitoring and assessing desertification, as well as mitigation/restoration actions, is to
25
SED
7, 3645–3687, 2015Soil indicators for dryland restoration
E. A. C. Costantini et al.
Title Page
Abstract Introduction
Conclusions References
Tables Figures
◭ ◮
◭ ◮
Back Close
Full Screen / Esc
Printer-friendly Version Interactive Discussion
Discussion
P
a
per
|
Discussion
P
a
per
|
Discussion
P
a
per
|
Discussion
P
a
per
|
often expensive and time-consuming and depends on the availability of skilled experts. On the other hand, stakeholder engagement in assessment of indicators is still rare or limited in scope. In order to evaluate mitigation/restoration practices, performance indicators – e.g., the impact of a given practice on degradation and its economic, eco-logical, and socio-cultural benefits or disadvantages – should be assessed. These are
5
mostly not available quantitatively, but can only be assessed qualitatively by experts, ideally according to predefined response categories (such as “no/negligible” for 0–5 %, “little” for 5–20 %, “medium” for 20–50 %, and “high” for>50 % of change) in order to ensure comparability over practices, sites and time. However, where available, quanti-tative data should be included as well (Schwilch et al., 2011, 2014). Soil and vegetation
10
related indicators used in the WOCAT SLM technology questionnaire and assessed in the above described way include soil moisture, evaporation, surface runoff, soil cover, biomass/above-ground C, nutrient cycling, soil organic matter, soil loss, plant diversity, invasive species, beneficial species, etc. Another important aspect is the evaluation of the technical function, such as whether the practice works though an improvement of
15
ground cover, surface roughness, soil structure, water availability, vegetation varieties, etc.
Based on such assessments, conclusions can be drawn as to whether and how the documented practices address key threats in drylands, i.e., by means of improved water management, reduced soil degradation, diversified and enhanced production,
20
resilience towards climate change and variability, and by providing socio-cultural ben-efits including conflict mitigation and prevention of outmigration. Such a thorough im-pact assessment is mandatory in order to justify investments in more sustainable land management. However, these investments are often beyond the means, responsibility and decision-making power of individual land users and thus an effective collaboration
25
SED
7, 3645–3687, 2015Soil indicators for dryland restoration
E. A. C. Costantini et al.
Title Page
Abstract Introduction
Conclusions References
Tables Figures
◭ ◮
◭ ◮
Back Close
Full Screen / Esc
Printer-friendly Version Interactive Discussion
Discussion
P
a
per
|
Discussion
P
a
per
|
Discussion
P
a
per
|
Discussion
P
a
per
|
ecological and technical expertise together with the land users’ experience, can only be achieved through true and effective collaboration between stakeholders. It is thus generally acknowledged that mitigating desertification requires multi-stakeholder dia-logues and collaboration (Thomas et al., 2012).
7 Conclusions 5
The development of methods for assessing the success of the actions to combat de-sertification is considered as a priority by the scientific community. The “land degrada-tion neutrality” target promoted by the UNCCD indicates that the progress made with restoration could compensate the impacts of degradation, stressing the importance of a quantitative evaluation process.
10
The failure of restoration plans is often caused by the choice of plants or prac-tices that are not suited to the site. The success of restoration plans instead relies on a proper and detailed knowledge of the relationships between soil and plant prop-erties and ecology in drylands and, in particular, on the assessment of the amount and timeframe of effective soil water availability. One of the main challenges is to select
15
the different species to be used for restoration which have a pattern of the root system matching the horizon characteristics of the soil profile, as well as the specific climate and hydrology of the site. Dryland restoration is a site-specific activity, which implies considering soil spatial and temporal heterogeneity before plant placement.
The understanding of dryland ecosystem services stems from the very detailed scale
20
of soil observation and analysis. A number of soil indicators support the design of mea-sures and the assessment/monitoring phases. Such soil indicators need to refer to soil properties, which can actually be modified through management or restoration activ-ities. Soil organic matter, in particular, is at the same time a key attribute for many ecosystem functions and one of the main factors affecting water availability. Soil
dy-25
SED
7, 3645–3687, 2015Soil indicators for dryland restoration
E. A. C. Costantini et al.
Title Page
Abstract Introduction
Conclusions References
Tables Figures
◭ ◮
◭ ◮
Back Close
Full Screen / Esc
Printer-friendly Version Interactive Discussion
Discussion
P
a
per
|
Discussion
P
a
per
|
Discussion
P
a
per
|
Discussion
P
a
per
|
forms of soil organic matter and related biological activities and organisms are still not completely understood and characterized, they are promising candidate indicators that may be utilized to assess the effectiveness of restoration strategies in dryland ecosys-tems.
A recent approach in assessing the effectiveness of restoration strategies in dryland
5
ecosystems is combining the analysis of spatial pattern of vegetation with qualitative soil surface indicators. This simplified but effective methodology, specifically tailored for the surface patterns of drylands, allows the monitoring of landscape functioning varia-tions in space and time, and it is particularly suitable for the assessments carried out at the intermediate territorial scales. On broader scales, effective strategies to combat
de-10
sertification should be based on integrated biophysical and socio-economic evaluation methods. Evaluation and monitoring of progress and success are expected to demon-strate the benefits of sustainable management, establish cost-effective thresholds for intervention alternatives, and identify priority areas for action. Recent approaches pro-pose to assess and evaluate the effectiveness of management and restoration
pro-15
grams based on indicators that relate to ecosystem integrity and services, as well as socio-economic and cultural variables related to human well-being, both over the short-and long-term, as well as on- short-and off-site. To this aim, there is a need for interaction and dialog among the diverse set of scientists and stakeholders involved, which can result in a co-production of new knowledge and at the same time in the formulation of
20
new knowledge needs.
Acknowledgements. COST Action ES1104 “Arid Lands Restoration and Combat of Desertifi-cation: Setting Up a Drylands and Desert Restoration Hub” is acknowledged for facilitating the establishment of the scientific network which permitted the production of this paper. A special thanks is given to Stefano Mocali, of CREA-ABP, for his useful suggestions and comments on 25
SED
7, 3645–3687, 2015Soil indicators for dryland restoration
E. A. C. Costantini et al.
Title Page
Abstract Introduction
Conclusions References
Tables Figures
◭ ◮
◭ ◮
Back Close
Full Screen / Esc
Printer-friendly Version Interactive Discussion
Discussion
P
a
per
|
Discussion
P
a
per
|
Discussion
P
a
per
|
Discussion
P
a
per
|
References
Alef, K. and Nannipieri, P.: Methods in Applied Soil Microbiology and Biochemistry, Academic Press, San Diego, USA, 1995.
Bastida, F., Moreno, J. L., Hernandez, T., and García, C.: Microbiological degradation index of soils in a semiarid climate, Soil Biol. Biochem., 38, 3463–3473, 2006.
5
Benedetti, A. and Mocali, S.: Analisi a livello di suolo, in: Indicatori di biodiversità per la sosteni-bilità in agricoltura, Roma, Italy, 159–208, 2008.
Benedetti, A. and Mocali, S.: Exploring research frontiers in microbiology: the challenge of metagenomics in soil microbiology, Res. Microbiol., 161, 497–505, 2010.
Bird, S. B., Coulson, R. N., and Fisher, R. F.: Changes in soil and litter arthropod abundance 10
following tree harvesting and site preparation in a loblolly pine (Pinus taeda L.) plantation, Forest Ecol. Manag., 202, 195–208, 2004.
Blair, G. J., Lefroy, R. D., and Lisle, L.: Soil carbon fractions based on their degree of oxidation, and the development of a carbon management index for agricultural systems, Crop Pasture Sci., 46, 1459–1466, 1995.
15
Bloem, J., Schouten, A., Sørensen, S. J., Rutgers, M., Werf, A., Breure, A., Hopkins, D., and Benedetti, A.: Monitoring and evaluating soil quality, in: Microbiological Methods for Assess-ing Soil Quality, CAB eBooks, 23–49, 2005.
Bowker, M. A., Maestre, F. T., Eldridge, D., Belnap, J., Castillo-Monroy, A., Escolar, C., and Soliveres, S.: Biological soil crusts (biocrusts) as a model system in community, landscape 20
and ecosystem ecology, Biodivers. Conserv., 23, 1619–1637, 2014.
Calzolari, C., Ungaro, F., Filippi, N., Guermandi, M., Malucelli, F., Marchi, N., Staffilani, F., and Tarocco, P.: A methodological framework to assess the multiple contributions of soils to ecosystem services delivery at regional scale, Geoderma, 261, 190–203, 2016.
Canadell, J., Jackson, R., Ehleringer, J., Mooney, H., Sala, O., and Schulze, E.-D.: Maximum 25
rooting depth of vegetation types at the global scale, Oecologia, 108, 583–595, 1996. Carpenter, S. R. and Turner, M. G.: Hares and tortoises: interactions of fast and slow variablesin
ecosystems, Ecosystems, 3, 495–497, 2000.
Cerdà, A.: The effect of patchy distribution ofStipa tenacissimaL. on runoffand erosion, J. Arid Environ., 36, 37–51, 1997.
30
SED
7, 3645–3687, 2015Soil indicators for dryland restoration
E. A. C. Costantini et al.
Title Page
Abstract Introduction
Conclusions References
Tables Figures
◭ ◮
◭ ◮
Back Close
Full Screen / Esc
Printer-friendly Version Interactive Discussion
Discussion
P
a
per
|
Discussion
P
a
per
|
Discussion
P
a
per
|
Discussion
P
a
per
|
Approaches, Quality Control and Project Evaluation, http://www.ceam.es/reaction/book01. htm (last access: 4 December 2015), 121–144, 2009.
Costantini, E., L’Abate, G., Faz Cano, A., Mermut, A., Arocena, J., and Ortiz Silla, R.: A Soil Arid-ity Index to assess desertification risk for Italy, Land degradation and rehabilitation: dryland ecosystems, in: Fourth International Conference on Land Degradation, Cartagena, Murcia, 5
Spain, 12–17 September 2004, 231–242, 2009a.
Costantini, E., Urbano, F., Aramini, G., Barbetti, R., Bellino, F., Bocci, M., Bonati, G., Fais, A., L’Abate, G., and Loj, G.: Rationale and methods for compiling an atlas of desertification in Italy, Land Degrad. Dev., 20, 261–276, 2009b.
De la Rosa, D. and Sobral, R.: Soil quality and methods for its assessment, in: Land Use and 10
Soil Resources, Springer, Heidelberg, Germany, 167–200, 2008.
Derbel, S., Cortina, J., and Chaieb, M.: Acacia saligna plantation impact on soil surface prop-erties and vascular plant species composition in central Tunisia, Arid Land Res. Manag., 23, 28–46, 2009.
Dickinson, N. M., Hartley, W., Uffindell, L. A., Plumb, A. N., Rawlinson, H., and Putwain, P.: 15
Robust biological descriptors of soil health for use in reclamation of brownfield land, Land Contamination and Reclamation, 13, 317–326, 2005.
Eswaran, H. and Reich, P.: Desertification: a global assessment and risks to sustainability, in: 16th World Congress of Soil Sciences: Summaries, 16th Congress 1998, Montpellier France, 20–26 August 1998.
20
Franzluebbers, A.: Water infiltration and soil structure related to organic matter and its stratifi-cation with depth, Soil Till. Res., 66, 197–205, 2002a.
Franzluebbers, A.: Soil organic matter stratification ratio as an indicator of soil quality, Soil Till. Res., 66, 95–106, 2002b.
Fuentes, D., Valdecantos, A., Llovet, J., Cortina, J., and Vallejo, V. R.: Fine-tuning of sewage 25
sludge application to promote the establishment ofPinus halepensis seedlings, Ecol. Eng., 36, 1213–1221, 2010.
Gaitán, J. J., Bran, D., Oliva, G., Ciari, G., Nakamatsu, V., Salomone, J., Ferrante, D., Buono, G., Massara, V., and Humano, G.: Evaluating the performance of multiple remote sensing indices to predict the spatial variability of ecosystem structure and functioning in Patagonian steppes, 30