ACPD
11, 14903–14932, 2011Fast sulfur dioxide measurements with
CCN spectra
D. C. Thornton et al.
Title Page
Abstract Introduction
Conclusions References
Tables Figures
◭ ◮
◭ ◮
Back Close
Full Screen / Esc
Printer-friendly Version Interactive Discussion
Discussion
P
a
per
|
Dis
cussion
P
a
per
|
Discussion
P
a
per
|
Discussio
n
P
a
per
|
Atmos. Chem. Phys. Discuss., 11, 14903–14932, 2011 www.atmos-chem-phys-discuss.net/11/14903/2011/ doi:10.5194/acpd-11-14903-2011
© Author(s) 2011. CC Attribution 3.0 License.
Atmospheric Chemistry and Physics Discussions
This discussion paper is/has been under review for the journal Atmospheric Chemistry and Physics (ACP). Please refer to the corresponding final paper in ACP if available.
Fast sulfur dioxide measurements
correlated with cloud concentration nuclei
spectra in the marine boundary layer
D. C. Thornton1, A. R. Bandy1, and J. G. Hudson2
1
Department of Chemistry, Drexel University, Philadelphia, PA, USA
2
Desert Research Institute, Nevada System of Higher Education, Reno, NV, USA
Received: 2 May 2011 – Accepted: 9 May 2011 – Published: 17 May 2011
Correspondence to: D. C. Thornton ([email protected])
ACPD
11, 14903–14932, 2011Fast sulfur dioxide measurements with
CCN spectra
D. C. Thornton et al.
Title Page
Abstract Introduction
Conclusions References
Tables Figures
◭ ◮
◭ ◮
Back Close
Full Screen / Esc
Printer-friendly Version Interactive Discussion
Discussion
P
a
per
|
Dis
cussion
P
a
per
|
Discussion
P
a
per
|
Discussio
n
P
a
per
|
Abstract
During the Rain in (shallow) Cumulus over the Ocean (RICO) project simultaneous measurements of high rate sulfur dioxide (SO2) measurements and cloud condensation
nuclei (CCN) spectra were made for the first time. During research flight 14 (14 January 2005) the convective boundary layer was impacted by precipitation and ship plumes in 5
midday but not in the late afternoon. Accumulation mode aerosols (0.14 to 0.2 µm diameter) were a factor of two greater in the latter period while CCN were 30 % to 65 % greater for aerosols that activate at supersaturations>0.1 %. Linear correlations of SO2 and CCN were found for SO2 concentrations ranging from 20 to 600
parts-per-trillion (pptv). The greatest sensitivities were for SO2 and CCN that activate at 10
supersaturations>0.1 % for both clean and polluted air. In a region affected by a cold pool event SO2was only linearly correlated with CCN at>0.2 % S.
1 Introduction
The Rain in (shallow) Cumulus over the Ocean (RICO) project was an intensive study of shallow cumulus clouds within the trade wind (TW) inversion (Rauber et al., 2007b). 15
The field program was designed so that continuous radar measurements to detect pre-cipitation were combined with intensive physical and chemical measurements obtained with several aircraft and a ship operating within the radar domain and primarily upwind of the radar site. A primary goal of RICO was to understand the conditions that exist at the onset of precipitation in the shallow cumulus clouds of the TW regime.
20
Several studies have considered factors that could be dominant in forming cloud drops during RICO: low level wind speeds and aerosol size distributions (Colon-Robles et al., 2006), cloud condensation nuclei (CCN) and updraft velocities (Hudson and Mishra, 2007); (Hudson et al., 2009), giant and ultragiant CCN (Arthur et al., 2010; Colon-Robles et al., 2006; Lowenstein et al., 2010; Reiche and Lasher-Trapp, 2010; 25
ACPD
11, 14903–14932, 2011Fast sulfur dioxide measurements with
CCN spectra
D. C. Thornton et al.
Title Page
Abstract Introduction
Conclusions References
Tables Figures
◭ ◮
◭ ◮
Back Close
Full Screen / Esc
Printer-friendly Version Interactive Discussion
Discussion
P
a
per
|
Dis
cussion
P
a
per
|
Discussion
P
a
per
|
Discussio
n
P
a
per
|
Gerber et al. (2008) point out these studies inferred the importance of subcloud aerosol measurements and near cloud base concentrations of droplets but neglect the pro-cesses in the upper portions of the clouds including entrainment of environmental air above the convective boundary layer (CBL).
This study presents a more detailed investigation of the subcloud aerosol distribu-5
tions and their relationship to sulfur dioxide (SO2). SO2 is a precursor to the formation
of sulfate aerosols that are considered important in forming and modifying aerosols that could become CCN as well as modifying the number concentrations and size dis-tributions of cloud droplets. The RICO project was the first time that CCN supersatu-ration spectra and high rate (25 Hz sampling), continuously calibrated, high sensitivity 10
SO2measurements were made simultaneously. In addition, SO2measurements were fast enough to estimate its flux to the surface by the eddy correlation technique. SO2
measurements within clouds were also obtained that can be evaluated with respect to droplet concentrations.
Research flight 14 (RF14, 14 January 2005) of the National Center for Atmospheric 15
Research (NCAR) C-130 was typical of many of the RICO C-130 flights with respect to the SO2 concentrations. Plumes of SO2 on the order of tens of km long were of-ten encountered during the first circular flight track in the CBL near the surface. The most likely sources of these plumes were ships, which were observed visually on oc-casions but more often not. While RICO was considered “clean” for aerosol concentra-20
tions compared to continental or near shore conditions, the SO2concentrations were
much higher than those encountered in the central Pacific CBL (Thornton et al., 1999); (Bandy et al., 1996).
The SO2plumes in the CBL during the early part of RF14 were remarkable in their
magnitude and the areal extent. Peak CBL SO2 concentrations reached 600 pptv and
25
concentrations >100 pptv were pervasive in the CBL. During flight legs at 800 and 1300 m a.s.l. devoted to in situ sampling of the shallow cumulus clouds within the TW inversion, numerous encounters of SO2>100 pptv within the clouds were observed.
ACPD
11, 14903–14932, 2011Fast sulfur dioxide measurements with
CCN spectra
D. C. Thornton et al.
Title Page
Abstract Introduction
Conclusions References
Tables Figures
◭ ◮
◭ ◮
Back Close
Full Screen / Esc
Printer-friendly Version Interactive Discussion
Discussion
P
a
per
|
Dis
cussion
P
a
per
|
Discussion
P
a
per
|
Discussio
n
P
a
per
|
inversion, were<35 pptv except for a few short encounters with aircraft exhaust. The descriptions of the SO2in clouds are the subject of another paper.
2 Measurements
The suite of chemical measurements for RICO was limited in that the program was devoted to understanding the initiation of precipitation in the warm shallow cumulus 5
clouds. The C-130 chemistry data set, in addition to SO2, included dimethyl sulfide
(DMS), ozone (O3), water vapor, hydrogen peroxide (H2O2), and methyl hydroperoxide (CH3O2H). The sampling rates for all these gases were 25/s except for the
perox-ides although detector noise limited DMS data to 1/s. The C-130 physics data set included cloud condensation nucleus (CCN) counters from Desert Research Institute 10
(DRI) (Hudson and Mishra, 2007; Hudson et al., 2009), the standard set of NCAR atmo-spheric state measurements, condensation nuclei (CN) counters, probes for aerosols (PCASP-200), cloud droplets (FSSP-100), and hydrometeors (260-X, 2DC, 2DP). The full suite of the instruments and measurements employed has been described in a supplement to the RICO overview paper (Rauber et al., 2007a).
15
The SO2measurements during RICO were obtained using an atmospheric pressure
ionization mass spectrometer (APIMS) with continuous calibration using isotopically labeled sulfur dioxide (34SO2) added to the sampled air (Thornton et al., 2002). The
power of this technique lies not only in the signal calibration but in the continuous indication of the performance of the APIMS in terms of sensitivity and response times 20
under all operating conditions (Bandy et al., 1993). A blank determination was obtained using about 50 cm of 6 mm copper tubing, which removed 500 to 800 pptv SO2 with
a 1/e time of 0.58 s. Sampling at 25 Hz allows determination of SO2 on a physical scale of 10 m. This is a great advantage for detecting SO2at the transitions near the
cloud edges as well as variations within clouds related to the physical dynamics of the 25
ACPD
11, 14903–14932, 2011Fast sulfur dioxide measurements with
CCN spectra
D. C. Thornton et al.
Title Page
Abstract Introduction
Conclusions References
Tables Figures
◭ ◮
◭ ◮
Back Close
Full Screen / Esc
Printer-friendly Version Interactive Discussion
Discussion
P
a
per
|
Dis
cussion
P
a
per
|
Discussion
P
a
per
|
Discussio
n
P
a
per
|
The typical C-130 flight patterns were divided between circular tracks in the CBL (Ta-ble 1) and the free troposphere (FT) regions and directed cloud sampling as frequently as possible. An initial 30 min circular track (FT1) was flown above the TW inversion in the region of interest. During this segment dropsondes were released periodically around the track to give a preview of the TW layer meteorological conditions. After 5
descent to about 90 m above asl, a 30 min circular track (SU1, see Table 1) was flown followed by a sub cloud base circle (SC) about 450 m a.s.l. The starting locations of the CBL circles were approximately collocated and flown with opposite rotations. All the circles were advected with the mean wind with respect to the starting location.
Following the CBL circles, 3 to 4 h were devoted to sampling in and around clouds 10
within the TW inversion. Altitudes for cloud sampling were determined by the depth of clouds for that flight with an effort to provide a representative sampling of different levels of cloud development. The remaining flight time was spent by repeating the sub-cloud base circle (SC2), a surface circle (SU2), and ascent to a final circle in the free troposphere (FT2) with dropsondes deployed as before.
15
3 Observations
Before an in-depth consideration of SO2 in clouds, the chemical and physical data
below cloud base were examined in the context of a well mixed CBL punctuated with the effects of precipitation. The availability of high rate data for SO
2in conjunction with
the aerosols, ozone, and thermodynamic parameters made it possible to verify that the 20
chemical scalar quantities were responding similarly in the well mixed CBL.
With the RICO domain in the TW regime to the north and east of the Windward Islands, advection of air parcels relatively free of anthropogenic impacts from long range was expected. For RF14 the wind direction near the surface was about 075 degrees at 12 to 16 m s−1 throughout the flight except near the beginning and end 25
ACPD
11, 14903–14932, 2011Fast sulfur dioxide measurements with
CCN spectra
D. C. Thornton et al.
Title Page
Abstract Introduction
Conclusions References
Tables Figures
◭ ◮
◭ ◮
Back Close
Full Screen / Esc
Printer-friendly Version Interactive Discussion
Discussion
P
a
per
|
Dis
cussion
P
a
per
|
Discussion
P
a
per
|
Discussio
n
P
a
per
|
∼13 m s−1. At 90 m the air temperature was 25.1◦C. Ocean surface temperatures were 27◦C, except for an area near the beginning of SU1 where the surface temperature was 0.5◦C higher.
The mean O3 was 26.5±1 ppbv, except for the first half of SU1 where O3 was
pe-riodically<25 ppbv. Positive deviations of O3from its mean were associated with the 5
largest SO2 concentrations. This indicated that sufficient time had elapsed from the combustion source that produced the SO2for the O3to recover from destruction by the
large amounts of nitric oxide (NO) that would have been generated in the source. Pro-duction of O3then proceeds through nitrogen oxides – hydrocarbon photochemistry.
3.1 SO2 10
In the free troposphere mean SO2was 25 pptv at the beginning of the flight (FT1) and
21 pptv near the end of the flight (FT2). These SO2means were statistically significant
at the 95 % confidence interval. The first indication of high SO2 concentrations in the CBL occurred on the descent in clear air to circle SU1 (Fig. 1). Mixing in the CBL brought SO2>100 pptv as high as 500 m a.s.l. The area bounded by 61.3
◦
W 17.8◦N 15
and 61.8◦W 18.05◦N was impacted by ship plumes based on measurements 2.5 min before SU1 started through SC1 including the period between the 2 circles. The peak SO2concentrations near 450 s of SU1was the maximum observed although peaks over
300 pptv were observed before SU1 started and between SU1 and SC1. Because of the winds speed of∼15 m s−1and the time between the encounters none of the peaks 20
were sampled more than once. By the time the peak in SC2 was intercepted the peak in SU1 was about 40 km downwind.
Although SO2 concentrations reached 600 pptv in the southeastern quadrant of
SU1, the median SO2 concentrations were 45 and 37 pptv for SU1 and SC1,
respec-tively. These concentrations are more typical of the Northern Hemisphere marine CBL 25
ACPD
11, 14903–14932, 2011Fast sulfur dioxide measurements with
CCN spectra
D. C. Thornton et al.
Title Page
Abstract Introduction
Conclusions References
Tables Figures
◭ ◮
◭ ◮
Back Close
Full Screen / Esc
Printer-friendly Version Interactive Discussion
Discussion
P
a
per
|
Dis
cussion
P
a
per
|
Discussion
P
a
per
|
Discussio
n
P
a
per
|
precipitation during that part of the track. The lowest SO2concentrations (≤30 pptv) at
the end of the SU1 and SC1 circles were associated with cold pool events. The SO2
concentrations at altitudes within the TW inversion, but above the cloud base, were <35 pptv in the absence of convected polluted CBL air and aircraft exhaust.
During the late afternoon CBL circles, mean SO2concentrations were 26 and 21 pptv
5
for SU2 and SC2, respectively, which are statistically significant at the 95 % confidence interval. These mean SO2 concentrations are typical of remote marine CBL with little contributions from anthropogenic sources (Thornton et al., 1999). One period during the SU2 circle (Figs. 2, 3, and 5 between 1200 to 1500 s) SO2 covaried with CN and
CCN. In this instance it appeared that air from a cold pool event reached 90 m a.s.l. as 10
indicated by the anticorrelation of SO2, CN, CCN, and O3 with fast water vapor and equivalent potential temperature (Θe).
3.2 CN
A cursory inspection of the data showed similar trends in CN (CONCN variable from the C-130) and SO2 concentrations around the circles. The time lag between these 15
two measurements was determined to be <1 s by examining the covariance of the measurements. The correlations of CN and SO2were effective in indicating the
pollu-tion plumes both in time and intensity over concentrapollu-tions ranges of 1 to 2 orders of magnitude.
While SO2measurements could be made in clouds and in precipitation events, CN
20
data were not valid in clouds and in precipitation because of the fracturing of droplets in the inlet. Using SO2concentrations to indicate the pollution plumes and the responses
of the NCAR FSSP-100 and the particle volume measurement (PVM) probe (Gerber Scientific) to indicate the presence of drizzle or rain, the CN data were parsed into several segments for the earlier CBL circles. During the CBL circles SU2 and SC2, 25
ACPD
11, 14903–14932, 2011Fast sulfur dioxide measurements with
CCN spectra
D. C. Thornton et al.
Title Page
Abstract Introduction
Conclusions References
Tables Figures
◭ ◮
◭ ◮
Back Close
Full Screen / Esc
Printer-friendly Version Interactive Discussion
Discussion
P
a
per
|
Dis
cussion
P
a
per
|
Discussion
P
a
per
|
Discussio
n
P
a
per
|
by pollution or precipitation were significantly greater during the SU2 and SC2 circles than in the SU1 and SC1 circles (Table 2).
What is remarkable about the CN concentrations (excluding the pollution periods) are the much higher concentrations in the ending set of circles. This is in contrast to the decrease in SO2concentrations for the corresponding periods.
5
3.3 PCASP
The PCASP-200 probe was set by NCAR Research Aviation Facility to provide number concentrations in the size range 0.14 to 2.45 µm (size bins <0.14 µm were not used due to noise interference). This probe was also impacted by droplet fracturing in cloud and precipitation. The time series of the PCASP number concentrations (CONCP is 10
the 1 s integration over the size range for valid data) also had a variation around the afternoon circles similar to CN. There was no apparent response of the PCASP to the pollution segments indicated by SO2. This implies that the elevated CN encountered
in those plumes were<0.14 µm in diameter.
The period 500 to 1200 s in each of the SU1 and SC1 circles was free of both pre-15
cipitation and SO2 plumes. The averages of the PCASP-200 number concentrations
for this period clearly show that the mean CBL concentrations were nearly twice as great in the ending circles compared to the initial circles (Table 3) over approximately the same area 4 to 5 h later.
Examining the size distribution of the PCASP probe indicates that the increase in 20
the integrated number concentrations for the later CBL circles were dominated by in-creases in the sizes<0.5 µm diameter (Fig. 4). Number concentrations for sizes of 0.14 to 0.2 µm (leftmost 5 bins in the spectra of Fig. 4) were twice as great in the ending CBL circles than in the earlier ones. Concentration increases of 50 to 75 % in the PCASP spectra occurred for the larger sizes in the accumulation mode (0.20 to 0.3 µm). For 25
ACPD
11, 14903–14932, 2011Fast sulfur dioxide measurements with
CCN spectra
D. C. Thornton et al.
Title Page
Abstract Introduction
Conclusions References
Tables Figures
◭ ◮
◭ ◮
Back Close
Full Screen / Esc
Printer-friendly Version Interactive Discussion
Discussion
P
a
per
|
Dis
cussion
P
a
per
|
Discussion
P
a
per
|
Discussio
n
P
a
per
|
3.4 CCN
The CCN data (Fig. 5) were filtered in the same way as the CN because of the impacts of precipitation on the inlet. The CCN sampling and measurement response lagged the SO2 and CN measurements by 20 to 22 s (based on covariance tests), which is
accounted for in all comparisons. The CCN lag is mostly due to the time needed to 5
activate the particles to droplets of detectable sizes within the cloud chamber but also for the air to travel to the instrument.
When the CCN data are parsed to remove the impacts of the SO2 ship plumes, the
trend for increased CCN from initial to ending CBL circles is clear for supersaturations (S)>0.1 % (Fig. 6). Higher CCN concentrations later in the day were consistent with 10
the other aerosol data in this comparison between midday and late afternoon. The pri-mary differences in these supersaturation spectra (Fig. 7) occurred between 0.2 % and 0.6 % S. The contributions to the increase of CCN for S>0.6 % were minimal. For CCN that activate at<0.1 % S both SU2 and SC2 had number concentrations 5 % to 30 % lower than the corresponding circles SU1 and SC1. This is remarkable considering 15
the wind speeds of 12 to 15 m s−1during the CBL circles. Because the lowest S have the largest diameters, it would appear that salt aerosols may not have had a significant contributed to the largest CCN concentrations.
The increases in CCN concentrations at 0.2 % to 0.6 % S during SU2 and SC2 circles are consistent with the PCASP probe spectra, which had concentrations twice as great 20
as the earlier circles for the sizes 0.14 to 0.185 µm (Fig. 4). If the CCN are primarily ammonium sulfate, the increase for CCN with 0.2 to 0.6 % S would represent particles with diameters 0.085 to 0.04 µm based on the calibration of the CCN spectrometer.
For a portion of the SU1 circle most impacted by ship exhaust, SO2ranged from 50
to 600 pptv with concomitant changes in CN and CCN. For the period of 400 to 500s 25
into the circle, SO2 and CCN were linearly correlated at all S (Fig. 8 and Table 4),
ACPD
11, 14903–14932, 2011Fast sulfur dioxide measurements with
CCN spectra
D. C. Thornton et al.
Title Page
Abstract Introduction
Conclusions References
Tables Figures
◭ ◮
◭ ◮
Back Close
Full Screen / Esc
Printer-friendly Version Interactive Discussion
Discussion
P
a
per
|
Dis
cussion
P
a
per
|
Discussion
P
a
per
|
Discussio
n
P
a
per
|
During the SU2 circle (1100 to 1500 s, Fig. 2) SO2, CN, and CCN displayed a syn-chronous variation in their concentrations. Although the variation in SO2 was only
15 pptv about a mean of∼30 pptv, there was enough of a perturbation to assess the correlation of these three constituents. For CCN activated at 1.5 % S there was a lin-ear correlation between SO2and CCN (Fig. 8; Table 4). The linear correlation between
5
SO2 and CCN activated at S≤0.1 % had near zero slope (Fig. 9; Table 4). The linear
correlations of CN and CCN were similar to those of SO2and CCN.
4 Discussion
The decrease in SO2 concentrations and the increase in number density of aerosols
over a wide size range between the earlier and later CBL circles lead to the question 10
of what impact SO2 may have had on these aerosol number and size distributions.
Several scenarios could explain these CBL observations for SO2, CCN, CN, and the
impacts of intermittent precipitation events. A well defined answer to this question cannot be obtained from RICO because the flight program was not designed for a Lagrangian process study but for a detailed study of clouds and precipitation using 15
in situ measurements and remote sensing of the region defined by the radar domain. Consequently, the measurement space was confined to approximately the same region for each flight. Although each circle in the CBL was drifted with the wind, the starting points were approximately colocated to keep the aircraft within the radar domain for the duration of the circle. While this strategy effectively made this experiment an Eulerian 20
one, the 4 to 5 h time step between the initial and ending CBL circles allows some inferences to be made about the CBL and evolution of aerosols as the day progressed. Given the long upwind fetch in a trade wind region of relative consistency, this may be a good assumption with regard to the chemistry and aerosol physics.
One advantage of the RICO project was that the S-band radar was running nearly 25
ACPD
11, 14903–14932, 2011Fast sulfur dioxide measurements with
CCN spectra
D. C. Thornton et al.
Title Page
Abstract Introduction
Conclusions References
Tables Figures
◭ ◮
◭ ◮
Back Close
Full Screen / Esc
Printer-friendly Version Interactive Discussion
Discussion
P
a
per
|
Dis
cussion
P
a
per
|
Discussion
P
a
per
|
Discussio
n
P
a
per
|
the hours prior to and during the aircraft flight. To estimate the influence that precipi-tation may have had on SO2and aerosols, every point along the CBL flight tracks was advected back in time using theuandv component winds from each second along the track to the time of the 0.5 degree radar scan. A composite of the time series of the advected tracks superimposed on the radar plots can then be viewed as movie or slide 5
show to follow the development of the precipitation impacts.
Inspection of the time series of the back advected aircraft tracks for the SU1 and SC1 showed that the beginning and ending parts of these circles were affected by precipitation for nearly the entire time (1 to 1.5 h) the air parcels were within the radar range. The central portions of these two CBL circles were free of precipitation for the 10
entire time the parcels were within the radar range. It was these central portions of the CBL that had higher CN and CCN concentrations (500 to 1200s into the circles in Fig. 3 top and Fig. 5a,b). These central portions of the circles give upper bounds to the aerosol concentrations while the beginning and end portions yield an estimate of the precipitation effects. However, midday mean SO2 concentration in these central 15
portions was 40 pptv compared to a mean of 27 pptv in the late afternoon. Because of the high water solubility of SO2, its concentration in the midday period would be expected to have been reduced by precipitation in during SU1 and SC1. The generally higher SO2concentrations for the SU1 and SC1 periods likely reflected the dispersion
of the ship plumes in the CBL despite any loss to precipitation. 20
The radar plots and the back advected tracks for the late afternoon did not indicate any precipitation for the SU2 and SC2 circles although the cloud cover was similar to the earlier CBL circles. The higher concentrations of CN, CCN activated at 0.2 to 0.4 % S, and particles sized by the PCASP during SU2 and SC2 may better represent the conditions in the absence of precipitation than the rain free portions of the SU1 and 25
ACPD
11, 14903–14932, 2011Fast sulfur dioxide measurements with
CCN spectra
D. C. Thornton et al.
Title Page
Abstract Introduction
Conclusions References
Tables Figures
◭ ◮
◭ ◮
Back Close
Full Screen / Esc
Printer-friendly Version Interactive Discussion
Discussion
P
a
per
|
Dis
cussion
P
a
per
|
Discussion
P
a
per
|
Discussio
n
P
a
per
|
26 pptv for SU2. With a production efficiency of SO
2from DMS of∼0.7 (Bandy et al.,
1996), the increase in SO2could have been 15 pptv assuming upwind sources of DMS
and the CBL conditions were similar throughout the time period.
The SO2fluxes estimated by eddy correlation for the first 500 s of the SU1 and SU2 circles were−0.61 and−0.36 pptv m s−1, respectively. For the precipitation free central
5
portions (750 to 1250 s) of the SU1 and SU2 circles, the SO2 fluxes were−0.34 and −0.24 pptv m s−1, respectively. The similarity in the SO2fluxes indicates that the loss to
the surface may have been approximately equal throughout the day. For a surface flux of−0.3 pptv m s−1and a 600 m CBL depth, SO2loss to the surface would have∼9 pptv
for the 5 hr time step from SU1 to SU2. 10
The SC1 circle had an upward SO2 flux of +0.51 pptv m s−1 for the 1000 to 1250 s portion of the circle, although the first 500 s of the circle (in the region affected by precipitation earlier) had a downward SO2flux of−0.36 pptv m s
−1
. For the SC2 circle the SO2fluxes were+0.07 and+0.21 pptv m s
−1
. While the periods suitable for deter-mining SO2 fluxes were limited on RF14 by a number of stochastic events, the SO2 15
fluxes do provide some indication of fluxes of SO2and aerosols from the CBL during
this flight.
Convection to the cloud layer was probably the primary loss mechanism of SO2 in the CBL during SU1 and SC1. Numerous cloud penetrations during the 800 m and 1300 m flight legs had SO2 within clouds which were over 100 pptv between 800 and
20
1300 m a.s.l. SO2was≤35 pptv in cloud free air above the CBL when brief encounters
with aircraft exhausts were excluded. With the small fluxes of SO2 to the surface and
the estimated small homogenous chemical losses, the other major loss route would have been heterogeneous processes involving aerosols.
The CCN concentrations activated at ≤0.1 % S were similar throughout the day for 25
ACPD
11, 14903–14932, 2011Fast sulfur dioxide measurements with
CCN spectra
D. C. Thornton et al.
Title Page
Abstract Introduction
Conclusions References
Tables Figures
◭ ◮
◭ ◮
Back Close
Full Screen / Esc
Printer-friendly Version Interactive Discussion
Discussion
P
a
per
|
Dis
cussion
P
a
per
|
Discussion
P
a
per
|
Discussio
n
P
a
per
|
is rapid, growth to Aitken nuclei or larger sizes takes some hours. The concentration increases in CCN activating for S>0.1 % later in the day may be due to the∼5 h time
interval between the low altitude measurements. Given the linear correlation between SO2 and CCN activating at >0.1 % S and the absence of correlation SO2 and CCN
with≤0.1 % S during SU2 circle (Fig. 9), those increases in CCN activating at 0.2 to
5
0.6 % S could be associated with SO2 conversion to sulfate or SO2uptake by existing
small CCN or by pre-CCN aerosols which were activated by reaction with SO2. If larger
CCN are primarily sea salt and uncorrelated to SO2 while smaller CCN are primarily sulfates derived from SO2, this would imply that the sulfates formed or added to the
smallest CCN would impact cloud formation if the supersaturations in the clouds were 10
much greater than 0.1 % S (Hudson et al., 2010).
The large increase in number concentration, as well as mass, in the accumulation mode<0.4 µm indicated by the PCASP spectra. It is unlikely that this large increase was due to any homogeneous or heterogeneous processes in the CBL within the∼5 h
time between SU1 and SU2. Most likely heterogeneous processes over a number of 15
days would have produced this result. Precipitation averaged over the radar domain during RICO was typically<10 % with an estimate of ∼15 % for RF14 (Rauber et al.,
2007b; Snodgrass et al., 2009).
In the absence of precipitation, reprocessing of evaporated cloud drops and aerosols followed by entrainment into the CBL from the cloud layer maybe the source of the 20
increase of the accumulation mode aerosols (Lasher-Trapp et al., 2005). An example of this may be seen in the period of 1100 to 1600 s of SU2 where there was a synchronous variation of SO2, CN, and CCN (Figs. 2, 3, 5). Based onΘethis period appeared to be
the result of a cold pool event reaching as low as 90 m a.s.l. This is further supported by increases in O3 to concentrations typical of the 800 and 1100 m flight legs. Ozone
25
covaried with SO2, CN, and CCN although with a lag time of unknown origin. Because
ACPD
11, 14903–14932, 2011Fast sulfur dioxide measurements with
CCN spectra
D. C. Thornton et al.
Title Page
Abstract Introduction
Conclusions References
Tables Figures
◭ ◮
◭ ◮
Back Close
Full Screen / Esc
Printer-friendly Version Interactive Discussion
Discussion
P
a
per
|
Dis
cussion
P
a
per
|
Discussion
P
a
per
|
Discussio
n
P
a
per
|
An alternative scenario could be that the SU1 and SC1 concentrations of CCN with 0.2 to 0.4 % S were reduced by convection into the clouds during the early morning and midday. Hudson et al. (2009) found that cloud drop concentrations were well correlated to CCN activated at 1 % S for the surface flight levels. This S is probably similar to S of most RICO cumulus clouds because Hudson et al. (2010) found S values of nearly 5
1 % in stratus clouds with similar low droplet concentrations to RICO. Cumulus clouds have higher updrafts, which should produce higher S. Taking the effective S (S
eff) as number of CCN that activate at 1 % S equal the number of cloud drops (Nc) near cloud
base, the mean Sefffor the surface circles during RICO was 0.5 % with a range of 0.2– 1.5 % S. This is similar to the range found for stratocumulus cloud decks with mean 10
CCN that activate at 1 % S (Hudson et al., 2010).
5 Conclusions
During RICO RF14 there was dichotomy of conditions below cloud base between the midday period and the late afternoon period. The midday CBL had concentrations of SO2>100 pptv from ship exhausts in a region with significant precipitation. Upwind
15
of the precipitation region, there were∼50 % lower CCN number density at S>0.1 %,
∼50 % lower number density of aerosols with diameters of 0.14 to 0.2 µm compared to the late afternoon for the same region. In the ship exhaust plumes, SO2
concentra-tions>100 pptv were linearly correlated with CCN over the entire range of measured supersaturations, although the magnitudes of the slopes were lower for CCN activated 20
at <0.2 % S compared to higher S. The lower concentrations of CCN and aerosols
≤0.2 µm may have been the result of cloud processing without precipitation despite the
high SO2concentrations that could have generated considerable sulfate aerosols. The lower concentrations of CCN that activate at 0.2 to 0.4 % S observed during the midday period could be associated with cloud formation and precipitation, but likely represent 25
ACPD
11, 14903–14932, 2011Fast sulfur dioxide measurements with
CCN spectra
D. C. Thornton et al.
Title Page
Abstract Introduction
Conclusions References
Tables Figures
◭ ◮
◭ ◮
Back Close
Full Screen / Esc
Printer-friendly Version Interactive Discussion
Discussion
P
a
per
|
Dis
cussion
P
a
per
|
Discussion
P
a
per
|
Discussio
n
P
a
per
|
In the late afternoon when the mean CBL SO2 was 26 pptv (standard deviation
±6 pptv), SO2 was linearly correlated with CCN that activate at supersaturations
>0.2 %, but there was no correlation with CCN that activate <0.2 % S. A cold pool event appeared to have a significant role in bringing into the CBL aerosols that were processed in clouds. The∼50 % greater number densities of CCN that activate with 5
>0.2 % S during the late afternoon period may have contributed to formation of clouds in which precipitation was not favored due to the higher number density of CCN. Models using the late afternoon condition as input may answer this question.
Given the conditions that were observed during the midday, the question remains: did the measured CCN spectra during the midday represent the end result of cloud for-10
mation and precipitation and did the late afternoon measured CCN spectra represent the CBL conditions with cloud formation but without precipitation? Since precipitation was frequently observed early in the day during RICO and that SO2from ship plumes
was frequently observed in the first CBL circles, the impact of SO2on cloud formation and precipitation remains poorly understood and deserves further study from measure-15
ments and modeling.
Acknowledgements. Support from the National Science Foundation under grants ATM-0342138, ATM-0627227, ATM-0627227, and ATM-0342618 is gratefully acknowledged. Na-tional Center for Atmospheric Research (NCAR) is sponsored by the NaNa-tional Science Foun-dation. We thank the NCAR Research Aviation Facility for their assistance throughout the 20
C-130 operation phase of RICO. Data from the RICO project archive at NCAR Earth Observing Laboratory archive for data obtained on the C-130 and the Radar Image Archive for the radar images for RF14 are gratefully acknowledged.
References
Arthur, D. K., Lasher-Trapp, S., Abdel-Haleem, A., Klosterman, N., and Ebert, D. S.: 25
A new three-dimensional visualization system for combining aircraft and radar data
and its application to RICO observations, J. Atmos. Oceanic Tech., 27, 811–828,
ACPD
11, 14903–14932, 2011Fast sulfur dioxide measurements with
CCN spectra
D. C. Thornton et al.
Title Page
Abstract Introduction
Conclusions References
Tables Figures
◭ ◮
◭ ◮
Back Close
Full Screen / Esc
Printer-friendly Version Interactive Discussion
Discussion
P
a
per
|
Dis
cussion
P
a
per
|
Discussion
P
a
per
|
Discussio
n
P
a
per
|
Bandy, A. R., Thornton, D. C., and Driedger, A. R.: Airborne measurements of sulfur dioxide, dimethyl sulfide, carbon disulfide, and carbonyl sulfide by isotope dilution gas chromatogra-phy mass spectrometry, J. Geochromatogra-phys. Res.-Atmos., 98, 23423–23433, 1993.
Bandy, A. R., Thornton, D. C., Blomquist, B. W., Chen, S., Wade, T. P., Ianni, J. C., Mitchell, G. M., and Nadler, W.: Chemistry of dimethyl sulfide in the equatorial Pacific atmosphere, 5
Geophys. Res. Lett., 23, 741–744, 1996.
Colon-Robles, M., Rauber, R. M., and Jensen, J. B.: Influence of low-level wind speed on droplet spectra near cloud base in trade wind cumulus, Geophys. Res. Lett., 33, L20814, doi:10.1029/2006GL027487, 2006.
Davis, D., G., C., Bandy, A., Thornton, D., Eisele, F., Mauldin, L., Tanner, D., Lenschow, D., 10
Fuelberg, H., Huebert, B., Heath, J., Clarke, A., and Blake, D.: Dimethyl sulfide oxidation in the equatorial Pacific: comparison of model simulations with field observations for DMS,
SO2, H2SO4(g), MSA(g), MS and NSS, J. Geophys. Res.-Atmos., 104, 5765–5784, 1999.
Gerber, H. E., Frick, G. M., Jensen, J. B., and Hudson, J. G.: Entrainment, mixing, and micro-physics in trade-wind cumulus, J. Meteorol. Soc. Jpn., 86, 87–106, 2008.
15
Hudson, J. G. and Mishra, S.: Relationships between CCN and cloud microphysics variations in clean maritime air, Geophys. Res. Lett., 34, L16804, doi:10.1029/2007GL030044, 2007. Hudson, J. G., Noble, S., Jha, V., and Mishra, S.: Correlations of small cumuli droplet and
drizzle drop concentrations with cloud condensation nuclei concentrations, J. Geophys. Res.-Atmos., 114, D05201, doi:10.1029/2008JD010581, 2009.
20
Hudson, J. G., Noble, S., and Jha, V.: Stratus cloud supersaturations, Geophys. Res. Lett., 37, L21813,doi:10.1029/2010gl045197, 2010.
Hudson, J. G., Jha, V., and Noble, S.: Drizzle correlations with giant nuclei, Geophys. Res. Lett., 38, L05808 doi:10.1029/2010gl046207, 2011.
Lasher-Trapp, S. G., Cooper, W. A., and Blyth, A. M.: Broadening of droplet size distributions 25
from entrainment and mixing in a cumulus cloud, Q. J. Roy. Meteor. Soc., 131, 195–220, doi:10.1256/qj.03.199, 2005.
Lowenstein, J. H., Blyth, A. M., and Lawson, R. P.: Early evolution of the largest-sized droplets in maritime cumulus clouds, Q. J. Roy. Meteor. Soc., 136, 708–717, doi:10.1002/qj.597, 2010.
30
ACPD
11, 14903–14932, 2011Fast sulfur dioxide measurements with
CCN spectra
D. C. Thornton et al.
Title Page
Abstract Introduction
Conclusions References
Tables Figures
◭ ◮
◭ ◮
Back Close
Full Screen / Esc
Printer-friendly Version Interactive Discussion
Discussion
P
a
per
|
Dis
cussion
P
a
per
|
Discussion
P
a
per
|
Discussio
n
P
a
per
|
Cotton, W. R., Di Girolamo, L. D., Geerts, B., Gerber, H., Goke, S., Gomes, L., Heikes, B. G., Hudson, J. G., Kollias, P., Lawson, 5 R. P., Krueger, S. K., Lenschow, D. H., Nuijens, L., OSullivan, D. W., Rilling, R. A., Rogers, D. C., Siebesma, A. P., Snodgrass, E., Stith, J. L., Thornton, D. C., Tucker, S., Twohy, C. H., and Zuidema, P: Electronic supplement to Rain in (shallow) Cumulus over the Ocean–The RICO campaign, Bull. Am. Meteorol. Soc., 88, 5
S12–S18, 2007a.
Rauber, R. M., Stevens, B., Ochs, H. T., Knight, C., Albrecht, B. A., Blyth, A. M., Fairall, C. W., Jensen, J. B., Lasher-Trapp, S. G., Mayol-Bracero, O. L., Vali, G., Anderson, J. R., Baker, B. A., Bandy, A. R., Burnet, E., Brenguier, J. L., Brewer, W. A., Brown, P. R. A., Chuang, P., Cotton, W. R., Girolamo, L. D., Geerts, B., Gerber, H., Goke, S., Gomes, L., Heikes, B. 10
G., Hudson, J. G., Kollias, P., Lawson, R. P., Krueger, S. K., Lenschow, D. H., Nuijens, L., O’Sullivan, D. W., Rilling, R. A., Rogers, D. C., Siebesma, A. P., Snodgrass, E., Stith, J. L., Thornton, D. C., Tucker, S., Twohy, C. H., and Zuidema, P.: Rain in shallow cumulus over the ocean – The RICO campaign, Bull. Am. Meteorol. Soc., 88, 1912–1928, 2007b.
Reiche, C. H. and Lasher-Trapp, S.: The minor importance of giant aerosol to precipitation 15
development within small trade wind cumuli observed during RICO, Atmos. Res., 95, 386– 399, 2010.
Snodgrass, E. R., Di Girolamo, L., and Rauber, R. M.: Precipitation characteristics of trade wind clouds during RICO derived from radar, satellite, and aircraft measurements, J. Appl. Meteorol. Climatol., 48, 464–483, 2009.
20
Thornton, D. C., Bandy, A. R., Beltz, N., Driedger, A. R., and Ferek, R.: Advection of sulfur dioxide over the western Atlantic Ocean during CITE-3, J. Geophys. Res.-Atmos., 98, 23459– 23467, 1993.
Thornton, D., Bandy, A., Blomquist, B., Driedger, A., and Wade, T.: Sulfur dioxide distribution over the Pacific Ocean 1991–1996, J. Geophys. Res.-Atmos., 104, 5845–5854, 1999. 25
Thornton, D., Bandy, A., Tu, F., Blomquist, B., Mitchell, G., Nadler, W., and Lenschow, D.: Fast airborne sulfur dioxide measurements by atmospheric pressure ionization mass spectrome-try (APIMS), J. Geophys. Res.-Atmos., 107, 4632 doi:4610.1029/2002JD002289, 2002. Tu, F. H., Thornton, D. C., Bandy, A. R., Carmichael, G. R., Tang, Y., Thornhill, K. L., Sachse, G.
W., and Blake, D. R.: Long-range transport of sulfur dioxide in the central Pacific, J. Geophys. 30
ACPD
11, 14903–14932, 2011Fast sulfur dioxide measurements with
CCN spectra
D. C. Thornton et al.
Title Page
Abstract Introduction
Conclusions References
Tables Figures
◭ ◮
◭ ◮
Back Close
Full Screen / Esc
Printer-friendly Version Interactive Discussion
Discussion
P
a
per
|
Dis
cussion
P
a
per
|
Discussion
P
a
per
|
Discussio
n
P
a
per
|
Table 1.Start times of CBL circles for RICO RF14.
SU1 Initial surface circle at 90 m 16:12:19 UTC∗
SC1 Initial sub-cloud circle at 450 m 16:49:04 UTC
SU2 Final surface circle at 90 m 21:46:39 UTC
SC2 Final sub-cloud circle at 450 m 21:09:49 UTC
∗
ACPD
11, 14903–14932, 2011Fast sulfur dioxide measurements with
CCN spectra
D. C. Thornton et al.
Title Page
Abstract Introduction
Conclusions References
Tables Figures
◭ ◮
◭ ◮
Back Close
Full Screen / Esc
Printer-friendly Version Interactive Discussion
Discussion
P
a
per
|
Dis
cussion
P
a
per
|
Discussion
P
a
per
|
Discussio
n
P
a
per
|
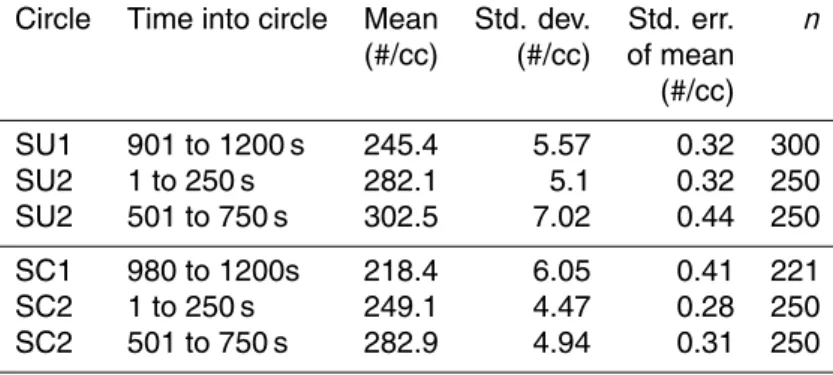
Table 2. NCAR CN number concentrations for the CBL circles of RICO RF14. Differences in
means between initial circles and later circles were significant at the 95 % confidence interval.
Circle Time into circle Mean Std. dev. Std. err. n
(#/cc) (#/cc) of mean
(#/cc)
SU1 901 to 1200 s 245.4 5.57 0.32 300
SU2 1 to 250 s 282.1 5.1 0.32 250
SU2 501 to 750 s 302.5 7.02 0.44 250
SC1 980 to 1200s 218.4 6.05 0.41 221
SC2 1 to 250 s 249.1 4.47 0.28 250
ACPD
11, 14903–14932, 2011Fast sulfur dioxide measurements with
CCN spectra
D. C. Thornton et al.
Title Page
Abstract Introduction
Conclusions References
Tables Figures
◭ ◮
◭ ◮
Back Close
Full Screen / Esc
Printer-friendly Version Interactive Discussion
Discussion
P
a
per
|
Dis
cussion
P
a
per
|
Discussion
P
a
per
|
Discussio
n
P
a
per
|
Table 3. Statistics for the PCASP-200 number concentrations for sizes 0.14 to 2.75 µm
inte-grated for 1 s for the precipitation free period 500 to 1200 s (n=701) into the circles.
Circle Mean Std. dev. Std. error
(#/cc) (#/cc) of mean
(#/cc)
SU1 35.4 7.11 0.27
SU2 69.1 10.5 0.40
SC1 37.5 6.79 0.26
ACPD
11, 14903–14932, 2011Fast sulfur dioxide measurements with
CCN spectra
D. C. Thornton et al.
Title Page
Abstract Introduction
Conclusions References
Tables Figures
◭ ◮
◭ ◮
Back Close
Full Screen / Esc
Printer-friendly Version Interactive Discussion
Discussion
P
a
per
|
Dis
cussion
P
a
per
|
Discussion
P
a
per
|
Discussio
n
P
a
per
|
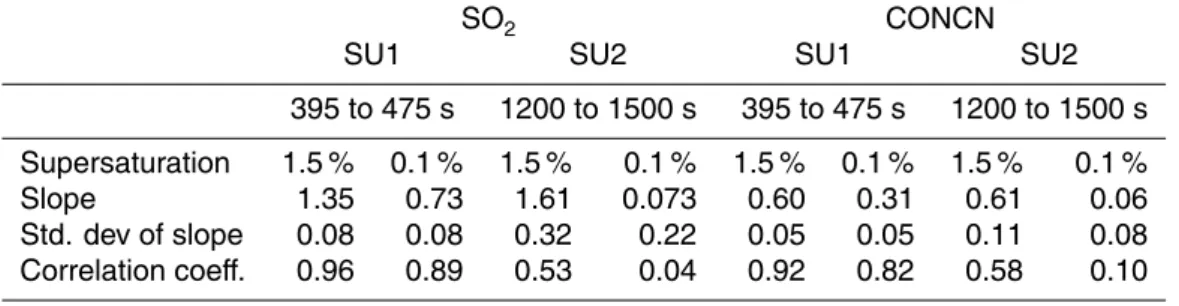
Table 4.Linear regressions of CCN on SO2or CN for two CBL events. Period 395 to 475 s was
a pollution event (n=24). Period 1200 to 1500 s was in a cold pool event (n=66).
SO2 CONCN
SU1 SU2 SU1 SU2
395 to 475 s 1200 to 1500 s 395 to 475 s 1200 to 1500 s
Supersaturation 1.5 % 0.1 % 1.5 % 0.1 % 1.5 % 0.1 % 1.5 % 0.1 %
Slope 1.35 0.73 1.61 0.073 0.60 0.31 0.61 0.06
Std. dev of slope 0.08 0.08 0.32 0.22 0.05 0.05 0.11 0.08
ACPD
11, 14903–14932, 2011Fast sulfur dioxide measurements with
CCN spectra
D. C. Thornton et al.
Title Page
Abstract Introduction
Conclusions References
Tables Figures
◭ ◮
◭ ◮
Back Close
Full Screen / Esc
Printer-friendly Version Interactive Discussion
Discussion
P
a
per
|
Dis
cussion
P
a
per
|
Discussion
P
a
per
|
Discussio
n
P
a
per
|
Fig. 1. Portion of the C-130 descent in clear air to the start of the first surface circle (filled
square). SO2>100 pptv from probable ship plumes was mixed to 500 m a.s.l. Data obtained at
ACPD
11, 14903–14932, 2011Fast sulfur dioxide measurements with
CCN spectra
D. C. Thornton et al.
Title Page
Abstract Introduction
Conclusions References
Tables Figures
◭ ◮
◭ ◮
Back Close
Full Screen / Esc
Printer-friendly Version Interactive Discussion
Discussion
P
a
per
|
Dis
cussion
P
a
per
|
Discussion
P
a
per
|
Discussio
n
P
a
per
|
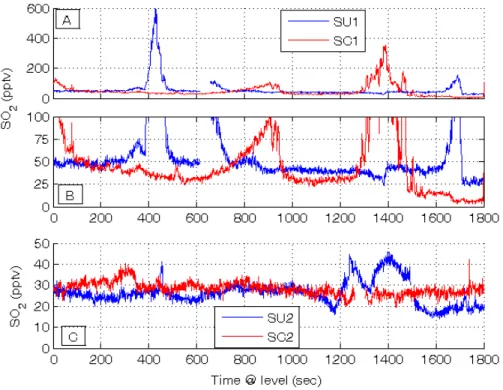
Fig. 2. SO2(1 Hz) time series for CBL circles of RICO F14. (B)shows an expanded scale of
(A). Times are relative to the start times of circles given in Table 1. The SO2peak near 1400 s
ACPD
11, 14903–14932, 2011Fast sulfur dioxide measurements with
CCN spectra
D. C. Thornton et al.
Title Page
Abstract Introduction
Conclusions References
Tables Figures
◭ ◮
◭ ◮
Back Close
Full Screen / Esc
Printer-friendly Version Interactive Discussion
Discussion
P
a
per
|
Dis
cussion
P
a
per
|
Discussion
P
a
per
|
Discussio
n
P
a
per
|
Fig. 3. Time series of NCAR C-130 CN for CBL circles of RICO RF14 without periods of
ACPD
11, 14903–14932, 2011Fast sulfur dioxide measurements with
CCN spectra
D. C. Thornton et al.
Title Page
Abstract Introduction
Conclusions References
Tables Figures
◭ ◮
◭ ◮
Back Close
Full Screen / Esc
Printer-friendly Version Interactive Discussion
Discussion
P
a
per
|
Dis
cussion
P
a
per
|
Discussion
P
a
per
|
Discussio
n
P
a
per
|
Fig. 4.Size spectra from 10 Hz PCASP-200 integrated over the 500 s to 1200 s portions of the
ACPD
11, 14903–14932, 2011Fast sulfur dioxide measurements with
CCN spectra
D. C. Thornton et al.
Title Page
Abstract Introduction
Conclusions References
Tables Figures
◭ ◮
◭ ◮
Back Close
Full Screen / Esc
Printer-friendly Version Interactive Discussion
Discussion
P
a
per
|
Dis
cussion
P
a
per
|
Discussion
P
a
per
|
Discussio
n
P
a
per
|
Fig. 5.Cumulative CCN at 1.5 % supersaturation for the CBL circles of RICO RF14 excluding
ACPD
11, 14903–14932, 2011Fast sulfur dioxide measurements with
CCN spectra
D. C. Thornton et al.
Title Page
Abstract Introduction
Conclusions References
Tables Figures
◭ ◮
◭ ◮
Back Close
Full Screen / Esc
Printer-friendly Version Interactive Discussion
Discussion
P
a
per
|
Dis
cussion
P
a
per
|
Discussion
P
a
per
|
Discussio
n
P
a
per
|
Fig. 6.Mean CCN cumulative concentrations as a function of supersaturation from the 4 CBL
circles for periods free of SO2 pollution and precipitation. Circles SU1, SU2, and SC2 had
ACPD
11, 14903–14932, 2011Fast sulfur dioxide measurements with
CCN spectra
D. C. Thornton et al.
Title Page
Abstract Introduction
Conclusions References
Tables Figures
◭ ◮
◭ ◮
Back Close
Full Screen / Esc
Printer-friendly Version Interactive Discussion
Discussion
P
a
per
|
Dis
cussion
P
a
per
|
Discussion
P
a
per
|
Discussio
n
P
a
per
|
Fig. 7. Change in the cumulative CCN means for the late afternoon circles relative to the
ACPD
11, 14903–14932, 2011Fast sulfur dioxide measurements with
CCN spectra
D. C. Thornton et al.
Title Page
Abstract Introduction
Conclusions References
Tables Figures
◭ ◮
◭ ◮
Back Close
Full Screen / Esc
Printer-friendly Version Interactive Discussion
Discussion
P
a
per
|
Dis
cussion
P
a
per
|
Discussion
P
a
per
|
Discussio
n
P
a
per
|
Fig. 9.Regression of CCN on SO2for 1200 s to 1500 s of circle SU2 which was affected by a