www.atmos-chem-phys.net/13/7511/2013/ doi:10.5194/acp-13-7511-2013
© Author(s) 2013. CC Attribution 3.0 License.
Atmospheric
Chemistry
and Physics
Geoscientiic
Geoscientiic
Geoscientiic
Geoscientiic
Free troposphere as a major source of CCN for the equatorial
pacific boundary layer: long-range transport and teleconnections
A. D. Clarke1,2, S. Freitag1, R. M. C. Simpson2, J. G. Hudson3, S. G. Howell2, V. L. Brekhovskikh2, T. Campos4, V. N. Kapustin2, and J. Zhou2,*
1Department of Meteorology, University of Hawaii at Manoa, Hawaii, USA 2Department of Oceanography, University of Hawaii at Manoa, Hawaii, USA 3Desert Research Institute, Nevada System of Higher Education, Reno, Nevada, USA 4National Center for Atmospheric Research, Boulder, Colorado, USA
*currently at: Alstom Power Group AB, Stockholm, Sweden
Correspondence to:A. D. Clarke ([email protected])
Received: 23 November 2012 – Published in Atmos. Chem. Phys. Discuss.: 11 January 2013 Revised: 17 May 2013 – Accepted: 18 June 2013 – Published: 5 August 2013
Abstract. Airborne aerosol measurements in the central equatorial Pacific during PASE (Pacific Atmospheric Sul-fur Experiment) revealed that cloud condensation nuclei (CCN) activated in marine boundary layer (MBL) clouds were strongly influenced by entrainment from the free tro-posphere (FT). About 65 % entered at sizes effective as CCN in MBL clouds, while∼25 % entered the MBL too small to
activate but subsequently grew via gas to particle conversion. The remaining∼10 % were inferred to be sea salt aerosol.
FT aerosols at low carbon monoxide (CO) mixing ratios (<63 ppbv) were mostly volatile at 360◦C with a number
mode peak of around 30–40 nm dry diameter and tended to be associated with cloud outflow from distant (3000 km or more) deep convection. Higher CO concentrations were commonly associated with trajectories from South America and the Amazon region (ca. 10 000 km away) and occurred in layers indicative of combustion sources (biomass burn-ing season) partially scavenged by precipitation. These had number modes near 60–80 nm dry diameter with a large frac-tion of CCN.2 (those activated at 0.2 % supersaturafrac-tion and representative of MBL clouds) prior to entrainment into the MBL. Flight averaged concentrations of CCN.2 were simi-lar for measurements near the surface, below the inversion and in the FT just above the inversion, confirming that sub-sidence and entrainment of FT aerosol strongly influenced MBL CCN.2. Concurrent flight-to-flight variations of CCN.2 at all altitudes below 3 km also imply MBL CCN.2
concen-trations were in quasi-equilibrium with the FT over a 2–3 day timescale.
The observed FT transport over thousands of kilometers indicates teleconnections between MBL CCN and cloud-scavenged sources of both natural and/or residual combus-tion origin. Nonetheless, in spite of its importance, this source of CCN number is not well represented in most cur-rent models and is generally not detectable by satellite be-cause of the low aerosol scattering in such layers as a result of cloud scavenging. In addition, our measurements confirm nucleation in the MBL was not evident during PASE and ar-gue against a localized linear relation in the MBL between dimethyl sulfide (DMS) and CCN suggested by the CLAW hypothesis. However, when the FT is not impacted by long-range transport, sulfate aerosol derived from DMS pumped aloft in the ITCZ (Inter-Tropical Convergence Zone) can pro-vide a source of CCN to the boundary layer via FT telecon-nections involving more complex non-linear processes.
1 Introduction
been driven by the need for greater understanding of associ-ated atmospheric chemistry and general geochemical cycling of atmospheric constituents but also by the need to quan-tify the impact of anthropogenic emissions on aerosol optical depth (AOD), cloud condensation nuclei (CCN) and clouds.
Modifications to atmospheric radiative processes, either as a result of changes in aerosol optical properties or changes in clouds through CCN (Twomey, 1974; Albrecht, 1989; Kauf-man et al., 2002), are commonly referred to as the direct and indirect effects, respectively, and lead to potential im-pacts on climate. Recent studies have shown these effects are coupled (Hegg et al., 1995; Andreae, 2009) and are man-ifested in regional differences in aerosol optical depth and CCN evident over global scales and linked primarily to bustion (Clarke and Kapustin, 2010). Because many com-bustion aerosols are a result of primary emissions they tend to be larger than those nucleated from the gas phase. This in-creases their relevance to processes linked to light scattering and CCN, both of which are dominated by sizes larger than 50 nm.
Cloud pumping of species aloft by deep convection is also well recognized (Chatfield and Crutzen, 1990) and global transport of these has been a target of many airborne pro-grams (e.g., Hoell et al., 1996). Concurrent scavenging of aerosol can be effective and is often modeled as 100 % re-moval of particles but may be less effective at high aerosol concentrations (Jensen and Charlson, 1984). The associated reduction of aerosol mass and surface area in cloud outflow, in conjunction with cloud induced enhancements in actinic flux, reactive gas phase species and water vapor pumped aloft from the marine boundary layer (MBL), can produce condi-tions favorable for nucleation of sulfuric acid aerosol (Clarke et al., 1998a) especially by late morning in response to en-hanced actinic flux and associated hydroxyl radical (OH) production.
Under exceptional cases of low aerosol surface area, asso-ciated with extreme aerosol scavenging by deep convection in the equatorial Inter-Tropical Convergence Zone (ITCZ), nucleation observed in the upper MBL has been linked to sulfuric acid aerosol produced from dimethyl sulfide (DMS) (Clarke et al., 1998b). However, generally there is enough surface area present in the MBL to suppress nucleation. Hence, as modeled by Raes (1995), we have argued that the more common source of most sub-micrometer nuclei found in the clean boundary layer is expected to be entrain-ment from the FT (Clarke, 1993; Clarke et al., 1996, 1998a, 1999a,b). A review of more recent models and measurements (Quinn and Bates, 2011) support this process as an important source of “natural” aerosol for the MBL. These also often appear to dominate FT aerosol number in the Hadley circula-tion (Clarke and Kapustin, 2010). Following their subsidence into the MBL and growth through heterogeneous processes, some may reach sizes effective as CCN.
Combustion-derived aerosol are often dominated by pri-mary particles (e.g., fly ash, soot) that remain after
heat-ing to 360◦
C but may include secondary volatile and non-volatile organics (Clarke and Kapustin, 2010; Thornberry et al., 2010). A combustion plume typically consists of larger sizes and differs in composition from ITCZ outflow, which is formed by low-temperature gas to particle conversion and dominated by volatile sulfuric acid (Clarke et al., 1999b). Hence, heating of aerosol to 360◦C prior to measurement using a condensation nuclei (CN) counter can often provide a continuous indicator for combustion aerosol, although suf-ficiently large volatile aerosols may compromise this if they do not evaporate completely. Volatile condensation nuclei are referred to here as CNvol and the non-volatile CN, remain-ing at 360◦C, as CNhot. These properties and their links to gas phase measurements and CCN are used to characterize their relation to air mass types and trajectories encountered over the equatorial Pacific. Here we discuss characteristics of aerosol from combustion and cloud outflow, along with their transport in the equatorial FT, and their subsequent size-resolved entrainment into the MBL where they provide the major source of CCN.
2 Experiment location and features
The Pacific Atmospheric Sulfur Experiment (PASE – Bandy et al., 2012) was conducted out of Christmas Island (CI) in the equatorial Pacific during August–September 2007. CI (157◦W, 2◦N) lies south of the ITCZ at this time of year with prevailing trade winds easterly to southeasterly at 6– 12 m s−1. Trajectories in the lower FT have wind speeds of 8–14 m s−1 that can take∼10 days to reach CI after leav-ing SA (South America). CI was selected to study the nat-ural marine sulfur cycle (Bandy et al., 1996; Faloona et al., 2009; Bandy et al., 2012) because it is located in a region of elevated DMS production and because of its remote environ-ment, as the closest upwind continental sources are located about 10 000 km to the east in the northern part of South America.
PASE was a follow-up study of a ground based project on CI in 1994 (Bandy et al., 1996). The influence of upwind sources was expected to be small in the MBL as this pvious study found typical MBL aerosol lifetimes in this re-gion were about 4 days or so (Clarke et al., 1996; Huebert et al., 1996). However, it became evident during PASE that fluctuations in carbon monoxide (CO) and ozone in the FT were associated with patchy transport of combustion derived gases and aerosol (Simpson et al., 2013). Such FT transport has previously been identified for ozone and has been linked to biomass burning over SA (Kim and Newchurch, 1996) known to be active at the time of PASE. Other measurements over the South Pacific have linked fluctuations in ozone and aerosol both from SA (Moore II et al., 2003; Schultz et al., 1999) and the western Pacific (Browell et al., 2003).
Noble (2009) reported average PASE CN concentrations of 379 cm−3 and CCN concentrations at 1 % supersaturation (S) of 301 cm−3with the mean for each flight varying from 211 to 430 cm−3 and they noted frequent trajectories go-ing back to SA. These are higher CCN than have typically been observed in maritime air masses such as during RICO (Rain in Cumulus Over the Ocean) in the Caribbean where mean boundary layer CN was 264 cm−3and CCN at 1 % S was 106 cm−3for 17 eight-hour flights (Hudson and Noble, 2009).
3 Measurements and instrumentation
The Hawaii Group for Environmental Aerosol Research (HiGEAR) aerosol instrumentation focuses on size-resolved aerosol microphysics, chemistry, optics and radiative effects. Descriptions of the sampling inlet and most HiGEAR instru-ments can be found in Clarke et al. (2004), the time-of-flight aerosol mass spectrometer (ToF-AMS), CO and ozone in-struments are described elsewhere (Shank et al., 2012). Con-currently measured CCN spectra at various S are described in Hudson and Noble (2009) and Hudson et al. (2011). On sev-eral flights the CCN counter was sampling ambient air for less time than other measurements. Hence, some flight av-erages of CCN cover shorter periods than other data but we believe they remain representative. A brief summary of these measurements follows.
The ToF-AMS provided volatile ionic and organic aerosol chemistry for sizes between about 0.04 and 1 µm vacuum aerodynamic diameter (Shank et al., 2012); an optical parti-cle counter (OPC, LAS-X with custom electronics) covered sizes from 0.12 to 7.0 µm and included options for thermally resolved sizing at 40, 150, 360, and 400◦C. These sizes generally include most of the CCN activating at S<0.2 %,
those expected to be activated in MBL clouds and which cor-respond to aerosol sizes larger than the Hoppel minimum (Hoppel et al., 1994) discussed below. Two condensation nuclei counters (TSI Mod. 3010) were operated with con-denser temperature 22◦C below the evaporator to measure total aerosol number density >0.01 µm. One CN counter
(hereafter referred to as CNcold) was without a heated in-let to measure ambient CN and the other was coupled to a heater operated at 360◦C to obtain non-volatile aerosol number>0.01 µm (CNhot). CNvol is consequently CNcold
minus CNhot. An ultrafine CN (UCN) counter (TSI Mod. 3025A) provided the number of particles >0.003 µm; an
aerodynamic particle sizer (APS-TSI 3321) provided size spectra from 0.7 to 7.0 µm; light scattering extinction was provided by a 3-wavelength TSI integrating nephelometer (model 3563). A 1 µm size cut impactor was switched in to alternately provide total and submicrometer scattering. Two differential mobility analyzers (DMAs) were used to ob-tain particle size distributions. One was a TSI long DMA (LDMA, TSI 3081 with custom electronics) that measured
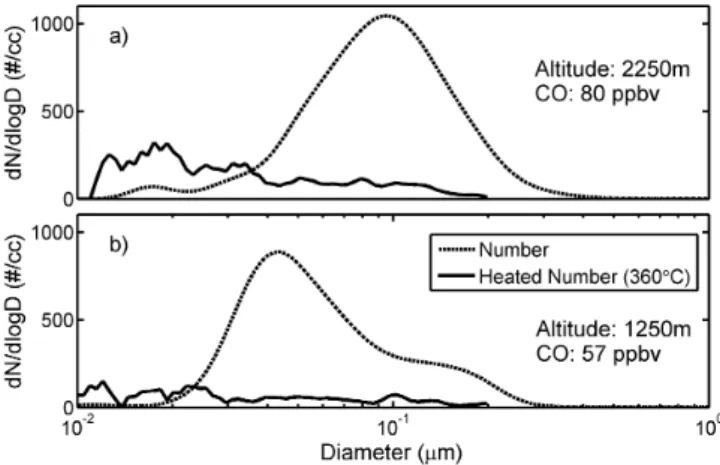
Fig. 1.Examples of DMA distributions in the FT from RF08 for a high and low CO layer before (dotted) and after heating to 360◦C (solid).
particles between 0.1 and 0.5 µm in 60 s scans every 90 s. A radial DMA (rDMA; with custom electronics) scanned from 0.01 to 0.2 µm and was equipped with thermal denuders to measure size distributions before and after heating to 360◦C. Both DMAs were equipped with grab samplers to ensure that entire scans (and sets of unheated/heated scans) used sin-gle air samples. We note that all size distributions and con-centrations reported here are corrected to STP (T =25◦C,
1013 mb) so that they are conserved over altitude changes and can be compared to mixing ratios such as CO.
CO and CNhot are employed here to provide gas and aerosol indicators to identify layers most likely to be influ-enced by combustion. The CO e-folding time in the tropics is near two months (Staudt et al., 2001) and CO is largely con-served during cloud processes. Over the transport timescales here (<2 weeks) it provides a tracer for combustion
influ-ences in both the FT and MBL. In contrast, CNhot is scav-enged by precipitation but is otherwise stable in the FT.
Fig. 2.Examples of a low CO (RF03, 13 August, left panels) and higher CO (RF08, 25 August, right panels) flights with selected data color coded along path as indicated. Black line indicates no data available.
(not shown) indicate that many of these residual particles derive from aerosol in the larger mode that has lost various amounts of volatile material (similar to Fig. 1a). The smaller size mode appears to completely volatilize (Fig. 1b), consis-tent with their nucleation from sulfuric acid in cloud outflow (Clarke et al., 1999a). These residual heated distributions are designated CNhot while the volatile mode are the CNvol (=
CNcold-CNhot). Because these thermally resolved size dis-tributions are infrequent, the rapid (1 Hz) measurement of CNhot and CNvol are used to provide insight into aerosol variability linked to size for short timescales required during
profiles. The CNhot typically track with the larger size range
>0.08 µm and are better CCN at the low S characteristic of
MBL clouds near CI.
4 Aerosol vertical profiles and transport
for PASE. These were typically flown in a region approxi-mately 500 km from CI where we would carry out stacked MBL legs flown in a V pattern with the axis of the wind along the center of the V. These V’s were advected with the wind and interrupted occasionally with profiles through the inversion to about 3–4 km. Based upon observed CO values (Fig. 2a, b), we identify RF03 as “low CO” and RF08 as “high CO” cases. PASE flights 1–7 tended to have more low CO conditions and flights 8–14 tended to have higher CO (Simpson et al., 2013). However, as evident for RF08, both lower and higher CO values occur in layers at various alti-tudes. Such “layers” are commonly associated with increases in sulfur dioxide (SO2), CCN, and CNhot (Fig. 2d, f, h), as expected for a combustion source. Approximately one hun-dred FT profiles between the trade wind inversion (TWI) and 3 km or higher were done during the 14 PASE flights. The TWI height is calculated for each flight but was often located near 1300 m (Conley et al., 2011).
5 Natural aerosol from convective outflow
First we consider transport processes associated with the lower CO conditions exemplified by RF03 in Fig. 2. Such “clean” layers aloft are characterized by smaller more volatile particles observed in deep convective outflow (Clarke et al., 1999b) and commonly linked to trajectories reaching back to ITCZ convection (Freitag et al., 2013). Most PASE flight patterns were similar to those indicated in Fig. 2. Only one mission, RF04 (15 August), was dedicated to ex-ploring cloud outflow in the ITCZ below 6 km. Our trajecto-ries (see Fig. 5) and winds suggested that this type of ITCZ outflow was representative of similar low CO layers com-monly observed above CI.
Because of the distance from CI to ITCZ convection, the limited flight time and the altitude constraints of the C-130 aircraft, this flight required a precipitating target cloud that was accessible to the C-130 (below 6 km) but detraining in the FT (with low aerosol surface area). Such target clouds were evident in Geostationary Operational Environmental Satellite (GOES) imagery as less intense convection along the southern boundary of the ITCZ. In order to accommo-date flight planning and pilot requirements, target clouds had to be identified the night before by reviewing GOES infrared imagery and selecting a cloud group with indicated cloud top temperatures consistent with outflow near 5 km. Trajectory forecasts were then used to predict whether this cloud group would advect within our flight range (near 4.5◦
N, 157◦
W) the next day. This approach is similar to previously studied cloud-outflow altitudes (Clarke et al., 1999b) but at lower el-evation than some of the more convective ITCZ clouds.
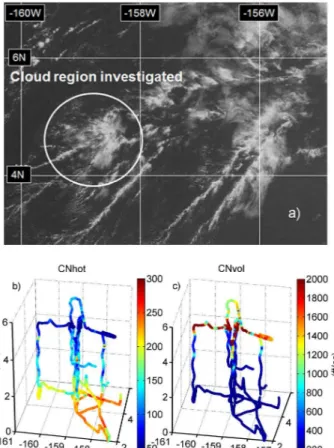
The selected target-cloud feature was successfully located on RF04 and is circled in the GOES visible image (Fig. 3a) taken during our cloud sampling. Numerous profiles (Fig. 3b) were flown around this precipitating cloud near mid-day
be-Fig. 3.GOES visible image (top) for 22:30 UTC during RF04 cloud study (15 August 2007). Flight path plots (bottom) color coded with CNhot (left) and CNvol (right). Horizontal legs to west, south and east flown in outflow layers at 4.3 km show marked depletions of CNhot and strong enhancement of CNvol relative to the MBL.
cause earlier studies in Tasmania and the ITCZ had revealed favorable photochemistry for nucleation of sulfuric acid ex-isted by local noon (Clarke et al., 1998a). The initial RF04 profile to 6 km confirmed the major cloud outflow was be-tween 4 and 4.5 km. Subsequent profiles to outflow altitudes included horizontal legs flown east, west and south of the cloud. CNhot are near 360 cm−3at the surface but are highly scavenged in the outflow layer (Fig. 3b) while CNvol are low near the surface but approach 3000 cm−3in the outflow (Fig. 3c), which reflects their localized production.
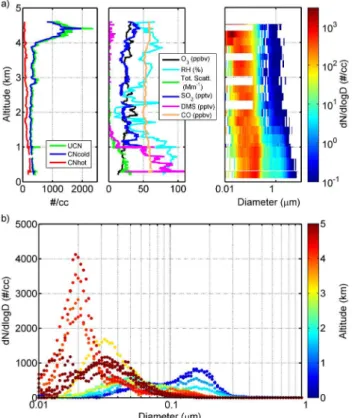
Fig. 4. (a)Example profile for RF04 cloud study. Left panel shows CNhot generally decreases with altitude and is anticorrelated with CNcold and UCN. Middle panel illustrates how the DMS maxi-mum near surface is depleted above inversion, as is total aerosol light scattering. Enhanced outflow around 4300 m is associated with increases in DMS and UCN, where the increase in UCN indicates recent nucleation. Lowest values for CNhot and light scattering are most evident at this altitude range, indicating greatest scavenging where CO is close to surface values (see text for details). Right panel reveals concurrent associated 2-D size distributions color coded with concentration.(b)Distributions from a second nearby profile include those above (brown) and below (yellow) the outflow layer (orange-red). The outflow nuclei peak at 0.02 µm extends down be-low 0.01 µm, while MBL distributions (blue) show negligible CN present below 0.03 µm.
shown). As the convective cloud was rooted to updrafts from the MBL evident both visually from the aircraft and from DMS enhanced in the outflow (Fig. 4a), this depletion indi-cates cloud scavenging of most MBL CCN where values for CCN measured at S of 0.2 and 0.4 % were about 150 and 190 cm−3, respectively. This case of nucleation in cloud out-flow near 4 km shares the same features we have observed for nucleation found in this region for outflow at higher al-titudes (Clarke et al., 1998a, 1999b). Similar ITCZ convec-tion is also linked to observaconvec-tions of such nuclei on other PASE flights discussed below and in Freitag et al. (2013). We further note that the MBL size distributions below cloud (Fig. 4b, blue color) show no evidence of recent nucleation, as was also true for all PASE flights.
CO in the cloud outflow around 4300 m is 60 ppbv com-pared to 60–63 ppbv measured below 1000 m for the four profiles (Fig. 4b). CO varies between 54 and 60 ppbv in the intervening layers. CNhot in the outflow varies from 40 to 60 cm−3 compared to ∼270 cm−3 below 1000 m and with
values of 150±30 cm−3in the intervening layers. If we
as-sume no mixing of BL air with the intervening layers during convection then this implies a lower limit of∼80 %
scaveng-ing of CNhot in the outflow. Similarly, if we use the measured values of CCN mentioned above, scavenging is∼75 %. Any
mixing of cloud scavenged air during convection with inter-vening layers will tend to increase CNhot and lower CO. The
∼1–2 ppbv lower value for CO in the outflow compared to
the BL could be due to mixing of about 20–30 % of the inter-vening layer air and this could contribute∼30–50 cm−3of
additional CNhot (if none are scavenged) to the outflow. This would imply an increase in the estimated scavenged fraction of BL CNhot to∼90 % or more. Hence, we consider 90 %
to be a reasonable estimate for scavenging of BL CNhot and CCN for this cloud outflow near 4 km. Ozone also shows generally higher values in the FT but the lower value in the outflow is consistent with the lofting and mixing of the MBL air with lower ozone.
DMS near 4 km is about 5–10 pptv in the outflow (Fig. 4a) and only about 10 % of MBL values but is negligible in the intervening layers, indicating insignificant detrainment of MBL air at intervening altitudes. SO2in these intervening layers was about 20–25 pptv and about 60 pptv in the BL (not available on this profile but measured on others) and about 35 pptv in the outflow. The relative enhancement in DMS in the outflow is much less than that of SO2suggesting a signif-icant fraction of the DMS had been converted to SO2and/or sulfuric acid in the outflow. This is expected for nucleation, as previously shown for the equatorial region (Clarke et al., 1999b). Particles grow in these outflow layers until precur-sors are depleted. Because coagulation for these sizes is slow, these aged distributions can be stable until subsidence and entrainment brings them into contact with new sources.
6 Combustion aerosol from convective outflow
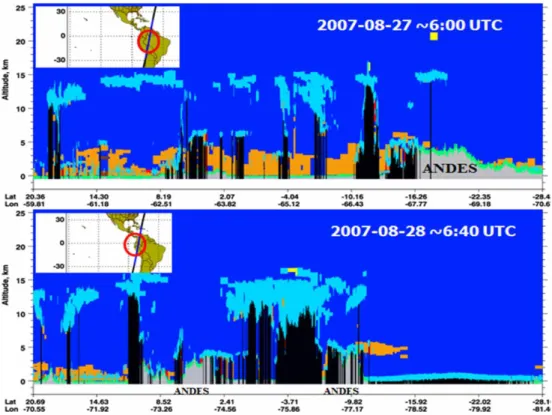
Fig. 5.Back trajectories for RF14 color coded with(a)aircraft start altitude for 3-D trajectories,(b) date on latitude-longitude projec-tion with HYSPLIT precipitaprojec-tion expressed in marker size. The blue circles in the lower left corner exemplify precipitaprojec-tion intensities of 1/5/10 mm h−1. Plot(c)shows measured CO on latitude-longitude projection, (d)CO on vertical projection and(e) CNhot on vertical projection.
An example is shown in Fig. 5 for a complete profile from RF14 where C-130 measurements are color scaled and mapped onto corresponding HYSPLIT trajectories cre-ating a direct visual link between trajectories and parame-ters measured in situ that are linked to sources (Freitag et al., 2013). Figure 5a, shows trajectories colored by aircraft alti-tude above the inversion. Colors range from blue for lower altitudes near 1200 m to red at higher altitudes near 3200 m. Most elevated CO layers in the FT near CI were found within this range (see below). This 3-D visualization reveals that the air between 1200 and 2200 m over CI had subsided during transport from SA. Above 2200 m, air was associated with BL marine air that initially flowed from the SE into the ITCZ where it was lofted up to 6 km before subsiding to about 3 km near CI.
Figure 5b shows the same trajectories projected onto lati-tude and longilati-tude and colored by time in days before arrival at the aircraft position. The circular features superimposed on the trajectories about 9 days back are sized in proportion to HYSPLIT estimated rainfall. These features follow the to-pography of the Andes Cordillera in SA toward the east and to a cluster of convective elements in the ITCZ to the north. Trajectories colored by measured CO (Fig. 5c) show highest CO for trajectories that passed over SA within a few degrees of the Equator between 60 and 80◦W. Lowest CO values are associated with those in the BL marine air transported to the ITCZ and lofted by convection.
Fig. 6.CALIPSO data for indicated times and locations associated with back trajectories to these locations shown in Fig. 5. Strong pollution from biomass burning fills the Amazon basin (top-orange). Deep convection in the region of maximum Amazonian precipitation is evident in Ecuador east of the Andes near 3.71◦S as a precipitation-attenuated signal (black) below clouds (light blue). Some cloud pumping and transport of aerosol (orange) over the Andes is also evident.
the Andes near the Equator about 9–11 days before and are enhanced in CNhot, consistent with non-volatile com-bustion derived CN. The marked variation in trajectory al-titudes east of the Andes occurs in the region of deep con-vection, indicated by the HYSPLIT rainfall, and consistent with the Andes topography. Near 3 km on the CI profile, the in situ measurements are very different for the trajectories from the ITCZ. These trajectories have the lowest CO and low ozone (not shown), consistent with clean aged BL air from the Southern Hemisphere. These trajectories represent clean air outflow from the ITCZ scavenged of larger aerosol (low CNhot) and enhanced in volatile nuclei (not shown), as discussed previously for Fig. 4. Although trajectory pat-terns differed from flight to flight, the interleaving of layers with combustion influence and clean layers were common and form the basis for the analysis that follows.
Although individual trajectories in excess of 10 days are often questionable, this equatorial region is commonly asso-ciated with stable and persistent winds after they leave SA (Freitag et al., 2013). The example above, and others dis-cussed in Freitag et al. (2013), show the marked differences in air mass physiochemistry over the profile correspond to the altitudes showing marked difference in 12 day back tra-jectories. This concurrence builds confidence in these trajec-tories for this region. Below we argue that convective
activ-ity associated with both of these distant air mass injections and subsequent transport constitute teleconnections to the BL aerosol and CCN over the central equatorial Pacific.
The Cloud Aerosol Lidar and Infrared Pathfinder Satel-lite Observations (CALIPSO; http://www-calipso.larc.nasa. gov/products/lidar/browse images/production/) provide ad-ditional support of the HYSPLIT clustering of trajectories over the equatorial Amazon region and evidence of convec-tive lofting associated with precipitation. CALIPSO passes over this region can resolve convective cloud features and in-dicate inferred aerosol over altitude ranges. Figure 6 shows CALIPSO products near 65◦
W (8/27), and near 75◦
the lifting, transport and expected scavenging of aerosol by this convection.
7 Stratification of clean and combustion influenced air masses
Clean and combustion influenced layers, as shown in Fig. 2 and exemplified by the distributions shown in Fig. 1, were ev-ident on most flights. However, any given flight presents an incomplete picture regarding the possible influence of com-bustion layers and any link to MBL aerosol properties or CCN. This is because layers aloft are often a few hundred meters thick and are subsiding and being entrained at about 0.4–0.6 cm s−1 (Clarke et al., 1996; Huebert et al., 1996; Conley et al., 2009). Hence it takes on the order of a day for a layer to mix into the MBL. A combustion layer passing over the Andes near 5 km and subsiding at 0.5±0.1 cm s−1will
take roughly 10 days to descend to the inversion (∼1300 m)
in the central Pacific. Variations in horizontal winds and sub-sidence mean that some layers encounter the inversion in a day or two upwind or downwind of the CI region. There-fore, air we encountered in the PASE MBL was probably influenced by previously entrained layers that are no longer present in the FT. Conversely, layers we encountered above the inversion will not have impacted the MBL prior to reach-ing CI. Consequently, combustion layers measured in the FT are seldom linked to same-day observations in the MBL. Moreover, the MBL reflects a mix of aerosol from prior ad-vection and entrainment that has been exposed to additional sources of gas (e.g., DMS) and aerosol (e.g., sea salt), all modulated by cloud processing. Hence, we focus our assess-ments on properties of aerosol transported in the FT.
8 Gas, aerosol and CCN relationships
Figure 7a shows the linear relation between CNhot and CO from a layer in the FT near 2 km on RF14, color coded by CCN measured at 0.2 % saturation (CCN.2). Other flights exhibit similar trends although slopes vary from case to case. This behavior is distinct from the CNvol that commonly vary inversely with CO (e.g., Fig. 4). Figure 7b shows the rela-tionship of CCN.2 to CNhot color coded by flight number. This relation persists throughout PASE and has a tendency for higher values toward the end of PASE when CO tended to be higher. The relation of CNhot and CCN.2 differ somewhat for each flight but maintain a near 1:1 trend over the range
of conditions during PASE. CNhot tend to exhibit larger sizes than most natural volatile aerosol and this accounts for their strong trend with CCN.2. Hence, we use the continuous CN-hot measurement as an approximation of CCN.2 during peri-ods of ambient data gaps of the CCN instrument.
We employ CO to stratify all of the PASE profile data into cases with low CO, expected to represent clean and aged air masses, and those with higher CO, indicative of air more
re-Fig. 7. (a)An example of typical correlation between CNhot and CO in an elevated CO FT layer colored with CCN.2;(b)the relation between CNhot and CCN.2 for all PASE flights colored with flight number; and(c)submicrometer light scattering vs. submicrometer mass from the OPC above TWI colored with CO.
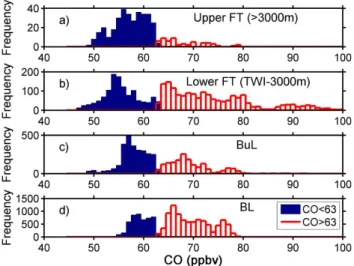
Fig. 8.Histograms of observed CO concentrations during PASE for indicated altitude ranges. A few measurements in the lower FT ex-ceeded 100 ppbv but are not shown here for plot clarity.
excursions in combustion derived CO, we assume here that 50 ppbv represents an effective equatorial Pacific background for CO free of combustion influence. We later use CO minus 50 ppbv as a reference for deviations from clean air condi-tions in this region.
Clear distinctions are evident in each of the histograms with a cluster of high frequencies of occurrence of CO be-low about 63 ppbv (blue histograms) at all altitudes and a broader range of values above that. The largest range of con-centrations is evident in the lower FT, where distinct air mass types can persist with limited mixing. Values above 63 ppbv (red histograms) are least common above 3 km. The lowest CO is expected in clean air that has been pumped aloft in the ITCZ and aged longer. Assuming a lifetime of 50 days in the tropics (Staudt et al., 2001), FT air at 58 ppbv would drop to about 53 ppbv after about 4.5 days aloft but could be shorter in regions of elevated OH near deep convective clouds. CO histograms in the BuL reflect the mixing of BL with lower FT air. The narrowest range for CO is in the BL, as expected for an evolving mix of both higher and lower values from aloft.
In view of these histograms, we arbitrarily use CO at 63 ppbv to stratify various data into “low CO” (blue) and “high CO” (red) categories and show profiles for all PASE flights in Figure 9a. Our motivation is to avoid present-ing campaign average data that may not reflect conditions at other times or seasons, etc. In fact, the 2007 PASE ex-periment occurred when the seasonal biomass burning in South America was higher than normal (Giglio et al., 2010). Even so, we and others find the more combustion influenced air usually travels in FT layers a few hundred meters deep (Thouret et al., 2001) separated by cleaner air layers. Sea-sonal differences are expressed in the frequency of occur-rence of combustion influenced layers (e.g., concentrations
of ozone and CO) and are pronounced in the 2–6 km alti-tude range (Schultz et al., 1999). Hence, our resulting strati-fied aerosol data and profiles should encompass the range of clean and combustion influenced values in the equatorial Pa-cific encountered at different altitudes on different years or times of the year.
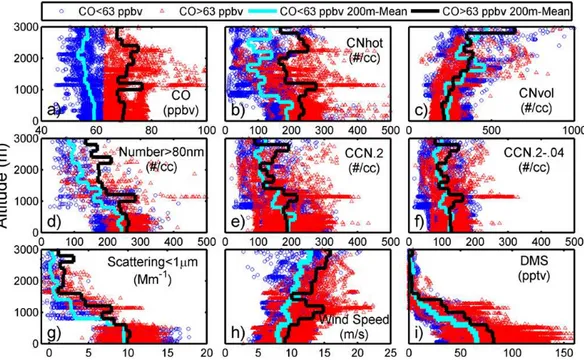
When stratified, the higher CO cases tend to have higher CNhot and lower CNvol than those with CO<63 ppbv both
in the FT and in the MBL (Fig. 9b, c). Nominal MBL CCN (Fig. 9d), the number of particles larger than 80 nm (N80)
obtained from integrating measured size distributions larger than the Hoppel minimum, are also greater for the higher CO cases. Submicrometer light scattering, dominated by op-tically active sizes between 0.1 and 1.0 µm, is elevated in air masses above the mixed layer having higher CO (Fig. 9g), as also demonstrated in Fig. 7c.
It is interesting to compare the various number profiles in Fig. 9b–f: CNhot, CNvol,N80, CCN.2 and CCN.2-CCN.04
(CCN.04 are those activated at 0.04 % S). CNvol are distinct in that they increase steadily with altitude while the others all decrease or are variable. CNvol also show little difference with CO, indicating that these smaller volatile aerosols are associated with sources aloft only weakly related to varia-tions in CO. CNhot tend to be higher near the surface and decrease aloft with a layered character. Large excursions evi-dent at a constant altitude correspond to sequential data from level legs, indicating marked mesoscale horizontal variabil-ity. CNhot are also typically much higher when CO is ele-vated. There are fewer measurements of N80 but these are
quite similar to CCN.2 in their decrease with altitude but are slightly higher in MBL concentrations. This suggests that typical MBL cloud S that establishes the Hoppel minimum near 80 nm is slightly above about 0.2 %. Higher CO aloft is generally associated with higher values for both. Because CCN larger than about 200 nm are activated at low S near 0.04 %, we can subtract these CCN.04 from those measured at 0.2 % S to examine sizes that dominate CCN number typ-ical of MBL clouds (Fig. 9f). Hereafter we call this differ-ence CCNdiff. This crude approach effectively removes the contribution of the largest aerosols (particularly larger sea salt present below the inversion). Aloft there is little differ-ence from CCN.2 (Fig. 9e) as there are relatively few larger aerosols there. However, in the MBL the CCNdiff are lower than the CCN.2 and show less variability.
In spite of more limited CCN measurements on FT pro-files the CCNdiff are greater in the presence of enhanced CO (Fig. 9f). Less difference is evident in the BL but mean val-ues are only 20 cm−3 higher than those aloft. In the MBL values are about 125 cm−3compared to about 190 cm−3for CCN.2. This is an increase of about 65 cm−3above FT val-ues due to a combination of sea salt production and or aerosol growth into sizes larger than∼200 nm. Lowest values aloft
forN80, CNhot and CCN.2 are in the 30–50 cm−3range and
Fig. 9.Vertical profiles for diverse measurements for all PASE data when classified by CO values above (red) and below (blue) 63 ppbv as shown in(a)and illustrated in Fig. 8.
that this accounts for the lower values of CCN.2 present in the FT.
The CO stratification above is also applied to the merged size distributions measured by the DMAs, OPC and APS in Fig. 10, generally available every minute or so. The stratified size distribution profiles (Fig. 10a–d) represent means over the entire PASE campaign. They should be viewed as those expected for a PASE profile if low CO were present at all altitudes (Fig. 10a, c) compared with a profile if CO were el-evated at all altitudes (Fig. 10b, d). The black dashed vertical reference line near 80 nm is included to reveal differences in sizes based on this CO stratification. This value is cho-sen to visually separate sizes that are expected to be CCN.2 (i.e.,>80 nm) in typical PASE MBL clouds, as evident by
the pronounced Hoppel minimum in the BL.
Above 1500 m the number of particles larger than 80 nm (Fig. 10a, b) is significantly higher for the high CO cases. The number size distribution peaks are also shifted to larger sizes by a factor of about 1.6, which corresponds to about 4 times as much mass per particle. This difference is more evident in the particle surface area plots for the FT (Fig. 10c, d). Below the inversion, growth in this size range is linked to sulfate production from DMS. Wind speeds (Fig. 9h) are also higher for the higher CO cases, suggesting that the latter are linked to more active transport. In addition, DMS is higher in the BL for higher CO and negligible in the FT (Fig. 9i), with active conversion in the BuL. This does not appear to arise from a larger ocean DMS flux due to higher wind speeds but rather to CO providing a more effective sink for OH and as such reducing the destruction of DMS (Simpson et al., 2013).
Mean size differences are more evident when separately averaging all measured clean (Fig. 10e) and combustion-influenced (Fig. 10f) PASE number size distributions strat-ified over selected altitude ranges. These ranges are chosen to reflect the mean mixed layer (0–600 m), the BuL (600– 1300 m), the layer just above the inversion (typically found near 1300–1700 m), and the adjacent FT (∼1700–2500 m)
where CO layers were most common (Fig. 9a). The FT dis-tributions (black lines) with higher CO have a number mode above 60 nm (Fig. 10f) while the lower CO case peaks at 40 nm (Fig. 10e).
Concentrations for the clean case at slightly lower altitudes just above the inversion (1300–1700 m), when compared to the FT layer, are the same near the Hoppel minimum, greater at large sizes and lower at small sizes but total number (area under these two curves) is approximately the same. Below the inversion in the BuL (cloud layer) the Hoppel minimum is prominent near 80 nm (black dashed line) and concentrations exceed those in the FT for sizes greater than this minimum but are less for smaller sizes. The two modes associated with the Hoppel minimum are larger at the lowest altitude (BL) than the BuL, which suggests a net growth of smaller sizes through the Hoppel minimum.
Fig. 10. (a–d)PASE mission averaged vertical profiles of size distributions color coded by number (upper) and area (lower) for low CO (left) and high CO (right) data.(e, f)Mean size distributions for indicated altitude ranges stratified by CO. The black vertical line indicates the Hoppel minimum, the representative diameter above which particles are active CCN in typical clouds, while the vertical gray line approximates the start of the minimum, showing the smallest sizes at which activation occurs.
the Hoppel minimum. These plots also indicate a smaller fraction of aerosol that did not act as CCN in the MBL when CO is higher. This is consistent with more FT aerosol be-ing larger and more likely to be CCN compared to the low CO cases (Fig. 1). However, it is important to note that the BL distributions represent the net effect of entrainment that took place upwind of measured profiles while the FT data are yet to be entrained and will only influence the MBL over the next several days. We have also not yet accounted for sea salt present in the MBL (Hudson et al., 2011) or the observations of vertical mixing near the end of PASE when winds and CO values were generally higher and when boundary layer rolls were more prevalent. We also note that size distributions in Fig. 10 can involve sampling of cloud outflow mixed with preexisting aged FT aerosol, probably derived from similar processes in the past. Hence, both groupings include con-tributions from preexisting FT aerosol so they are less well defined than distributions for individual cases (Fig. 1).
9 Entrainment and regional CCN variability
The discussion above provides a context for looking at the variations in CCN during PASE. Because the diameter and breadth of the Hoppel minimum are established by the mean in-cloud supersaturation and its variability, respectively, we use it to evaluate actual aerosol sizes acting as CCN in the PASE environment. A comparison of the sizes above and be-low cloud (Fig. 10) reveals a Hoppel minimum near 80 nm, which is approximately the minimum diameter for an am-monium bisulfate particle to activate at 0.2 % S, typical in trade wind cumulus. Hence, we use CCN.2 as a represen-tative measure of actual CCN activated in this region. How-ever, the width of this minimum extends down to 50 nm (grey dashed lines in Fig. 10) indicating higher S near 0.3 % must have activated some of these. Figure 10e and f indicate the typical diameter increase in the MBL relative to the FT is
about a factor of 2 for the activated sizes larger than 80 nm in the FT while for smaller sizes below 40 nm it is some-what less. Hence, in the MBL, the mass of activated sizes increased by roughly a factor of 8 while the unactivated sizes increase by about a factor of 5 or so. However, because the latter growth occurs on much smaller sizes their mass in-crease represents less than 10 % of the total mass added to the aerosol.
In view of this entrainment process, it is of interest to examine the flight-by-flight variability (Fig. 11) in various measurements averaged over three altitude ranges: BL (0– 600 m), BuL (600 m to the inversion) and above inversion (inversion to ca. 3 km). In spite of less data in the BuL and least in the FT, there is enough for representative com-parisons over all three altitudes. Cases with elevated CO (Fig. 11a) are more evident in the second half of the experi-ment (Simpson et al., 2013) and CO in the MBL tends to be higher than the FT in early flights.
Fig. 11.Mean values over each flight for indicated PASE measure-ments in the surface mixed layer (BL), buffer layer (BuL) and in the FT<3 km. See text for details.
Table 1.Mean concentrations of key parameters in lower BL, BuL and FT<3 km.
BL BuL FT BL minus BuL minus
<3 km FT<3 km FT<3 km
CO (ppbv) 63 63 61 2 2
O3(pbbv) 18 20 25 −7 −5
SO2(pptv) 52 38 37 15 2
DMS (pptv) 71 36 5 66 31
CNhot (cm−3) 253 212 158 95 55
CNvol (cm−3) 185 217 375 −191 −158
CNtot (cm−3) 438 429 533 −95 −104
CCN.04 (cm−3) 63 56 24 39 32
CCN.2 (cm−3) 192 182 125 67 57
CCN.4 (cm−3) 241 235 187 54 48
TotScatt (Mm−1) 31 15 2 29 13
demonstrates CCN.04 for each flight are a small fraction of the CCN.2 and their concentrations in the FT are less than BL or BuL concentrations both because there is sea salt pro-duced in the BL and because growth to larger sizes is most active below the inversion.
In order to better reveal the trends for the smaller CCN.2 that dominate CCN in MBL clouds we look at CCNdiff (CCN.2 minus CCN.04) at each altitude range (panel 11f). By taking this difference we exclude the largest CCN acti-vated at an S of 0.04 % corresponding to sizes above about 240 nm for ammonium bisulfate and about 190 nm for sea salt. The number of data points in these averages varies from flight to flight because of different times spent at each alti-tude range (Fig. 2) and because the CCN counter was not always making ambient measurements for the entire flight. Nevertheless, CCNdiff show a similar range of values in the FT and MBL and are seen to contribute about 75 % (±20 %)
to the CCN.2 present in the MBL. This percentage would be larger if we included the contributions from sizes be-low 80 nm in the FT that grew through the Hoppel mini-mum when activated by higher than average S (e.g., between grey and black dashed lines in Fig. 10). Once activated in cloud (perhaps during the entrainment process) these can add mass heterogeneously and, in subsequent cloud cycles, will be more favored to activate at a lower S. Higher concentra-tions of smaller sizes aloft (Fig. 10) compared to the MBL, and the previously noted lack of nucleation in the MBL, con-firms that most CCN in MBL clouds near CI were derived from the FT via entrainment.
pseudo-equilibrium. A correlation (not shown) for CCN.2 above and below the inversion for the data in Fig. 11d results in aR2of 0.56 and an intercept of 34 cm−3. This reveals a
clear coupling between FT and MBL concentrations in spite of the 2–3 day timescale for entrainment.
These features are also expressed in the campaign mean values shown in Table 1. As in Fig. 11, the data have been averaged over all flights for values near the surface (BL), be-low the inversion (BuL) and above the inversion (FT<3 km).
Here, measured CCN activated at 0.4 % S (CCN.4) has also been included to provide a sense of the sensitivity of the num-ber of CCN to actual supersaturations between 0.2 and 0.4 %. The last two columns include the means for the BL and BuL, after subtracting values from above the inversion.
The total CN averaged over the PASE campaign are 438, 429 and 533 cm−3 for surface, below and above the inver-sion, respectively. As mentioned earlier, the marked reduc-tion in the CNvol entrained into the MBL indicates a rapid loss of these smaller volatile particles in the BuL, perhaps associated with the cloud-related entrainment process. Size distributions of SSA larger than about 750 nm include about 2.5 cm−3in the BL and about 1.2 cm−3in BuL.
In order to estimate the SSA contributions to CCN dur-ing PASE we note that enhanced MBL surface area below
∼1500 m (Fig. 10) is primarily due to sea salt. The
associ-ated number distributions can be compared to dry SSA size distributions established for breaking waves (Clarke et al., 2006). That data showed that about 8 % of the freshly pro-duced SSA number were larger than 750 nm while about 50 % (about 6 times as many) were larger than about 80 nm. Assuming the shape of their SSA distribution is the same for PASE, and scaling the numbers larger than 750 nm men-tioned above by 6, this implies SSA on PASE should include about 15 cm−3 larger than 80 nm (nominal CCN.2) in the lower BL and about 15 cm−3 (total) or 8 cm−3 larger than 80 nm in the BuL.
Subtracting these estimated SSA from the measured CCN.2 we are left with the sub-750 nm non-SSA CCN.2 as 177 cm−3 (192 cm−3 minus 15 cm−3) in the BL (simi-lar to Hudson et al., 2011) and 174 cm−3(182 cm−3 minus 8 cm−3) in BuL. Because the mean above-inversion CCN.2 concentration is around 125 cm−3 this suggests there are about 50 cm−3 more non-SSA CCN.2 in the BuL and BL than aloft. This is somewhat higher than implied by the in-tercept of 34 cm−3noted for the previously mentioned corre-lation between CCN.2 above and below the inversion. These estimates imply that most of the increase in CCN and CNhot below the inversion is primarily a result of growth through the Hoppel minimum to larger sizes, as indicated in Figure 10b, with about 20 % of the increase due to SSA. For a steady state inversion height, growth in the MBL will reflect sulfate conversion from DMS during the residence time established by the balance between entrainment and divergence. Growth is expected to be greater for activated sizes than interstitial sizes as their in-cloud surface areas will be far greater.
More-Fig. 12. (a)Trends in CNhot, CCN.2, and AMS sulfate vs. CO for level MBL legs during RF05;(b, c)profiles of CO and CCN.2 for RF05.
over, in-cloud aqueous phase chemistry can add more mass than in clear air (Simpson et al., 2013).
10 Entrainment scales and mixing into the MBL
Most of the above discussion has focused on mission mean or flight mean aerosol measurements. However, individual flights (e.g., Fig. 2) show that patchy layers of enhanced combustion aerosol several hundred meters thick can sub-side to the inversion and may lead to mesoscale MBL gra-dients in CO and aerosol once entrained (Shinozuka et al., 2004). Since such gradients influence how representative a sampling strategy may be they are investigated here.
increased to 63 ppbv. Measurements from a later MBL pro-file (Fig. 12c) around 00:30 UTC and located about 50 km east of the first profile reveal enhanced CO and CCN.2 present near 1 km. These mesoscale differences imply en-hanced CO in the BuL is linked to elevated CO above the inversion, indicative of active entrainment of air with ele-vated CO. Wind directions varied systematically from about 80 to 100◦ with a period of about 90 min and wind speeds were 8–11 m s−1in the MBL and about 14 m s−1above the inversion, indicating that coherency of FT and MBL concen-trations should not last long. The gradient in CO over the V’s persisted over flight duration but trended lower by about 1 ppbv as the air advected through the V pattern (not shown). The size distribution (not shown) from the 2000 m layer of elevated CO (Fig. 12a) was shifted to the larger sizes characteristic of “high CO” distributions as shown in Figs. 1 and 10b. Here, about half the number are larger than 80 nm and will be entrained as CCN.2 into the MBL. There was also enhanced volume (mass) evident around a mode diam-eter of 0.15 µm in this layer. Even so, this is only about one third of the mass present for this mode in the MBL. Conse-quently, even though this combustion aerosol aloft can con-tribute to the flux of sulfate mass into the MBL (Simpson et al., 2013) the associated mixing and divergence would ac-tually reduce (dilute) the MBL mass concentrations. How-ever, because the associated CN (not shown) and CCN.2 number concentrations are greater at 2000 m (Fig. 12a) than in the MBL, entrainment will lead to a concurrent increase of CN and CCN.2 concentrations in the MBL.
The common trend evident in CNhot and CCN.2 with CO (Fig. 12a) indicates entrainment is influencing all three ob-servations over a 100 km scale in the BL. In this case, CCN.2 increases from about 170 to 225 cm−3or about 30 % as CO increases from 58 to 61 ppbv, implying active entrainment of FT air. Even if the gradient in aerosol was driven by pre-cipitation scavenging (very low in this region) we would not expect to see a gradient in CO as it would be conserved for this process.
Also note, when CO remains in the 60–61 ppbv range the AMS sulfate (Fig. 12a) increases from about 4 to 5 µg m−3, far more than corresponding changes in CCN.2 and CNhot. This may result from the continued addition of sulfate mass to the entrained CCN.2 after they reach their peak concen-tration. Interestingly, this apparent addition occurs in the re-gion where the greatest cloud fraction was evident in the BuL based upon measured reductions in downwelling UV radi-ance and in-flight video observations (not shown). We spec-ulate that in-cloud processes (non-precipitating) may be re-sponsible for this relative increase in mass (Simpson et al., 2013). Further note that all CO values lie just below our threshold of 63 ppbv for “low CO”, indicating that even this low value does not ensure combustion aerosol will be ex-cluded. This mesoscale variability on a given flight is simi-lar to our observations over the Southern Ocean (Shinozuka et al., 2004) and is a reminder that our flight average data
(e.g., Fig. 11) includes variability that can differ in the BL, BuL and FT and that sampling representative aerosol, even in the most remote oceanic regions, needs to be considered carefully and with attention to cloud features.
11 Discussion
The case study of ITCZ convection demonstrated scavenging of boundary layer marine aerosol and CCN was about 90 % effective and nucleation was active in this outflow region. This example is taken to represent processes in ITCZ regions that influence scavenged layers with elevated nuclei and low CO encountered in the lower FT near CI. The DMS and SO2 gas phase precursors in this ITCZ outflow yield about 40 pptv sulfate aerosol mass, similar to the mean value (∼35 pptv)
found by Simpson et al. (2013) in the FT for low CO cases between 2 and 3 km for all other standard PASE flights (mean concentrations were double for CO above∼63 pptv). Hence,
these scavenged outflow layers can evolve, complete the con-version of gas to particles and help contribute to these typi-cal sulfate concentrations found in the low-CO layers. Based upon estimated sulfate production in the outflow layer dis-cussed for this flight and the size distributions above and be-low the inversion, most MBL sulfate produced via DMS will be accumulated on the larger FT aerosol after it has been en-trained and been activated as CCN in the MBL.
This process, coupled with the absence of nucleation in the MBL during PASE, demonstrates that the linear relation between MBL DMS and the number of CCN as presented in the CLAW hypothesis (Charlson et al., 1987) is not repre-sentative of processes active in this region. However, a feed-back mechanism between DMS and MBL CCN (Shaw et al., 1998) driven via cloud pumping of precursors aloft, followed by nucleation in the FT (Clarke et al., 1998a, 1999b), can provide a source of MBL CCN linked to DMS when the in-fluence of continental aerosol from long-range transport is low. Even so, our observations confirm arguments (Quinn and Bates, 2011) that the relation between MBL DMS emis-sion, nucleation, growth to CCN and their resulting entrain-ment is non-linear and far more complex than suggested by CLAW. This will depend upon the scavenging of preexisting aerosol surface area by cloud, the vigor and scale of convec-tion, processes that govern the availability of precursors in the convective region, conditions present at outflow altitudes (e.g., temperature, RH, surface area), time of day (e.g., OH production), mixing processes, pre-existing FT aerosol sur-face area, aging and coagulation during transport and subsi-dence to the MBL, etc.
of convection but rather a location some distance down-wind that may be thousands of kilometers away. The relative impact on boundary layer CCN in this distant region will depend upon the precursors that are available to influence growth to CCN sizes and/or what other aerosol and CCN are already present at this location (e.g., combustion aerosol).
The mean FT size distribution above the inversion for higher CO has a mode diameter of about a factor of 2 smaller (about an order of magnitude less mass per particle) than ob-served in combustion outflow near SA using these same in-struments (Moore II et al., 2003) and far smaller than sizes reported for Amazon biomass burning at the surface (Rissler et al., 2006; Soto-Garc´ıa et al., 2011). However, deep convec-tion over the Amazon has been found to loft aerosol to 10 km while scavenging about 90 % of the accumulation mode be-fore advection out over the Pacific (Andreae et al., 2001). Surface studies in the Venezuelan Andes near 4800 m also argue for active scavenging of BL aerosol lofted into the FT (Schmeissner et al., 2011). Even so, under high smoke con-ditions, suppression of precipitation has also been shown to allow smoke to be lofted through clouds to altitudes above 5 km without removal (Andreae et al., 2004).
In order to help identify whether scavenging of combus-tion is most consistent with PASE data, we consider excur-sions in CO above a nominal background of 50 ppbv as a conservative gas-phase tracer to compare with variations in aerosol properties. This ratio of aerosol property to CO-50 during PASE can then be compared with similar ratios closer to sources. Here, we consider the relation of aerosol light scattering to CO and the relation of CNhot to CO as we have made measurements of both near sources in South America. Using the PASE flight averages for light scattering above the inversion (not shown) we obtained a mean slope of scatter-ing (dominated by accumulation mode aerosol) vs. CO of 0.15 Mm−1ppbv−1with aR2of 0.85 (excluding RF06). This
is about 10 to 20 % of the slope we have obtained on various experiments (Clarke and Kapustin, 2010) near combustion sources. In addition, our recent unpublished data for biomass burning aerosol off the coast of South America during VO-CALS have values near 1 Mm−1ppbv−1. If we account for the slow destruction of CO during transport, the mean slope for PASE would be even lower. Hence, our data is consistent with most CO layers above the inversion being preferentially scavenged of larger aerosol during deep convection near their source (e.g., Fig. 5b). A similar conclusion is reached if we compare the relation of CNhot to CO (e.g., Fig. 7a). These show about a factor of 4–5 reduction in the ratio of CNhot to CO near sources and consistent with similar conclusions for high altitude combustion plumes off SA based on com-parisons of CNhot with ozone (Moore II et al., 2003).
Scavenged combustion plumes in the FT over CI during biomass burning season were not well characterized chemi-cally but measurements over the Amazon at this time of year show that organic carbon dominates aerosol mass. Over half of it is volatile upon heating to 360◦C and largely water
sol-uble (Soto-Garc´ıa et al., 2011). Even greater OC fractions were observed in the wet season (Gunthe et al., 2009) and both periods reveal a larger OC fraction (up to 90 %) in the Aitken size range. These were argued to be effective CCN but with a reduced hygroscopicity parameter,κ, of 0.1 at 50 nm
compared to 0.2 at 200 nm. Although evidence of nucleation has been seen at higher altitudes above the Amazon, low SO2 and sulfuric acid production cannot explain the observed rate of growth of these aerosols, suggesting biogenic volatile or-ganic carbon probably plays a role (e.g., Martin et al., 2010, and references therein). Consequently, it is likely that the cloud-scavenged combustion aerosol seen aloft during PASE is enhanced in OC until entrained into the MBL where gas to particle conversion will increase the relative sulfate fraction. We argue from Table 1 that of the mean CCN.2 of 192 cm−3 in the MBL during PASE, approximately 125 cm−3 (about 65 %) were entrained as CCN.2 from the FT and about 15 cm−3 (about 10 %) were present as SSA. We also argued that about another 50 cm−3 (about 25 %) grew into sizes effective as CCN.2 in the MBL. It is clear that the surface area (Fig. 10c, d) and mass of these aerosols are strongly influenced by their growth in the MBL. The sur-face area plots and the size distribution changes evident in Fig. 10 show that most of the accumulated mass will oc-cur on sizes larger than the Hoppel minimum. Out-of-cloud growth rates for sub-CCN.2 sizes are calculated to be on the order of 10 nm day−1 and much slower for larger sizes. In this region of low precipitation, the Hoppel minimum indi-cates most growth is dominated by in-cloud processes (Simp-son et al., 2013) and by the uptake of sulfuric acid. Growth of sizes smaller than the Hoppel minimum into larger sizes is expected to be slow unless precipitation events scavenge most of the larger sizes.
Aerosol entrained from above the inversion (e.g., Figs. 1, 12) contribute sizes that can “fill in” the Hoppel min-imum (Clarke et al., 1996). Entrainment is expected to be near cloud top in the BuL, where they can readily activate and participate in heterogeneous growth processes. For es-timated entrainment rates of about 0.5 cm s−1(Clarke et al., 1996; Conley et al., 2009), the air in the MBL can be di-luted by a factor of 2 in about 2 days. Hence, this process can be an effective way to resupply CCN.2 directly into the Hoppel minimum size range in addition to or even without growth of smaller sizes in the MBL. This increase of CCN in clean regions, where cloud properties are susceptible to small changes in aerosol, can have a disproportionate ef-fect upon the regional energy balance (Yang et al., 2012), one that is larger than from the first indirect effect (Twomey, 1974) alone. CCN entrained for higher CO cases can be 30 % higher than low CO cases.
making their detection by satellite difficult. For example, the strongest scattering layers on PASE were about 10 Mm−1 (Fig. 7c) and, if distributed over a typical 300 m layer, the contributions to AOD would be only 0.03 with most other layers being far less. Hence, detecting and modeling the im-pacts of these layers will provide a challenge.
12 Conclusions
Repeated flight patterns during PASE revealed the relation between FT and MBL aerosol in the equatorial Pacific and its variability. The presence of smaller sizes in the FT than the MBL and negligible contributions to sizes below 20 nm in the MBL are consistent with prior studies and confirm that nucle-ation in the MBL during PASE was not evident. Data strati-fied by CO less than and greater than 63 ppbv established the characteristics of aerosol layers associated with more natu-ral processes and those impacted by combustion. The result-ing mean profiles of altitude averaged distributions (Fig. 10) show that number is largely conserved through subsidence and entrainment. The mean profiles for both lower and higher CO reveal that the influence of combustion aerosol from South America increases the number and size of aerosol able to act as CCN once entrained into the MBL. This work con-firms that most of the MBL population is typically resupplied through entrainment from the FT rather than nucleation and growth in the MBL and that the CLAW hypothesis, as pro-posed, was not operational within the PASE MBL.
FT aerosol accounted for most of the CCN active in MBL clouds in this region and most were entrained at sizes al-ready effective as CCN. Concurrent flight-to-flight variations in these CCN in the FT, BuL and BL indicate the MBL con-centrations were in quasi-equilibrium with their FT source on a scale of about 3 days with both clean and combustion de-rived aerosol contributing significantly to CCN. Hence, CCN available in a region will often involve teleconnections be-tween the source and receptor regions that are governed by transport paths in the FT. Our PASE data demonstrates that combustion in South America can be a source for MBL CCN in the equatorial Pacific. At the same time, it also demon-strates that aerosol nucleated in equatorial ITCZ outflow not only provides a source of CCN for the equatorial region but can supply the FT over other diverse marine and continental regions via the Hadley cell, as evident in data between about 30◦
N and 30◦
S (Clarke and Kapustin, 2010).
Acknowledgements. This work was supported under grant #AGS-0628202 from the National Science Foundation. Without the sus-tained efforts of the late Alan Bandy (Drexel U.), both the PASE experiment and this work would not have been possible. The au-thors greatly appreciate the support and dedication exhibited by the pilots, managers, and support staff of NCAR’s Research Aviation Facility. This is SOEST contribution #8942.
Edited by: R. Krejci
References
Albrecht, B. A.: Aerosols, Cloud Microphysics, and Fractional Cloudiness, Science, 245, 1227–1230, doi:10.1126/science.245.4923.1227, 1989.
Andreae, M. O.: Correlation between cloud condensation nu-clei concentration and aerosol optical thickness in remote and polluted regions, Atmos. Chem. Phys., 9, 543–556, doi:10.5194/acp-9-543-2009, 2009.
Andreae, M. O., Artaxo, P., Fischer, H., Freitas, S. R., Gr´egoire, J. M., Hansel, A., Hoor, P., Kormann, R., Krejci, R., Lange, L., Lelieveld, J., Lindinger, W., Longo, K., Peters, W., de Reus, M., Scheeren, B., Silva Dias, M. A. F., Str¨om, J., van Velthofen, P. F. J., and Williams, J.: Transport of biomass burning smoke to the upper troposphere by deep convection in the equatorial region, Geophys. Res. Lett., 28, 951–954, doi:10.1029/2000GL012391, 2001.
Andreae, M. O., Rosenfeld, D., Artaxo, P., Costa, A. A., Frank, G. P., Longo, K. M., and Silva-Dias, M. A. F.: Smoking Rain Clouds over the Amazon, Science, 303, 1337–1342, doi:10.1126/science.1092779, 2004.
Bandy, A., Faloona, I. C., Blomquist, B. W., Huebert, B. J., Clarke, A. D., Howell, S. G., Mauldin, R. L., Cantrell, C. A., Hud-son, J. G., Heikes, B. G., Merrill, J. T., Wang, Y., O’Sullivan, D. W., Nadler, W., and Davis, D. D.: Pacific Atmospheric Sul-fur Experiment (PASE): Dynamics and chemistry of the South Pacific tropical trade wind regime, J. Atmos. Chem., 68, 5–25, doi:10.1007/s10874-012-9215-8, 2012.
Bandy, A. R., Thornton, D. C., Blomquist, B. W., Chen, S., Wade, T., Ianni, J., Mitchell, G. M., and Nadler, W.: Chemistry of dimethyl sulfide in the equatorial Pacific atmosphere, Geophys. Res. Lett., 23, 741–744, doi:10.1029/96GL00779, 1996. Browell, E. V., Fenn, M. A., Butler, C. F., Grant, W. B., Ismail,
S., Ferrare, R. A., Kooi, S. A., Brackett, V. G., Clayton, M. B., Avery, M. A., Barrick, J. D. W., Fuelberg, H. E., Maloney, J. C., Newell, R. E., Zhu, Y., Mahoney, M. J., Anderson, B. E., Blake, D. R., Brune, W. H., Heikes, B. G., Sachse, G. W., Singh, H. B., and Talbot, R. W.: Large-scale air mass characteristics observed over the remote tropical Pacific Ocean during March–April 1999: Results from PEM-Tropics B field experiment, J. Geophys. Res., 108, 8805, doi:10.1029/2002JD003290, 2003.
Charlson, R. J., Lovelockl, J. E., Andreaei, M. O., and Warren, S. G.: Oceanic phytoplankton, atmospheric sulphur, cloud albedo and climate, Nature, 326, 655–661, doi:10.1038/326655a0, 1987.
Chatfield, R. B. and Crutzen, P. J.: Are There Interactions of Iodine and Sulfur Species in Marine Air Photochemistry, J. Geophys. Res., 95, 22319–22341, doi:10.1029/JD095iD13p22319, 1990. Clarke, A. D.: Atmospheric Nuclei in the Pacific Midtroposphere:
Their Nature, Concentration, and Evolution, J. Geophys. Res., 98, 20633–20647, doi:10.1029/93JD00797, 1993.
Clarke, A. D. and Kapustin, V. N.: Hemispheric Aerosol Vertical Profiles: Anthropogenic Impacts on Optical Depth and Cloud Nuclei, Science, 329, 1488–1492, doi:10.1126/science.1188838, 2010.
diur-nal cycles and entrainment, Geophys. Res. Lett., 23, 733–736, doi:10.1029/96GL00778, 1996.
Clarke, A. D., Varner, J. L., Eisele, F., Mauldin, R. L., Tanner, D., and Litchy, M.: Particle production in the remote marine atmo-sphere: Cloud outflow and subsidence during ACE 1, J. Geophys. Res., 103, 16397–16409, doi:10.1029/97JD02987, 1998a. Clarke, A. D., Davis, D., Kapustin, V. N., Eisele, F., Chen, G.,
Paluch, I., Lenschow, D., Bandy, A. R., Thornton, D., Moore, K., L. Mauldin, Tanner, D., Litchy, M., Carroll, M. A., Collins, J., and Albercook, G.: Particle nucleation in the tropical bound-ary layer and its coupling to marine sulfur sources, Science, 282, 89–92, doi:10.1126/science.282.5386.89, 1998b.
Clarke, A. D., Kapustin, V. N., Eisele, F. L., Weber, R. J., and Mc-Murry, P. H.: Particle production near marine clouds: Sulfuric acid and predictions from classical binary nucleation, Geophys. Res. Lett., 26, 2425–2428, doi:10.1029/1999GL900438, 1999a. Clarke, A. D., Eisele, F., Kapustin, V. N., Moore, K., Tanner, D.,
Mauldin, L., Litchy, M., Lienert, B., Carroll, M. A., and Alber-cook, G.: Nucleation in the equatorial free troposphere: Favor-able environments during PEM-Tropics, J. Geophys. Res., 104, 5735–5744, doi:10.1029/98JD02303, 1999b.
Clarke, A. D., Shinozuka, Y., Kapustin, V. N., Howell, S. G., Hue-bert, B., Doherty, S., Anderson, T., Covert, D., Anderson, J., Hua, X., Moore II, K. G., McNaughton, C., Carmichael, G., and We-ber, R.: Size distributions and mixtures of dust and black carbon aerosol in Asian outflow: Physiochemistry and optical properties, J. Geophys. Res., 109, D15S09, doi:10.1029/2003JD004378, 2004.
Clarke, A. D., Owens, S. R., and Zhou, J.: An ultrafine sea-salt flux from breaking waves: Implications for cloud condensation nuclei in the remote marine atmosphere, J. Geophys. Res., 111, D06202, doi:10.1029/2005JD006565, 2006.
Conley, S. A., Faloona, I., Miller, G. H., Lenschow, D. H., Blomquist, B., and Bandy, A.: Closing the dimethyl sulfide bud-get in the tropical marine boundary layer during the Pacific At-mospheric Sulfur Experiment, Atmos. Chem. Phys., 9, 8745– 8756, doi:10.5194/acp-9-8745-2009, 2009.
Conley, S. A., Faloona, I. C., Lenschow, D. H., Campos, T., Heizer, C., Weinheimer, A., Cantrell, C. A., Mauldin III, R. L., Horn-brook, R. S., Pollack, I., and Bandy, A.: A complete dynami-cal ozone budget measured in the tropidynami-cal marine boundary layer during PASE, J. Atmos. Chem., 68, 55–70, doi:10.1007/s10874-011-9195-0, 2011.
Draxler, R. R.: HYSPLIT4 user’s guide, NOAA Tech. Memo ERL ARL-230, NOAA Air Resources Laboratory, Silver Spring, MD, 209 pp., http://www.arl.noaa.gov/documents/ reports/hysplit user guide.pdf, 1999.
Draxler, R. R. and Hess, G. D.: Description of the HYSPLIT 4 mod-eling system, NOAA Tech. Memo ERL ARL-224, NOAA Air Resources Laboratory, Silver Spring, MD, 27 pp., http://www. arl.noaa.gov/documents/reports/arl-224.pdf, 1997.
Draxler, R. R. and Hess, G. D.: An overview of the HYSPLIT 4 modeling system of trajectories, dispersion, and deposition, Aust. Meteor. Mag., 47, 295–308, 1998.
Faloona, I., Conley, S. A., Blomquist, B., Clarke, A. D., Kapustin, V. N., Howell, S. G., Lenschow, D. H., and Bandy, A. R.: Sul-fur dioxide in the tropical marine boundary layer: dry deposi-tion and heterogeneous oxidadeposi-tion observed during the Pacific Atmospheric Sulfur Experiment, J. Atmos. Chem., 63, 13–32,
doi:10.1007/s10874-010-9155-0, 2009.
Freitag, S., Clarke, A. D., Howell, S. G., Kapustin, V. N., Campos, T., Brekhovskikh, V. L., and Zhou, J.: Assimilating airborne gas and aerosol measurements into HYSPLIT: a visualization tool for simultaneous assessment of air mass history and back tra-jectory reliability, Atmos. Meas. Tech. Discuss., 6, 5345–5399, doi:10.5194/amtd-6-5345-2013, 2013.
Giglio, L., Randerson, J. T., van der Werf, G. R., Kasibhatla, P. S., Collatz, G. J., Morton, D. C., and DeFries, R. S.: Assess-ing variability and long-term trends in burned area by mergAssess-ing multiple satellite fire products, Biogeosciences, 7, 1171–1186, doi:10.5194/bg-7-1171-2010, 2010.
Gunthe, S. S., King, S. M., Rose, D., Chen, Q., Roldin, P., Farmer, D. K., Jimenez, J. L., Artaxo, P., Andreae, M. O., Martin, S. T., and P¨oschl, U.: Cloud condensation nuclei in pristine tropi-cal rainforest air of Amazonia: size-resolved measurements and modeling of atmospheric aerosol composition and CCN activity, Atmos. Chem. Phys., 9, 7551–7575, doi:10.5194/acp-9-7551-2009, 2009.
Hegg, D. A., Hobbs, P. V., Ferek, R. J., and Waggoner, A. P.: Measurements of Some Aerosol Properties Rele-vant to Radiative Forcing on the East-Coast of the United-States, J. Appl. Meteor., 34, 2306–2315, doi:10.1175/1520-0450(1995)034<2306:MOSAPR>2.0.CO;2, 1995.
Hoell, J. M., Davis, D. D., Liu, S. C., Newell, R., Shipham, M., Akimoto, H., McNeal, R. J., Bendura, R. J., and Drewry, J. W.: Pacific exploratory Mission-West A (PEM-West A): September October 1991, J. Geophys. Res., 101, 1641–1653, doi:10.1029/95JD00622, 1996.
Hoppel, W. A., Frick, G. M., Fitzgerald, J. W., and Larson, R. E.: Marine boundary layer measurements of new parti-cle formation and the effects nonprecipitating clouds have on aerosol size distribution, J. Geophys. Res., 99, 14443–14459, doi:10.1029/94JD00797, 1994.
Hudson, J. G. and Noble, S.: CCN and cloud droplet concentra-tions at a remote ocean site, Geophys. Res. Lett., 36, L13812, doi:10.1029/2009GL038465, 2009.
Hudson, J. G., Jha, V., and Noble, S.: Drizzle correla-tions with giant nuclei, Geophys. Res. Lett., 38, L05808, doi:10.1029/2010GL046207, 2011.
Huebert, B. J., Wylie, D. J., Zhuang, L., and Heath, J. A.: Produc-tion and loss of methanesulfonate and non-sea salt sulfate in the equatorial Pacific marine boundary layer, Geophys. Res. Lett., 23, 737–740, doi:10.1029/96GL00777, 1996.
Jensen, J. B. and Charlson, R. J.: On the efficiency of nucle-ation scavenging, Tellus B, 36, 367–375, doi:10.1111/j.1600-0889.1984.tb00255.x, 1984.
Kaufman, Y. J., Tanre, D., Holben, B. N., Mattoo, S., Remer, L. A., Eck, T. F., Vaughan, J., and Chatenet, B.: Aerosol radiative impact on spectral solar flux at the surface, derived from principal-plane sky measurements, J. Atmos. Sci., 59, 635–646, doi:10.1175/1520-0469(2002)059<0635:ARIOSS>2.0.CO;2, 2002.
Kim, J. H. and Newchurch, M. J.: Climatology and trends of tro-pospheric ozone over the eastern Pacific Ocean: The influences of biomass burning and tropospheric dynamics, Geophys. Res. Lett., 23, 3723–3726, doi:10.1029/96GL03615, 1996.