The ENTERPRISE DNA:
static and dynamic
digital
representation of organizations.
Roman Vladimirovich Trotsyuk
Dissertation presented as partial requirement for obtaining
the Master’s degree in Advanced Analytics
The ENTERPRISE DNA: static and dynamic digital representation of organizations.
Subtitle:
Roman Vladimirovich Trotsyuk
NOVA Information Management School
Instituto Superior de Estatística e Gestão de Informação
Universidade Nova de LisboaThe ENTERPRISE DNA: static and dynamic digital representation of
organizations
by
Roman Vladimirovich Trotsyuk
Dissertation presented as partial requirement for obtaining the Master’s degree in Advanced Analytics
Advisor: Vítor Manuel Pereira Duarte dos Santos, PhD
DEDICATION
I dedicate this master thesis to my wife and mother. The support of my family during this two-years NOVA IMS educational journey made my dream come true.
ACKNOWLEDGEMENTS
I would like to express appreciation to Professor Leonardo Vanneschi. for mMy interest in the topic of Evolutionary Computation , that emerged by virtue of his gorgeous excellent lectures, and related subjects included in the study plan for Advanced Analytics master program. This His passion, theoretical knowledge, and hands-on experience, acquired during the study, inspired me to learn Genetic Algorithms further.
I also want to thank Professor Vitor Santos for suggesting this engaging topic, and supervising my research brilliant and very interesting topic proposed for this master. His idea of applying evolutionary computation for modelling the business entities’ behavior, and considering organizations as living organisms and in a competitive environment, as is in a nature, is very innovative and perspective due the complexity and the novelty of the subject. His patience, involvement, tips, availability for frequent meetings and spent his previous time helped me to perform this research.
Finally, I want to express appreciation for NOVA IMS Professors Mauro Castelli and Flávio Pinheiro for their very warm and productive feedback interview that brought a lot of valuable insights, ideas and remarks that helped me to improve the paper.
ABSTRACT
The contemporary business environment become is becoming more complex and fast- changing during processes of businessdue to globalization, technical progress, competition, accumulation and sharing of knowledge. Companies arise, grow, exchange ideas, merge, interact with each other and adapt to the market environment, and, finally, some of them disappear. Their behavior determined by sophisticated laws, thatlaws that cannot be discovered in isolation, because existence of each entity depends on its specific, internal properties and the interplay with other participants of the market. In a way, The thecomplex interactions and enterprise life cycle reminds resembles the life of species in the nature and thus, the mimic of biological entities can be applied as a modelling tool for to better understanding how a company works and what makes it successful.
The broad purpose of this work is to create a foundation for applying Artificial Life simulation for to business analysis. Artificial Life is a concept that allow to mimics biological evolution and behavior of living creatures for in modelling complex systems, forming a specific environment with interacting and evolving agents. Thus, the Artificial Life can be applied for to the analysis of the enterprise on the competitive market for studying its success factors. Possible combination of factors and their value are company- specific and represent properties that affects performance of the organization. The enterprises can exchange their characteristics with others by means of stuff swap, consulting, merging etc., acquiring best practices and becoming more adapted for specific challenges. The main goal of this paper is the to research and suggestion exploreof such characteristics and their representation, which, by analogy with biology, will constitute Enterprise DNA.
In this thesis, the digital representation of the Enterprise DNA inspired by the biological notion of living organism’s DNA is proposed. As the foundation of important company’s features, the Enterprise Architecture concept was applied. Despite the fact, that it was previously used for an Information Technology architecture, this discipline was has evolved to more broad science and became a tool for describing the business architecture of the a company. The Zachman Enterprise Architecture framework is used as a basis of enterprise representation. Regarding this tool, the artifacts for phenotype representation are proposed and then, their digital XML representation found. The DNA digital representation model (genotype) for artifacts is proposed, which can be used for further evaluation of fitness of the specific company to the competitive environment on the specific market. This representation can be used by means of Genetic Algorithm for further implementation of Artificial Life simulation on real company’s data. The evaluation by the experts showed perspectivityperspective of the idea of applying ALife modelling for solving business problems. As a result, some ideas for model improvement are discovered.
Artificial Life, Corporate DNA, Competitive Strategy, Enterprise Architecture, Enterprise DNA, Evolutionary Algorithms, Genetic Algorithms, GA Representation
INDEX
1.
INTRODUCTION ... 1
1.1.
Background and problem identification... 1
1.2.
Study relevance and justification ... 2
1.3.
Research objectives ... 2
2.
THEORETICAL FRAMEWORK ... 3
2.1.
Enterprises ... 3
2.1.1
Typology of enterprises... 3
2.1.2
Enterprise’s architecture ... 4
2.1.3
Enterprise Architecture frameworks... 5
2.1.4
Zachman framework ... 5
2.1.5
Artefacts for the representation of Enterprise aspects ... 10
2.2.
Artificial Life ...
2120
2.2.1.
Concepts ...
2120
2.2.2.
A brief history of Artificial Life ...
2221
2.2.3.
Genetic algorithms ...
2322
3.
METHODOLOGY... 26
3.1. Design Science Research ... 26
3.2. Research Strategy ... 27
4.
RESULTS AND DISCUSSION ... 29
4.1.
Assumptions ... 29
4.1.1.
Typology of enterprises as Enterprise DNA Gene ... 29
4.1.2.
Zachman framework as a foundation for building Enterprise DNA Genes.. 29
4.2.
Model of the DNA representation of a generic enterprises ... 30
4.3.
Validation... 37
4.4.
Discussion ... 37
5.
CONCLUSIONS ... 40
5.1. Synthesis of the developed work ... 40
5.2.
Limitations ... 42
5.3.
Future works ... 42
5.3.1.
Development of DNA representation ... 42
BIBLIOGRAPHY... 44
LIST OF FIGURES
Figure 2.1 Enterprise Architecture as a management tool (Lankhorst, 2017) ...5
Figure 2.2 The Zachman framework, adapted from (Lankhorst, 2017)...6
Figure 2.3 Zachman Framework v3.0 for Enterprise Architecture (Zachman, 2011) ...7
Figure 2.4 Zachman Framework artefacts (Zachman, 2011) ...10
Figure 2.5 Possible modelling languages for Zachman framework (Noran, 2003) ...11
Figure 2.6 The concept of Entity and Relationship (Chen, 2002)...11
Figure 2.7 An ER diagram example (Chen, 1976)...12
Figure 2.8 Mapping relationship from ER to XML (Sung & Kang, 2007) ...12
Figure 2.9 Simple BPMN process example (Dumas, Reijers, La Rosa, & Mendling, 2015) ...13
Figure 2.10 Structure of the BPMN format (Dumas, Reijers, La Rosa, & Mendling, 2015) ...13
Figure 2.11 BPMN applyed to EA framework (Espadas, Romero, Concha, & Molina, 2008) ...14
Figure 2.12 A comparison of XPDL with other standards (van der Aalst, 2004)...
1514
Figure 2.13 Example of XPDL derived from BPMN (WfMC, 2012). ...15
Figure 2.14 Supply chain topology network graph (Chatfield, Harrison, & Hayya, 2003). ...16
Figure 2.15 Organizational chart example (Legaard & Bindslev, 2006) . ...17
Figure 2.16 Example of XML format for Org Chart modelling (Bulajic & Filipovic, 2012)...
1817
Figure 2.17 Gantt Chart example (Dale, Churcher, & Irwin, 2005). ...18
Figure 2.18 Gantt Chart XML representation (Dale, Churcher, & Irwin, 2005) ...
1918
Figure 2.19 Balanced Scorecards performance measures (Kaplan & Norton, 1992). ...
2019
Figure 2.20 Excerpt of the BSC XML example (McGregor, 2003). ...20
Figure 2.21 Generic Genetic Algorithm workflow. ...24
Figure 2.22 Discrete (integer) chromosome representation example. ...25
Figure 3.1 DSR Knowledge Contribution Framework (Vaishnavi, Kuechler, & Petter, 2017) ...26
Figure 4.1 Outline of Enterprise’s DNA representation ...30
Figure 4.2 Proposed Enterprise’s DNA structure ...31
Figure 4.3 Dictionary implementation. ...31
Figure 4.4 Enterprise ID structure. ...31
Figure 4.5 Enterprise typology sub DNA representation. ...32
Figure 4.6 Data sub DNA representation. ...32
Figure 4.7 Data gene relation to ER diagrams XML dictionary. ...32
Figure 4.8 Function sub DNA representation...33
Figure 4.10 Network sub DNA representation...33
Figure 4.11 Network gene relation to Network Graph diagrams XML dictionary. ...34
Figure 4.12 People sub DNA representation...34
Figure 4.13 People gene relation to XML Organizational Chart diagrams XML dictionary. ...34
Figure 4.14 Time sub DNA representation...35
Figure 4.15 Time gene relation to PMXML Gantt Charts dictionary. ...35
Figure 4.16 Motivation sub DNA representation...35
Figure 4.17 Motivation gene relation to BSC XML dictiona ry...36
LIST OF TABLES
Table 2.1 Possbile characters of organization taxonomy (McKelvey, 1978) ...3
Table 3.1 Design science research contribution types (Gregor & Hevner, 2013) ...26
Table 3.2 Publication schema for a DSR Study (Gregor & Hevner, 2013) ...27
Table 3.3 Research steps ...28
LIST OF ABBREVIATIONS AND ACRONYMS
AI Artificial Intelligence
APQC American Productivity & Quality Center ALIfe Artificial life
BPEL4WS Business Process Execution Language for Web Services BPM Business Process Modeling
BPML Business Process Modeling Language BPMN Business Process Model and Notation BPMS Business Process Management System BSC Balanced Scorecard
CRM Customer Relationship Management DNA Deoxyribonucleic acid
DSR Design Science Research EA Enterprise Architecture
ER Entity-Relationship Diagram ERM Entity-Relationship Model
eTOM Enhanced Telecom Operations Map FEA Federal Enterprise Architecture GA Genetic Algorithm
IDEF 3 Integrated DEFinition for Process Description Capture Method ITIL Information Technology Infrastructure Library
MU Mutation genetic operator
PEST Political, Economic, Socio-cultural and Technological analysis PMXML Project Management eXtensible Markup Language
SCML Supply Chain eXtensible Markup Language TOGAF The Open Group Architecture Framework
UML Unified Modelling Language
UNSTAT United Nations Statistical Comission W3C The World Wide Web Consortium WSCI Web Services Choreography Interface WSFL Web Services Flow Language
XLANG Web Services for Business Process Design language (Microsoft) XML eXtensible Markup Language
XO Crossover genetic operator
XPDL The XML Process Definition Language ZF Zachman Framework
1. INTRODUCTION
We live in the fast-changed era when environment, people, companies and other entities are changing with tremendous pace, become and are becoming more complex and less understandable. Interactions of companies within environments they operate became has become more and more complex and it is hard to create a particular to model that can describe an enterprise, its interactions with competitors and market where it is presented.
The way the enterprises operate, when they born, grow up, interact and compete, survive and die remind is similar to the way as natural organisms behave. Thus, we can see an analogy of companies with existing living species that live by laws of evolution and natural selection. Technology transfers, stuff exchange or even reading business books by mangers and inviting consultants leads to some specific knowledge, ideas, structure, systems etc. interchange that reminds the exchange of genes when the living species mate.
Company’s internal efforts as a in discovering a new strategy, business processes reengineering, and other internal improvements lead to better performance and survival on the market. We can consider such changes, not inspired by external knowledge but generated inside the enterprise as biological mutations. Some of them will improve company’s market position, and some we lead to failure. Only markets and competition will showcan determine which of them were positive.
Thus, the idea toof mimic of the biological behavior of the living organisms, their natural selection and adaptation to specific environment with respect to real business ventures arises. Considering each company as an individual with specific set of genes – good and bad, we can simulate the life cycle of the organization, - its competition with rivals, head hunting, development, used strategy and other efforts of managers that lead the company to thea specific position on the market, and its success.
When we mimic an organism (or companies) and we can compare some properties. Number of legs, or color, size, speed or brain size – all of these are characteristics with describes specific spicy specie and can be extended (with adaptation) to the business entity. Thus, every organization as a living organism have some visible signs, that are defined by its phenotype and their DNA encoding that is represented by special code, or gene.
1.1. B
ACKGROUND AND PROBLEM IDENTIFICATIONThe main idea is to mimic company’s behavior by means of biologically inspired simulation models. Such models usually are called Artificial Life simulation (Langton, 1989) by analogy with real life, and was developed for modelling complex, evolutional systems. The ALIfe conception implies modelling of research entities by means of Genetic Algorithms (Holland, 1975), which can model every individual within a specific population, their interaction, mating, mutations and adaptation to the environment. The fitness function defines how an individual is fits to the specific conditions and is if there it is a success or failure. The population is evolving, exchanges its genes, mutates and adopts to the environment and by law of natural selection - only the best individuals survive. Best means the fitness to the environment.
Although the author have has some industry experience relevant to the topic, more scientific and systematic approach must be used. Thus, the idea is not to create Enterprise DNA “from head” but use some widely used framework, which will simplify the design and collecting the data in the future. The Enterprise Architecture frameworks are considering as a basement for projecting the Enterprise’s DNA structure.
The problem is the modelling of the enterprises and their interactions by analogy with living species for better understanding of how they behave, which and what components make them successful. This kind of modelling is called Artificial Life simulation and is usually implemented by means of evolutionary algorithms. Genetic algorithms implementation implies three main steps:
▪ Development of genotype representation of the individual (representation problem) ▪ Design of fitness function, that will evaluate successfulness of the individual
▪ Simulation by means of Artificial Life algorithm
Thus, the representation problem is the first on the way to implement evolutionary competition model of the enterprises, and, thus, is the objective of this research. Other steps considered as a suggestion for further development of the topic. The representation of the individual for Genetic Algorithm is not straightforward and depends on the goals, so it is not a trivial task and can be implemented by several ways. The possible implementations are discussed in literature review part of this work.
1.2. S
TUDY RELEVANCE AND JUSTIFICATIONAs far as we are aware, there were no similar researches proposed before. The novelty is in the applying Artificial Life simulations to the business competitiveness. Another innovation proposed are is the representation of the enterprise by its DNA like a living organism and use the Enterprise Architecture framework for thatis used for that purpose the Enterprise Architecture framework because it is a modern approach to describe the business entity. Each company existing mimic living organisms with their DNA – specific structure and properties sets, behavior, reactions and relevance to the environment. Thus, the idea of application of Alife simulation to the business competitiveness looks promising.
This work is theoretical one and its evaluation is a challenge. For this purpose, experts in evolutionary algorithms should be attracted for validation of developed model. Further works will show in practice value of ideas proposed.
1.3. R
ESEARCH OBJECTIVESThe goal of this work is to propose the representation of Enterprise’s DNA that can be used for further modelling of organizations by means of for Artificial Life simulation. This representation must cover the main aspects of the company and reflex reflect its constitution. Thus, the research objective is the design of Enterprise’s DNA.
The representation problem is one of the main challenges when Genetic Algorithms are applied. There are several kinds of genome representations and their choice can affect results of simulation. The main objective is to find such representation that can be used for Artificial Life simulation with respect to proposed fitness function.
As a foundation, for individual representation with Enterprise Architecture frameworks are considered, which are used for description of company’s business architecture. The idea is new regarding goals stated, nonetheless, it seems very promising to use this approach for achieving better results in understanding how business operates, what makes it better and what “Genes” lead to success.
2. THEORETICAL FRAMEWORK
2.1. E
NTERPRISESThe main goal of this work is to create a basement in finding features of the enterprise that distinguishes it from others. For this purpose, companies can be seen from points of view: internal and external. From external viewpoint there are number of classifications of enterprises that discern them by different typology. Belonging to each class or group carry some specific characteristic. From internal point of view companies differ by their Enterprise Architecture
.
2.1.1 Typology of enterprises
There are number of enterprise classifications that examine companies from different sides and serving for specific purposes. There are two main groups: Academic approach and applied International Organizations and other institutions classifications. Scientific study usually concentrated on finding general methods and frameworks for classifications while other institutes develop taxonomy for use for their operational purposes (Governments, Banks, Statistical agencies etc.)
2.1.1.1 Academic Approach
Researchers are working on the development of scientific methods of organizations classification. The 10 guidelines for the Empirical Classification of Organizations for exploring of multivariate approaches were
proposed by Bill McKelvey (McKelvey, 1975). In a further newer paper, he proposed characters for organizations typology (see Table 2.1) based on work (Mayr, 1969) implies finding similarities and differences among organization applying biological taxonomy methods (McKelvey, 1978)
Other work (Rich, 1992) discusses empirical, theoretical and evolutionary perspectives of organizations typology, hierarchical taxonomy, and defines methodological consistency of classification systems.
2.1.1.2 International and other institutions classifications
Globalization of companies, international trade and capital movement requires similar view on organization for different stakeholders that lead to development special classification by many institutions. Some of meaningful examples are showed below.
United Nations developed its “International Standard Industrial Classification of All Economic Activities” (United Nations, 2008) to compile, generate and analyse a wide range of economic, social and environmental data and information on which States Members of the United Nations draw to review common problems and to take stock of policy options; to facilitate the negotiations of Member States in many intergovernmental bodies on joint courses of action to address ongoing or emerging global challenges; and to advise interested Governments on the ways and means of translating policy frameworks developed in United Nations conferences and summits into programmes at the country level and, through technical assistance, helps build national capacities. EuropianEuropean Comission agency Eurostat provides own standard “NACE Rev. 2 Statistical classifiation of economic activites in the European Community” (European Communities, 2008) which “is a basic element of the international integrated system of economic classifiations, which is based on classifiations of the UN Statistical Commission (UNSTAT), Eurostat as well as national classifications; all of them strongly related each to the others, allowing the comparability of economic statistics produced worldwide by diffrent institutions ”.
In 1999, Standard & Poor’s and MSCI/Barra jointly developed the Global Industry Classification Standard (GICS) (Standard & Poor, 2006) to establish a global standard for categorizing companies into sectors and industries. “The GICS methodology has been commonly accepted as an industry analysis framework for investment research, portfolio management and asset allocation which defines 10 Sectors, 24 Industry Groups, 67 Industries and 147 Sub-Industries. GICS was developed in response to the global financial community’s need for one complete, consistent set of global sector and industry definitions, thereby enabling asset owners, asset managers and investment research specialists to make seamless company, sector and industry comparisons across countries, regions, and lobally” (Standard & Poor, 2006).
London Stock Exchange Group provides its own classification Benchmark (FTSE Russell, 2008) which “is a detailed and comprehensive structure for sector and industry analysis, facilitating the comparison of companies across four levels of classification and national boundaries. The classification system allocates companies to the Subsector whose definition closely describes the nature of its business as determined from the source of its revenue or the source of the majority of its revenue where available”.
2.1.2 Enterprise’s architecture
The subject of these research is the Enterprise’s DNA which is composed from two parts: tangible and intangible. If we will draw an analogy with the computers that are “hardware” and “software”. “Hardware” are assets of the company, including human capital, “software” is knowledge and culture. In the literature under
term “Corporate DNA” most authors understand knowledge and the term “Corporate Architecture” means assets and their structure. For our purposes we have to consider both domains.
In Figure 2.1 enterprise architecture is positioned within the context of managing the enterprise. At the top of this pyramid, we see the mission of the enterprise: why does it exist? The vision states its ‘image of the future’ 8 Introduction to Enterprise Architecture and the values the enterprise holds. Next there is its strategy, which states the route the enterprise will take in achieving this mission and vision. This is translated int o concrete goals that give direction and provide the milestones in executing the strategy. Translating those goals into concrete changes to the daily operations of the company is where enterprise architecture comes into play. It offers a holistic perspective of the current and future operations, and on the actions that should be taken to achieve the company’s goals. Next to its architecture, which could be viewed as the ‘hard’ part of the company, the ‘soft’ part, its culture, is formed by its people and le adership, and is of equal if not higher importance in achieving these goals. Finally, of course, we see the enterprise’s daily operations, which are governed by the pyramid (Lankhorst, 2017).
Figure 2.1 Enterprise Architecture as a management tool (Lankhorst, 2017)
2.1.3 Enterprise Architecture frameworks
The Enterprise Architecture is a “hardware” part of the company, which includes specific artifacts which that
are defined by used EA framework. There are many frameworks developed for Enterprise Architecture modelling. Today, four methods are dominant: Zachman's structure for enterprise architecture, TOGAF (The Open Group Architecture Framework), Federal Organization Architecture (FEA) and Methodology Gartner (formerly called Meta Framework).
2.1.4 Zachman framework
Significant contribution to the development of the concept of the enterprise architecture was made by J. Zachman (John A. Zachman). Since the publication of the “Framework for Information Systems Architecture” (Zachman, 1987) has become the basis on which many organizations create their own methods of describing the information enterprise infrastructure. Since 1987, when it was proposed the first version of this model was proposed, extended subsequently in the works of 1992-96 (Zachman & Sowa, 1992), it was used quite often by
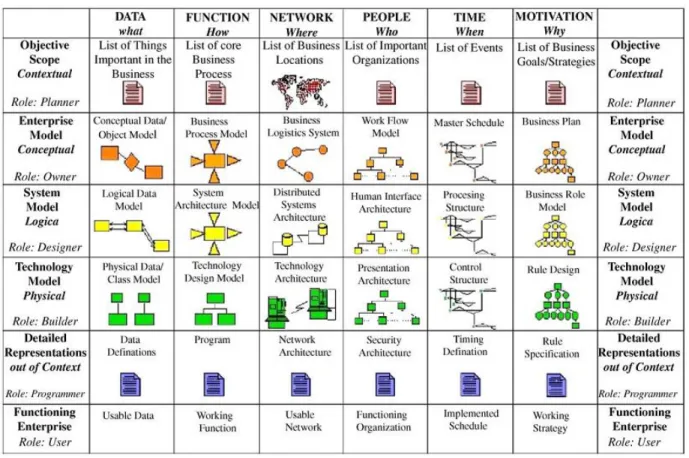
world’s largest corporations such as General Motors, Bank of America and others. The Zachman model also served as the basis for creating a range of other techniques and models for enterprise architecture descriptions. Zachman’s model is based on the discipline of the classical architecture, structure and provides , a common vocabulary and perspective set or structures (framework) to describe the modern complex educational systems. For convenience of description, Zachman suggested the so-called ‘Zachman Framework for Enterprise Architecture. The model has two main objectives: on the one hand, logically break the entire description of the Architecture into separate sections to simplify their formation and on the other hand, to ensure that the architecture review from selected points of view or according to abstraction level (Lankhorst, 2017).
At the time when the works of Zachman were published, approach to the formation of the description of the system used the concept of “life cycle”, including stages such as planning, analyzing, designing development, documentation, implementation and industrial exploitation. At each of these stages are considered issues associated with both system functions and data. Zachman suggested instead of the traditional approach associated with consideration of certain aspects of the system at different stages use the consideration of systems from various perspectives (points of view) (Lankhorst, 2017).
Historically, the Zachman model was first created for IT systems. This approach in the subsequent work was generalized to consider not only IT systems, but also to describe enterprises in general, so the proposed model can be used as a tool for describing of complex production systems of any type. The basic idea is to ensure ability to consistently describe each individual aspect of a system in coordination with others. For any a complex system the total nu0mber of connections, conditions and rules usually exceeds the capacity for simultaneous consideration. At the same time, separated, in isolation from others, consideration of every aspect of the system most often leads to non-optimal solutions, both in terms of performance and cost of implementation (Lankhorst, 2017).
The actual model is presented in the form of a table with five rows and six columns, which is shown in Figure 2.2. Note that there are five lines in the model, simply displayed in the figure, the sixth line corresponds to the level
Figure 2.2 The Zachman framework, adapted from (Lankhorst, 2017)
of description architecture, and the level of the operating system or enterprise the whole event (Lankhorst, 2017).
The framework (Figure 2.2) in its most simple form depicts the design artefacts that constitute the intersection between the roles in the design process, that is, owner, designer and builder, and the produ ct abstractions, that is, what (material) it is made of, how (process) it works and where (geometry) the components are relative to one another. Empirically, in the older disciplines, some other ‘artefacts’ were observable that were being used for scoping and for implementation purposes. These roles are somewhat arbitrarily labelled planner and subcontractor and are included in the framework graphic that is commonly exhibited.(Zachman & Sowa, 1992) From the very inception of the framework, some other product abstractions were known to exist because it was obvious that in addition to what, how, and where, a complete description would necessarily have to include the remaining primitive interrogatives: who, when and why. These three additional interrogatives would be manifest as three additional columns of models that, in the case of enterprises, would depict: who does what work, when do things happen, and why are various choices made (Lankhorst, 2017)?
Advantages of the Zachman framework (ZF) are that it is easy to understand, it addresses the enterprise entirely, and it is defined independently of tools or methodologies, and any issues can be mapped against it to understand where they fit. An important drawback is the large number of cells, which is an obstacle for the practical applicability of the framework. Also, the relations between the dif ferent cells are not that well specified. Notwithstanding these drawbacks, Zachman is to be credited with providing the first comprehensive framework for enterprise architecture, and his work is still widely used. (Lankhorst, 2017)
To correct using of inconsistent terminology and clear up several misconceptions and misunderstandings that have occurred over the years with the original version of the Framework (Version 1 .0) Zachman continued to work on his framework and created new versions: v2 (2008) and v3 (2011), see Figure 2.3 (Zachman, 2011).
2.1.4.1 Aspects of Zachman framework
“What”
The first column answers the question “WHAT?” and defines data used in the system. At the top level it is enough to put a simple listing of the main objects used by business. At the second level, these objects are combined into a high-level semantic model and usually described written down as an entity-relationship diagram (E-R diagram) with a reflection of the main links and the most significant business-constraints. At the third level, this model is reduced to normalized form, all attributes and keys are defined. The fourth level is a physical model of data in the system (in the object-oriented approach - class hierarchy). The next level contains a description of data management language model for the tables, new class libraries and database. Finally, the last level can describe the actual data sets, including characteristics such as access logs, the size of the actual disk space, query statistics, etc. (Lankhorst, 2017)
“How”
The function column (the answer to the question “HOW?”) Is intended for detailed descriptions how the Mission Enterprise is implemented at the level of individual operations. On the first level it will be a simple enumeration of business-processes. The second level will contain del business processes, which is subsequently detailed as data operations and application architecture (level 3), class methods (level 4), program code (level 5) and, finally, executable code. Starting from the 4th level, consideration is no longer within the Enterprise as a whole, but on individual subsystems or applications. (Lankhorst, 2017)
“Where”
The next column (the question “WHERE?”) defines the space distribution of system components and network organization. At the level of business planning, there is enough to define the location of all production facilities. At the next level, these objects are combined into a model with links, characterizing the interaction between entities – whether it is information or delivery of goods. At the third level of the system architecture is a binding of information system components to the network nodes. The fourth level defines a physical implementation in terms of hardware platforms, system software, and intermediate level tools (the so-called "Middleware") used to integrate various components of information systems. At the fifth level are defined protocols and specification of communication channels. Last level describes functioning of the implemented network. (Lankhorst, 2017)
“Who”
The column of the table that answers the question "WHO?" are participants of the process. At the business planning level here is showed the list of enterprise departments and their functions. The next level is organizational chart and common information security requirements. Next are defined participants of business processes and their roles, user interface requirements and access to individual objects, their physical implementation at the level of code or statements for access to tables in the DBMS. The last level describes trained users of system. (Lankhorst, 2017)
“When”
The fifth column answers the question “WHEN?” And defines time characteristics of business processes and system execution. Detailing is done from top to bottom, starting from schedule (level 1) and the main parameters of the business processes execution - for example, requirements for the time of the end of transaction (level 2). Third level is determined by events that cause a change in information objects and the initiation of operations. At the next level, these events are broadcasted as program calls (triggers) or transmitted messages. Fifth level determines the physical implementation of events processing. Finally, on the 6th level - the actual history of system functioning. (Lankhorst, 2017)
“Why”
The last column “WHY?” determines motivation and sets the paths of transition from business tasks to the requirements and elements of information systems. The starting point is the business strategy, which is consequentially translated into a business plan, then into rules and restrictions for the implementation of business processes, and at level 4, to relevant applications required for the composition of information systems and, subsequently, in their physical implementation. (Lankhorst, 2017)
2.1.4.2 Views (Perspectives) of Zachman framework
Scope Context (Executive Perspective)
This row shows Scope Context perspective – the big picture of desired architecture made by Business Context Planners - the executives or investors (Zachman, 2011) to estimate scope of the business (products, services, clients and business locations, strategy etc. (Bogomolova, 2016)), what it would cost and how it would perform. In analogy with classical architecture we can say it would be size, spatial relationships and basic purpose of the final structure (Zachman & Sowa, 1992).
Business Concepts (Director Perspective)
On this row is depicted the business concepts on the level of directors and process owners which correspond to business model, which constitutes design and shows business entities (organizational structure (Bogomolova, 2016)) and processes and how they interact (Zachman, 2011). In analogy with classical architecture it is architect’s drawings that depict final building from the perspective of the owner (Zachman & Sowa, 1992).
System Logic (Architect Perspective)
This row shows system logic from the Architect Perspective (Zachman, 2011). Here are a business processes are already described in terms of information systems, including data elements, their transformation rules and processing to perform previous level 2 business-functions (Bogomolova, 2016). In analogy with classical architecture it is the architect’s plans that are the translations of the drawings into detailed plan (Zachman & Sowa, 1992).
Technology Physics (Engineer Perspective)
At level 4 there is the Engineer Perspective addresses Technology Physics for Technology Specification Models (Zachman, 2011). The builders plan corresponding to the technology model, which must adapt the information system model to the details of the programming languages, I/O devices and other technology. In analogy with
classical architecture it is builder’s plan drown from architect’s plan to consider contractor constrains of tools, technology and materials. (Zachman & Sowa, 1992)
Tool Components (Technician Perspective)
Fifth row of the framework is the Technician Perspective correspond to the detailed specification that are given to programmers (or other technicians) without being concerned with the overall context and structure of the system. In analogy with classical architecture those are the subcontractor’s shop plans that specify the details or parts of subsections. (Zachman & Sowa, 1992)
Operations Instances (Business Perspective)
The last, sixth level, which is not presented in early versions of the framework (Zachman, 2011) describes the working system. At this level can described such objects as instructions for working with the system, the actual databases data from the end user point of view (Bogomolova, 2016).
2.1.5 Artefacts for the representation of Enterprise aspects
All six aspects of the Zachman enterprise framework can be represented with specific for each column artefacts. Some of possible artefacts (see Figure 2.4) but without specific standard recommendations were show by Zachman in his framework (Zachman, 2011)
Figure 2.4 Zachman Framework artefacts (Zachman, 2011)
For purposes of this work we will consider Conceptual perspective of Zachman framework. The justification of this choice is the following: Scope level is too general and some enterprises can be described equally though there are different that we can see only on following layers. Logical and more detail perspective are too specific
and can even distinguish in the same company. Moreover, a very detailed description can make representation very complex, company specific and thus, become an incomparable model.
More specifically aArtefacts for implementation of Zachman framework were proposed later (Noran, 2003). Such diversity of standards was explained by Noran: “Today, no single existing modelling language by itself is capable of modelling all necessary aspects of an enterprise” (Noran, 2003). Possible modelling languages to populate Zachman’s modelling framework are shown in the Figure 2.5. For the Conceptual level there were considered following standards: WHAT – ERM, HOW – IDEF3, WHERE – Graph, WHO – Org Chart, WHEN - Gantt chart, WHY – Structured English.
Figure 2.5 Possible modelling languages for Zachman framework (Noran, 2003)
2.1.5.1 Artifacts for data representation
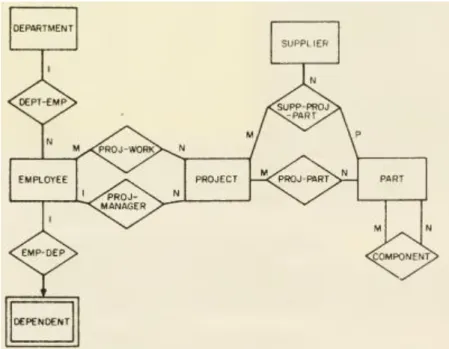
We can represent our What (Data) perspective of Zachman Framework with ER diagrams (Noran, 2003). Entity-relationship concept was applied for data modeling (Chen, 2002) which explains how data entities interact (relate) with each other (see Figure 2.6).
ER diagrams were proposed by Piter Chen (Chen, 1976) which became a standard for database development. They show how normalized data tables corresponds by key and are an outline of the database. We can model any structures data using Entity-Relationship diagram models. This representation is perceived by people very easily and is proliferated widely, so it can be used for representation of Conceptual perspective of Data aspect of Zachman framework. An ER diagram example for analysis of information in a manufacturing firm is depicted on the Figure 2.7.
Figure 2.7 An ER diagram example (Chen, 1976)
For the purposes of this paper, we not only have to consider only the representation designed for human, but
also one consigned for computers. For this, W3C (with Peter Chen as one of participants) (W3C, 1999a) proposed the XML format (Chen, 2002) for digital ER diagram representation. There wereThey proposed several works for converting ER to XML (Sung & Kang, 2007), (Franceschet M., Gubiani D., Montanari A., Piazza C, 2009).,Tthus we can make representationof our Data perspective that for a computer can to treat (see Figure 2.8).
2.1.5.2 . Artifacts for representation of functions at the process level
The second perspective of Zachman Framework is How (Function). It represents business processes workflow. For a Conceptual aspect, it (Noran, 2003) proposed proposes the IDEF3 standard, but now it becomewhich is now obsolete, and not supported by many tools. On the contraryHowever, the BPMN 2.0 standard (Object Management Group (OMG), 2014) is widely used and implemented in many businesses process modeling (BPM) and business process management system (BPMS) tools such as SAP, Bizagi, Business Studio, ELMA etc. BPMN model graphically depicts business process workflow in intuitive manner as depicted on the Figure 2.9. Model can be executed by BPMS system following all build-in logic (Dumas, Reijers, La Rosa, & Mendling, 2015).
Figure 2.9 Simple BPMN process example (Dumas, Reijers, La Rosa, & Mendling, 2015)
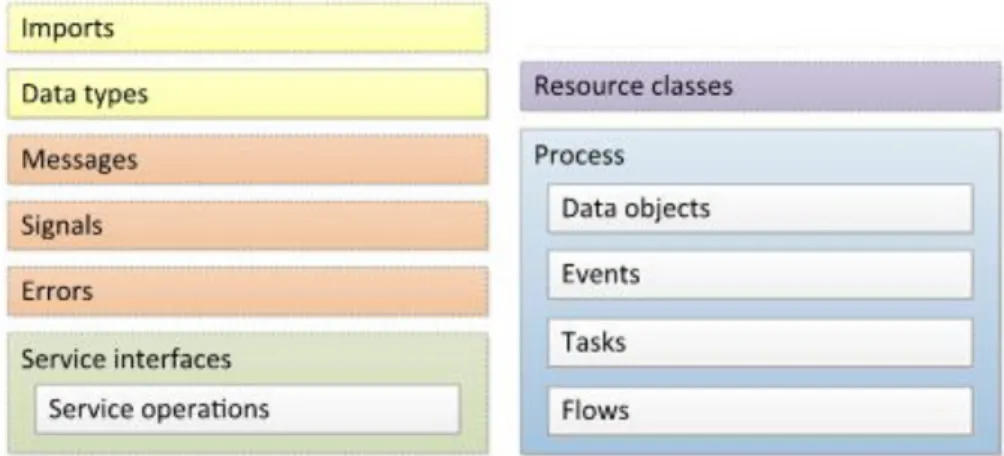
The structure of process artifacts presented in BPMN format is shown on Figure 2.10. “We can see finite set of objects that can be represented both graphically and in XML formats. It consists of a list of elements, where some are optional (those with a dashed border) and others are mandatory (those with solid borders). The process element is mandatory and stores information about the process model. This consists of electronic data objects, events, tasks and flows” (Dumas, Reijers, La Rosa, & Mendling, 2015).
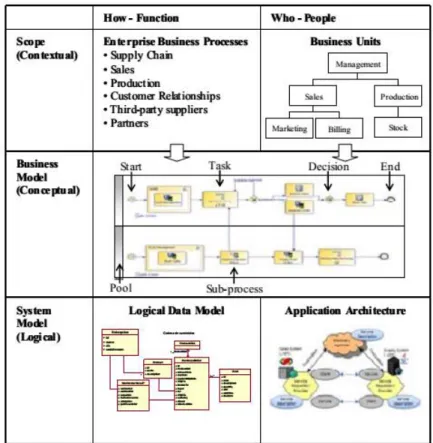
In the paper “Using the Zachman Framework to Achieve Enterprise Integration Based-on Business Process Driven Modelling” (Espadas, Romero, Concha, & Molina, 2008) authors showed the approach of applying BPMN 2.0 within the Zachman framework to achieve enterprise integration. Example of this approach is presented on Figure 2.11.
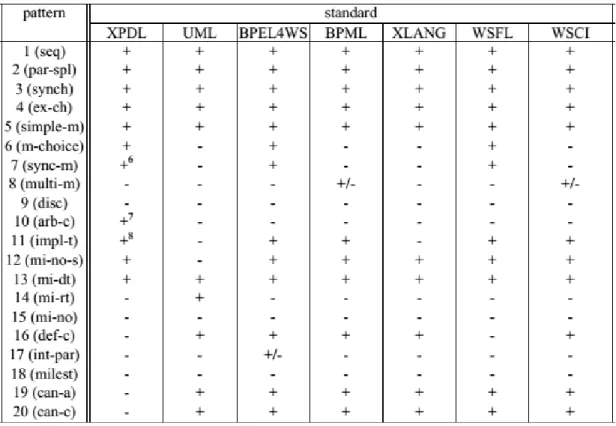
Figure 2.11 BPMN applyed to EA framework (Espadas, Romero, Concha, & Molina, 2008) There are few formats for XML representation of BPMN standard (see Figure 2.12) proposed by different
Figure 2.12 A comparison of XPDL with other standards (van der Aalst, 2004).
institutions and pursuing different goals: XPDL UML BPEL4WS BPML XLANG WSFL WSCI. The XPDL format, proposed by The Workflow Management Coalition (WfMC, 2012) is one of the perspectives, especially intended for BPMN models exchange (WfMC, 2012) among different supporting BPMN tools. In Figure 2.12 we see, that XPDL covers a significant part of Petri-Nets (van der Aalst, 2011) workflow patterns (van der Aalst, 2004). Thus, this standard is used for BPM tools exchange and process mining ProM (Kalenkova, de Leoni, & van der Aalst, 2014) and it can be used for gathering models for the XML representation of Enterprise DNA.
<Activities>
<Activity Id="3" Name="a1"/> <Activity Id="4" Name="a2"/> <Activity Id="5" Name="a3"/> <Activity Id="6" Name="g1">
<Route Gatew ayType=”Exclusive”" MarkerVisible="TRUE"/> </Activity>
<Activity Id="7" Name="a4"> </Activity>
</Activities> <Transitions>
<Transition Id="8" Name="" From="3" To="6" Flow Type="SequenceFlow "/> <Transition Id="9" Name="" From="4" To="6" Flow Type="SequenceFlow "/> <Transition Id="10" Name="" From="5" To="6" Flow Type="SequenceFlow "/> <Transition Id="11" Name="" From="6" To="7" Flow Type="SequenceFlow "/> </Transitions>
Figure 2.13 Example of XPDL derived from BPMN (WfMC, 2012).
Thus, for XML representation of functions on the process level of Zachman Enterprise Architecture Framework,
the XPDL format can be used. The example of XPDL format code, that was derived from BPMN merge gateway process workflow model is depicted on the Figure 2.13.
2.1.5.3 . Artifacts for network representation
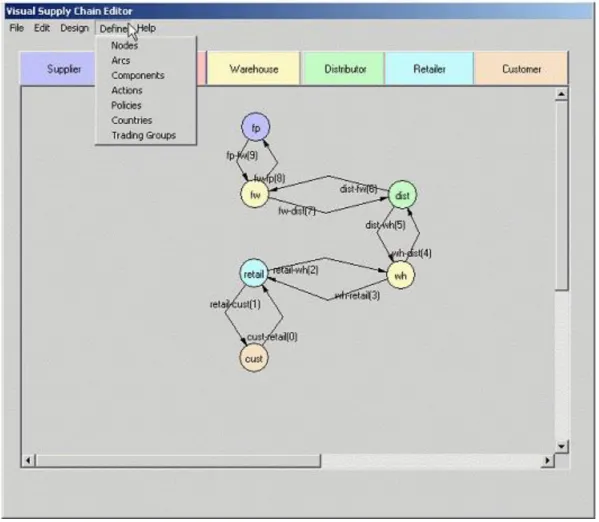
The third perspective of Zachman Framework is Where (Network). It represents geographical and logistic structure of enterprise and its parts (Zachman, 2011) and (Hay, 2000). For Conceptual aspect (Noran, 2003) proposed Graph (see Figure 2.14) as a representation of company’s logistic (supply chain) network. (Chatfield, Harrison, & Hayya, 2004) proposed The Supply Chain Modeling Language (SCML) as “a general, reusable, platform and methodology independent standard for describing a supply chain’s structure and logic”. Based onAccording to the XML standart, Supply Chain Modeling Language (SCML) is “open, standard data format for supply chain modeling can make supply chain analysis, especially via simulation modeling, more robust, yet more accessible” (Chatfield, Harrison, & Hayya, 2004).
The five basic elements of SCML for describing a supply-chain are: ▪ Node
▪ Arc
▪ Component ▪ Action ▪ Policy.
Figure 2.14 Supply chain topology network graph (Chatfield, Harrison, & Hayya, 2003).
<!ELEMENT arc (arcContainer, arcCosts, arcTravelTime, arcPolicies, initialLevels)> <!ATTLIST arc
name ID #REQUIRED
sourceNode IDREF #REQUIRED destinationNode IDREF #REQUIRED mode (land | rail | sea | air | telecomm | other) "land"
distance CDATA #IMPLIED unitOfDistance CDATA "miles" capacity CDATA #REQUIRED unitOfCapacity CDATA "unit"
containersOnHand CDATA #IMPLIED>
2.1.5.4 . Artifacts for people representation
The fourth perspective of Zachman Framework is Who (People). It represents company’s structure and functions performers, which can be grouped in many ways with different degree of responsibility, centralization, thus, forming managerial hierarchy (Mintzberg, 1979). For Conceptual aspect (Noran, 2003) proposed Org Charts as representation, that is simple, straightforward and widely used by business entities. There are following main types of organizational structures (Legaard & Bindslev, 2006):
▪ Simple structure; ▪ Hierarchical system; ▪ Functional organization; ▪ Product organization; ▪ Matrix organization.
The Organizational Chart is one of possible Organizational Structure representations. Example of Org Chart of hierarchical organization is shown on Figure 2.15.
Figure 2.15 Organizational chart example (Legaard & Bindslev, 2006) .
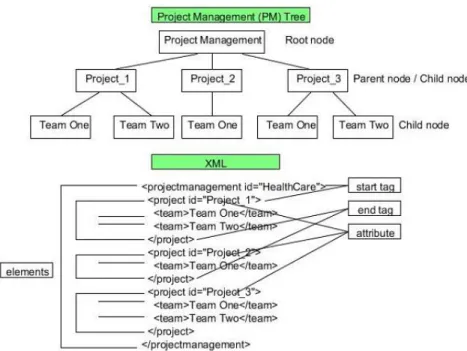
The Organization Chart usually have hierarchical structure and can be represented in XML format (Bulajic & Filipovic, 2012), because both (Org Chart and XML) have a hierarchical structure. The example of organizational structure and its translation into XML format is depicted on Figure 2.16.
Figure 2.16 Example of XML format for Org Chart modelling (Bulajic & Filipovic, 2012)
2.1.5.5 . Artifacts for time representation
The fifth perspective of Zachman Framework is When (Time). It represents time of events significant for the operating of the company (Zachman & Sowa, 1992). It can be business processes start, pause and end events, projects timelines and other significant time events. The interconnected time events and project steps in Zachman framework can be represented as Gantt Charts (Noran, 2003). The example of classical Gantt Chart in project management tool is shown on Figure 2.17.
Figure 2.17 Gantt Chart example (Dale, Churcher, & Irwin, 2005).
(Dale, Churcher, & Irwin, 2005) showed XML Project Management Method (PMM) representation of Gantt Chart with PMXML (Project Management XML) format (see Figure 2.18).
Figure 2.18 Gantt Chart XML representation (Dale, Churcher, & Irwin, 2005)
(Varela, Aparício, & Silva, 2005) also proposed XML representation of schedules and Gantt Charts, example of which is shown below:
2.1.5.6 . Artifacts for motivation representation
The last (, sixth) perspective of Zachman Framework is Why (Motivation). It represents goals of the company (Zachman & Sowa, 1992). Business goals framework was proposed by (Kaplan & Norton, 1992) as Balanced Scorecard which became widely used by the business and consulting. Balanced Scorecard represent business goals connected and grouped by four perspectives: customer, finance, internal operations and development. Four perspectives of interrelated company’s goals - Balanced Scorecards must be agreed with each other in order to achieve them. The original model of BSC, proposed by Kaplan and Norton is shown on Figure 2.19.
Figure 2.19 Balanced Scorecards performance measures (Kaplan & Norton, 1992).
(McGregor, 2003) showed that BSC XML draft standards can be used for XML representation of company’s goals - Balanced Scorecards. The example of BSC XML implementation is depicted on Figure 2.20.
2.2. A
RTIFICIALL
IFE2.2.1. Concepts
The bBiology is a study of carbon-based life forms, while Artificial Life is a science of synthesis of artificial life forms, that never existed before. The bBiology as a science researches living organisms,and decompose them starting from biological organizational hierarchy, then specific species, their organs, tissues, cells and molecules. The dynamics of living organisms is non-linear, and its self-organization is hard to describe by means of analytical methods because it fundamentally depends on interaction of its different parts. While the biology studies organisms by their decomposed parts to give a whole picture the Artificial Life, on the contrary, is a synthetic approach to biology – it considers living things not separately, but as a whole , putting them all together (Langton, 1996).
There is a distinction between Artificial Intelligence (AI) and Artificial Life (ALife) modelling strategies as “there is important difference between the modeling strategies AI and ALife typically employ. Most traditional AI models are top-down-specified serial systems involving a complicated, centralized controller that makes decisions based on access to all aspects of global state. The controller’s decisions have the potential to affect directly any aspect of the whole system” (Bedau, 2003b). On the contrary, ALife models populations of low-level autonomous “agents” that simultaneously interact with each other and every agent makes decisions based on its own situation. Thus, Artificial Life models copy the characteristics end development from examples intthe mnature (Bedau, 2003b).
Thus, ALife is a set of techniques and approaches having in common the analogy with a natural life and thus,that
simulating behavior and evolution of living species. (Langton, 1989). There are three main kind of Artificial Life:
Wet, Hard and Soft:
▪ The “wet” artificial life is intended “to create artificial cells out of biochemicals. Such artificial cells would be microscopic, autonomously self-organizing and self-replicating physical entities that assemble themselves out of non-living materials. Although artificial, they would repair themselves and adapt in an open-ended fashion, so for all intents and purposes they would be alive. The first artificial cells will probably just move through a fluid and process chemicals. To do even this flexibly and robustly, they must solve the functions of self-maintenance, autonomous control of chemical processing, autonomous control of mobility, and self-replication”. (Bedau, 2003a)
▪ “hard’ life produces hardware implementations of life-like systems, and ‘wet’ artificial life synthesizes living systems out of biochemical substances. Cognitive science and artificial life share some intellectual roots, and their subjects and methodologies are related. Now that artificial life has matured over the past decade or so, it is appropriate to review its achievements and speculate about its future connections with cognitive science. (Bedau, 2003a)
▪ ‘Soft’ artificial life creates simulations or other purely digital constructions that exhibit life-like behavior, ‘hard’ artificial life produces hardware implementations of life-like systems (Bedau, 2003a). Soft ALIfe involves attempts to a) synthesize the process of evolution, b) in computers c) will be interested in whatever emerges in process, even if the results have no analogues in the ‘natural’ world (Langton, 1996).
Artificial Life employs such fundamental notions of biology as reproduction, evolution, natural and artificial selection, genetic connection, morphogenesis, ontogenesis and phylogenesis, genotype and phenotype, chromosome, organism (individual) and population (Tarasov, 2002). The most important artifacts are (Tarasov, 2002), (Langton, 1996):
▪ Individual – is a model of low-level agent that has specific properties and behavior; ▪ Population – is a set of interacting individuals;
▪ Evolution – is a process of adaptation of population and each individual to specific environment conditions, thatconditions that is measured by means of individual fitness. during the evolution individuals are replaced by their offspring;
▪ Genotype – it is an internal characteristic, code which encodes with the linear sequence of nucleotide (Genes) with the instructions on how to build and organism, and is called DNA;
▪ Phenotype – is the behavioral property of existing organism that defines the adaptability to the a
specific environment. Due to non-linear interactions of genes, the phenotype is a non-linear function of genotype.;
▪ Chromosome – the representation of individual Genotype (in the nature it is represented by the DNA) For the purposes of this paper we consider the “Soft” Artificial Live that can be modelled by means of Evolutionary (Genetic) Algorithms.
2.2.2. A brief history of Artificial Life
The term “Artificial Life” and fundamental models of this research topic related to the work of the University of Cambridge professor John Horton Conway on cellular automata. He called it Game of Life and published in Scientific American magazine (Gardner, 1970) .
The phrase “Artificial Life”, that” that became the name of the science was proposed by Christopher Langton who was an unconventional researcher. He became interested by Conway's Game of Life and started to develop the idea that the computer could mimic living creatures. He intentionally applied the term as a title for the ‘‘interdisciplinary workshop on the synthesis and simulation of living systems’’ that he organized in September 1987, in Los Alamos, New Mexico (Langton, 1989).
Langton gave the definition of ALife as following: “Artificial life is the study of artificial systems that exhibit behavior characteristic of natural living systems. This includes computer simulations, biological and chemical experiments, and purely theoretical endeavors. Processes occurring on molecular, cellular, neural, social, and evolutionary scales are subject to investigation. The ultimate goal is to extract the logical form of living systems” (Langton, 1987).
In 1987, computer animator Craig Reynolds created flocking behavior in a computer program to animate groups of boidsbirds. He used three simple rules to produce lifelike modal models to avoid obstacles laying on their path. This work emerged many as alife Alife research by movie producers who was were trying to find realistic animation of natural plants, creatures and inanimate nature for entertainment industry (Reynolds, 1987). In 2006, Peter Turchin and Mikhail Burtsev were studying evolution of cooperative behavior by means of game theory and agent-based simulation. In their model, agents were endowed with a limited set of receptors, a set of elementary actions and a neural net in between. Behavioral strategies were not predetermined instead, the process of evolution constructed and reconstructed them from elementary actions. As a result, cooperative
strategies could evolve even under such minimal restrictions and agents could perceive heritable external markers of other agent (Burtsev & Turchin, 2006).
2.2.3. Genetic algorithms
2.2.3.1 Concepts
Genetic algorithms (GA) are stochastic, heuristic optimization methods, first proposed by John Holland in 1975 (Holland, 1975). They are based on the idea of evolution through natural selection. In addition to finding the extremum more quickly, the positive properties of genetic algorithms include the finding of a “global” extremum. In tasks where the objective function has a significant number of local extremes, in contrast to the gradient method, genetic algorithms do not “get stuck” at the points of local extremum but allow us to find the “global” optimum.
Genetic algorithms work with a collection of individuals - a population where each individual represents a possible solution to this problem. It is estimated by the measure of its “fitness” according to how well the corresponding solution to the problem is. In nature, this is equivalent to assessing how effective an organism is in competing for resources. The most adapted individuals can “reproduce” the offspring by means of “crossing” with other individuals of the population. This leads to the appearing of new individuals, which combine some characteristics that they inherit from their parents. The least adapted individuals are less likely to reproduce their descendants, so that the properties they possessed will gradually disappear from the population in the process of evolution. Sometimes mutations occur, or spontaneous changes in genes (Holland, 1975).
Thus, from generation to generation, good characteristics spread among the population. Crossing the fittest individuals leads to the fact that the most promising parts of the search space are inherited. Ultimately, the population will converge to the optimal solution of the problem. The advantage of a GA is that it finds approximate optimal solutions in a relatively short time (Goldberg, 1989).
GA operates on the following terminology:
▪ Chromosome - the solution to the problem, the carrier of hereditary information. The set of chromosomes (the values of the parameters of the objective function) characterizes the individual. Chromosome consists of genes.
▪ Genes are coding elements of hereditary information (parameters of the objective function). As genes often acts bit-coding information.
▪ An individual is a set of chromosomes (a set of parameters for which the value of the objective function is sought).
▪ Individual fitness - the value of the objective function for a given set of parameters in relation to the desired value
GA performs on individuals the following actions
▪ Generation of the initial chromosome population - randomly selected values of the parameters of the objective function and for these values of the parameters is the value of the objective function. ▪ Breeding (Selection)- the choice of individuals with the best adaptability for reproduction (sorting by
the value of the objective function). The better the individual’s fitness, the higher its chances of the next generation crossing and inheriting its genes.
▪ Crossover - crossbreeding. The break point is randomly selected - the area between adjacent bits in the string. Both parent structures are broken into two segments at this point. Then, the respective segments of different parents are glued together, and two genotypes of descendants are obtained. There are variations with two point of cutting the chromosome.
▪ Mutation is a random change of genes. A randomly selected gene changes to another with some probability and bring new features and behaviour.
First, the GA function generates a certain number of possible solutions (individuals), and then calculates fitness for each one - proximity to the truth. These decisions give offspring (a crossover operation is performed). Better solutions have a greater chance of reproduction, and "weak" individuals gradually "die off." Thus, the process of evolution happens. At certain stages of this process, spontaneous changes in genes occur (mutations and inversions). Useful changes that lead to an increase in the individual's fitness give birth to their offspring, while “useless” changes die off. After crossing, mutations and inversions, the fitness of individuals of the new generation is again determined. The process is repeated until a solution is found or a sufficient approximation is obtained (Goldberg, 1989).
2.2.3.2 Genetic Algorithm work-flow
The classic generic Genetic Algorithm is shown on the Figure 2.21. There are plenty of variations of GA, mainly distinguished by the implementation of genetics operators: Initialization, Selection, Mutation and crossover. Moreover, the important difference in implementation of Genetic Algorithm for specific tasks is the representation of the individual.
Figure 2.21 Generic Genetic Algorithm workflow.
The Genetic Algorithm have following stages (initialization step is not shown on the picture above), that are depicted on Figure 2.21:
▪ Initialization – setup of the population with the individuals, filling their chromosome with specific values, derived randomly or by means of particular algorithm;
▪ Selection – selecting individuals (For example couple of parents) for applying genetic operators. Population
Parents XO, MU
▪ Execution of Genetic Operators such as crossover (XO) and mutation (MU). Implementation of genetic operators is specific for the particular task.
▪ Evaluation - is applying fitness function for each individual of the population to decide which of them have better fit for the environment in terms of the task. More fitted individuals form new population and cycle starts again.
After convergence of fitness function to the global optimum or iteration of specified number of epochs (generations) algorithm stops and the individual with the best fitness represent the solution of the problem.
2.2.3.3 Genetic Algorithm representation
For implementation of Genetic Algorithm, the DNA of the individual must be represented in digital and convenient way to make the solution of the problem possible. This representation must allow for the crossover and mutation ofto perform genetic operators,as crossover and mutation and at the same time be reasonable for evaluation by means of fitness function. For the same task, different representations can be applied that will affect performance and precise of the algorithm within specific problem. There are several types of chromosome representation for GA:
▪ Discrete – usage of distinguishing numbers (usually binary representation – zeros and ones); ▪ Real number - representation in case if the genotype of the problem is within real number;
▪ Ordinal – used when the chromosome is permutation of numbers (Traveling salesman task) and must be consistent;
▪ Tree-based – used when individuals represented as a tree that can grow. Usually represent complex formulas.
Thus, the problem of best representation of the chromosome of the individual for the specific problem exists. For the purposes of this paper discrete representation considered (see example on Figure 2.22).
3. METHODOLOGY
The aim of this paper is to create digital representation of Enterprise DNA which, strictly speaking, is the model for information system (artificial life simulation genetic algorithm), that, in turn, will simulate competitiveness of an Enterprises. For developing of new knowledge in Information Science the Design Science Research (DSR) discipline and framework was structured and developed (Hevner, 2004).
3.1.
D
ESIGNS
CIENCER
ESEARCHThis framework defines steps for development of new Information Systems Science artifacts. In further work (Gregor & Hevner, 2013) summarized works in DSR discipline and structured researches by contribution type and research artifacts. From Table 3.1 we can figure out that this work is nascent design theory (Level 2) and as the result is the model (representation).
Table 3.1 Design science research contribution types (Gregor & Hevner, 2013)
Most of scientific paper aren’t really “new.” They are based on previous ideas, papers, artifacts etc. “Everything is made out of something else or builds on some previous idea. When is something really novel or a significant advance on prior work? A DSR project has the potential to make different types and levels of research contributions depending on its starting points in terms of problem maturity and solution maturity” (Gregor & Hevner, 2013). Thus, using DSR framework we can classify proposed idea as an Invention (see Figure 2.1),
because solution domain (Enterprise’s DNA digital representation) maturity and problem domain (Simulation of Enterprises competitiveness applying artificial life algorithms) maturity are low – author have not found other work on these subjects.
The Design Science Research methodology implies the following generic steps, showed in Table 3.2.
Table 3.2 Publication schema for a DSR Study (Gregor & Hevner, 2013)
3.2.
R
ESEARCHS
TRATEGYThe aim of this paper is to create digital representation of Enterprise according to Design Science Research methodology. For this goal following steps (see Table 3.3) were fulfilled and results obtained:
Step
Results
Introduction
• Statement of the problem and research objectives
• Are there other paper on this subject?
Literature Review
Finding similar works and previous researches related to study explaining:
• Typology of enterprises
• Enterprise’s architecture
• Enterprise Architecture frameworks
• Zachman framework
• Artefacts for the representation of Enterprise aspects
• Concepts of Artificial Life
• History of Artificial Life
• Genetic Algorithms
Method
Design Science Research method
Artifact
Description
Digital representation of Enterprise’s DNA using XML standard
Evaluation
• Interview with GA domain experts
Discussion
• Analysis of the created Enterprise DNA representation
• Explaination how it can be used
• Understand the pros and cons
Conclusions
Conclusions on the proposed Artefacts and further development of the
research topic
Table 3.3 Research steps