UV Index estimation from global radiation and total ozone observations in Azores
7
0
0
Texto
(2) 400 nm. E eff =. ∫ E λ ⋅ S λ dλ. (2). 290 nm. Eλ and Sλ are, respectively, the incident spectral irradiance and the action spectra for the erythema at wavelength λ. The action spectra used for the erythema is the one defined by CIE or McInlay-Diffey [2]. The UVI scale was defined by World Health Organization (WHO) [3] in order to provide a correspondence between UVI levels and protective measures to avoid damaging effects on humans. This information can be classified into five categories: LOW (1-2), MODERATE (3-5), HIGH (6-7), VERY HIGH (8-10) and EXTEREMELY HIGH (11 or greater). However, UVI is usually given in integer values, so the required precision for the public must be less or equal 0.5. While UV dependence on ozone is well understood and easy to model, UV dependence on clouds is difficult to model and its effect on daily variability. In addition, atmospheric UV measurements are more expensive than global radiation and therefore fewer are available. However, global radiation is much less dependent on ozone and its variability depends essentially on the cloud coverage, therefore, global radiation measurements could be used to correct a simple radiative transfer model for clear sky conditions with respect to the actual cloudiness. The scope of this work is to find an approach to derive UVI from global radiation and ozone measurements with acceptable error for public awareness.. 2 Instruments Most part of atmospheric UV radiation measurements are currently done by two types of instruments spectral and broadband. Spectral instruments are generally spectrometers or spectroradiometers with high spectral resolutions of few nanometers or less. Broadband instruments are generally sensors with a response curve similar to the erythema action spectra but with wider spectral ranges of several nm. Because spectral instruments are more complex than broadband ones they are also more expensive and need more qualified operators and maintenance. Global radiation instruments or pyranometers are basically radiometers with a wide spectral range, from 0.3 mm to 3 mm, and used on meteorological stations for meteorological and/or climatological purposes. Because they are less complex than UV instruments, they are also less expensive and easy to maintain. Global radiation data is also easier to find and therefore it is a potential source of information to better explain spatial and time radiation variability due to clouds. Global radiation records in Azores started in the 1940’s at the Observatory José Agostinho (38º39’32” N, 27º13’23” W, 85 m), located in Angra do Heroísmo city on Terceira Island. In the scope of the research project CLIMAAT (Interreg IIIb), a more complete radiation monitoring system was acquired and installed in this site. This.
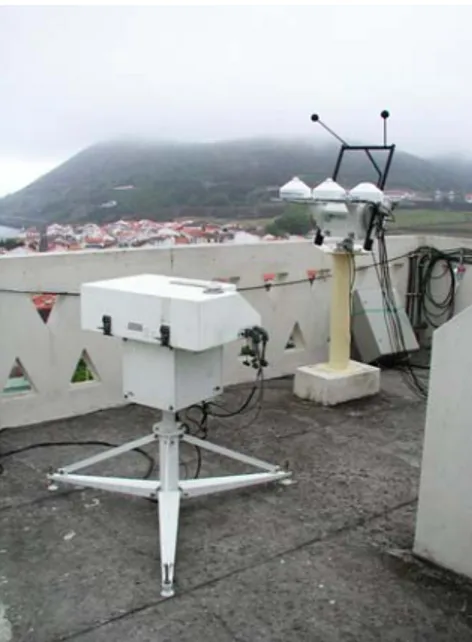
(3) system consists of one automatic sun tracker equipped with one pyranometer for global radiation and two shadow balls for a second pyranometer (diffuse radiation) and for a pyrgeometer (longwave atmospheric radiation). It was also installed one NIP pyreliometer (direct radiation) and a four-wavelength photometer for aerosol optical depth measurements. An automatic Brewer MKII spectrophotometer was also installed at the same place (Figure 1) to perform spectral global UV irradiance (290325 nm) to allow the total column ozone calculations several times a day.. Fig. 1. Measuring radiation setup from AZONET (AZores Observation NETwork) at José Agostinho Observatory in Angra do Heroísmo: Brewer MKII spectrophotometer (left) and the sun tracking system setup (right).. 3 Methods In order to derive UVI from global radiation G measurements, it is assumed that the effect of UVI due to presence of clouds is proportional to the effect on global radiation,. UVI G ∝ UVI 0 G 0 ,. (3). where, UVI0 and G0 are, respectively, the UV index and global radiation in the absence of clouds. While UV radiation is only reflected by the presence of the clouds, global radiation is reflected and absorbed, so the attenuation for global radiation.
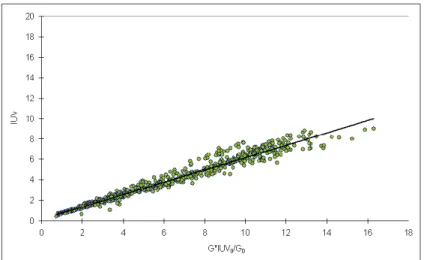
(4) should be greater than for UV and more depending on the solar zenith angle and cloud thickness. These effects are difficult to model and require a very complete knowledge of the clouds that is not available. However, the attenuation mechanisms in both cases are directly proportional at first order, so the uncertainty of this approach remains at second order. In this paper, UVI0 and G0 are computed by a simple radiative transfer model for clear sky conditions [5], while observed total ozone column and constant conditions for the other attenuation variables are used to determine UVI and G. Data collected for this study are from 2004, August to 2006, August with some short periods of missing data due to suntracker and/or Brewer malfunction. Because each full UV measurement takes about 3 minutes, the global radiation measurements (5s resolution) were integrated for that period. Daily averages of observed total ozone column were used instead of individual observations to remove air mass instrumental dependence. The spectral integration (Eq. 2) for the UVI computation was corrected for the 325-400 nm range not measured by the Brewer MKII. Observed diffuse radiation values were also collected in order to identify periods of radiation intercepted by clouds.. 4 Results In this analysis three cases where considered: only direct sun, only cloudy and any conditions. Data where the ratio of the Global/Diffuse radiation were greater or equal than 5, was classified as clearly direct sun while data where this ratio was less or equal than 1.1 were classified as clearly cloudy. Linear regression analyses were done, for the three cases, according to the proposed linear model,. ⎛G ⎞ UVI = a⎜⎜ UVI 0 ⎟⎟ + b , ⎝ G0 ⎠. (4). suggested by the experimental observation, represented in Figure 2, for the direct sun case. It can be clearly seen that the linear adjust is satisfactory (Table 1) and that data points are well distributed over all the range. However, modeled values are underestimated by the observations due to the super estimation of the UVI0 model or to a different calibration scale of the instrument..
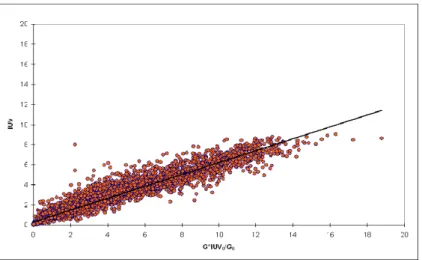
(5) Fig. 2. Observed UVI values vs. modeled (G*UVI0/G0) for direct sun cases (Global/Diffuse >5).. For the experimental representation of the cloudy case (Figure 3) it also shows a behavior that can be also translated by the proposed model (Table 1), although with more dispersion.. Fig. 3. Observed UVI values vs. modeled (G*UVI0/G0) for cloudy sun cases (Global/Diffuse <1.1)..
(6) Fig. 4. Observed UVI values vs modeled (G*UVI0/G0) for any conditions.. Finally, considering any conditions (figure 4) the experimental data points show also a linear correlation, that was also translated by applying the proposed model (Table 1). Table 1. Linear regression information for the three cases. R Std. Error a Direct sun Cloudy All. 0.98 0.97 0.97. 0.40 0.42 0.50. 0.607 ± 0.004 0.643 ± 0.003 0.593 ± 0.002. b. N. 0.11 ± 0.03 0.307 ± 0.009 0.303 ± 0.008. 728 3793 7151. Standard error ranges from 0.4 to 0.5 UVI units, respectively, for direct sun and any conditions. This means that the proposed approach can be used for public information purposes. The slope, a, is consistent in the three cases and equals to 0.6. The intercept, b, is always positive and ranges from 0.11 and 0.31, inside the standard error (0.4–0.5) and therefore statistically zero.. 4 Conclusions A setup for radiation monitoring was installed in the AZONET allowing simultaneously measurements of global and diffuse radiation as well as UV spectral irradiances. Data collected, during two years, were used to analyze the relationships between UVI and global radiation under three types of situations: direct sun; cloudy; and any conditions..
(7) A linear model was used to derive UVI from global radiation data and radiative transfer models using observed total ozone column data. Results show that the proposed linear model,. ⎛G ⎞ UVI = (0.593 ± 0.002)⎜⎜ UVI 0 ⎟⎟ + (0.303 ± 0.008) , ⎝ G0 ⎠ can be used for public information purposes (UVI uncertainty of 0.5).. Acknowledgements This work was supported by the projects CLIMAAT (MAC 2.3/A3), CLIMAAT II (03/MAC/2.3/A5) and CLIMARCOST (05/MAC/2.3/A1) funded by the INTERREG IIIB program and FEDER.. References 1. 2.. 3. 4. 5.. Vaniceck, K, Frei, T., Litynska, Z., Schmalwieser A.. UV- Index for the Public. COST 713 Action, Brussels (1999). McKinlay, A. F., Diffey, B. L..A reference action spectrum for ultraviolet induced erythemal in human skin. In W. R. Passchler and B. F. M. Bosnajakovic (eds), Human Exposure to Ultraviolet Radiation: Risks and Regulations. Elsevier Sci., New York. (1987) 83–87. World Health Organization. Global solar UV index, A practical guide, WHO/SDE/OEH/02.2, Geneva, Switzerland (2002). Sivkov, S.I., Computation of Solar Radiation Characteristics. Israel Program for Scientific Translations (1971) Carvalho, F. A simplified spectral model for UV irradiance computations. In Chemistry and radiation changes in the ozone layer (Kolympari, 15-24 May 1999), Zerefos Christos S. ; Isaksen Ivar S.A. ; Ziomas Ioannis (eds). Kluwer Academic Publishers (2000) vol.:557..
(8)
Imagem
Documentos relacionados
Model estimated CO 2 time series at two surface stations in the southern extra-tropics, compared to CO 2 measurements taken at those stations.. The “GOSAT” line is from an
Using the tight correlation observed between PSC areas and total vortex ozone deple- tion and taking into account the decreasing amounts of ozone depleting substances, we predict
Such an algorithm further develops previous studies in order to improve the following: (i) the geographical coverage of the NN, by extending its training set to ozonesonde data
The NWP data is received from the ECMWF model; the SAR data is the RADARSAT data from CIS; and the linear mapping coefficients ( a and b ), used in the final ice thickness
The quality control and quality assurance of the network is based on regular lamp mea- surements and, for UV radiation measurements, on a travelling reference (Lakkala et al.,
Models that hope to predict global temperature or total ozone over long time scales should be able to duplicate the long-range correlations of temperature and total ozone as shown
and Pandey A.N., 2007, New correlation to estimate global solar radiation on horizontal surface from using sunshine duration and temperature data, ASME Transactions, Journal of
The time series provides information to survey the evolution of Arctic ozone layer and can be used as a reference point for assessing other total ozone column measurement practices..
