WORKING PAPER SERIES
Universidade dos Açores Universidade da Madeira
CEEAplA WP No. 03/2011
Empirical Analysis of the Hsia Option-Pricing
Based Model Cost of Capital
João C. Neves Pedro Pimentel
Empirical Analysis of the Hsia Option-Pricing Based
Model Cost of Capital
João C. Neves
Universidade Técnica de Lisboa (ISEG)
Pedro Pimentel
Universidade dos Açores (DEG e CEEAplA)
Working Paper n.º 03/2011
Janeiro de 2011
CEEAplA Working Paper n.º 03/11 Janeiro de 2011
RESUMO/ABSTRACT
Empirical Analysis of the Hsia Option-Pricing Based Model Cost of Capital The cost of capital is a fundamental concept in strategic decisions such as capital investments, capital structure, new issues, mergers and acquisitions, spin-offs and other corporate restructurings.
This paper explores empirically the option-based model developed by Hsia (1991) for estimating the cost of equity and the cost of capital of the firm. The composition of the sample in this exploratory study is all 17 non-financial companies listed in the Euronext Lisbon that are included in the market index PSI20. The Hsia model is used for estimating the cost of equity and the cost of capital of the firm for these 17 companies and is compared to the estimates obtained from the Capital Asset Pricing Model (CAPM) and the traditional weighted average cost of capital (WACC).
The difference between the means of the cost of equity estimated by Hsia model and CAPM is not statistically significant at 1% level and their correlation of 46.2% is statistically significant at 1% level. However, the differences at the individual level are quite large. One of the limitations found in this study was the inconsistency on the computation of the cost of debt. The problem arise from the fact that the cost of debt do not follow the pattern expected in the theory, but we also find that the Hsia model is unable to deal with potential inconsistencies of the financial market.
JEL Classification: G10; G30.
Key words: Cost of equity, option based cost of capital, weighted average cost of capital, capital assets pricing model
Pedro Pimentel
Universidade dos Açores
Departamento de Economia e Gestão Rua da Mãe de Deus, 58
9501-801 Ponta Delgada João C. Neves
Universidade Técnica de Lisboa
Instituto Superior de Economia e Gestão Rua Miguel Lupi, 20
Empirical analysis of the Hsia option-pricing based model
cost of capital
João C. Neves
Professor, ISEG - School of Economics and Management, Lisbon Visiting Professor, HEC - School of Management, Paris
[email protected] Pedro M. Pimentel
Assistant Professor, Universidade dos Açores, Ponta Delgada [email protected]
Abstract
The cost of capital is a fundamental concept in strategic decisions such as capital investments, capital structure, new issues, mergers and acquisitions, spin-offs and other corporate restructurings.
This paper explores empirically the option-based model developed by Hsia (1991) for estimating the cost of equity and the cost of capital of the firm. The composition of the sample in this exploratory study is all 17 non-financial companies listed in the Euronext Lisbon that are included in the market index PSI20. The Hsia model is used for estimating the cost of equity and the cost of capital of the firm for these 17 companies and is compared to the estimates obtained from the Capital Asset Pricing Model (CAPM) and the traditional weighted average cost of capital (WACC).
The difference between the means of the cost of equity estimated by Hsia model and CAPM is not statistically significant at 1% level and their correlation of 46.2% is statistically significant at 1% level. However, the differences at the individual level are quite large. One of the limitations found in this study was the inconsistency on the computation of the cost of debt. The problem arise from the fact that the cost of debt do not follow the pattern expected in the theory, but we also find that the Hsia model is unable to deal with potential inconsistencies of the financial market.
JEL Classification: G10; G30.
Key words: Cost of equity, option based cost of capital, weighted average cost of capital, capital assets pricing model
Acknowledgments: We wish to acknowledge the financial support granted by the Fundação para a Ciência e Tecnologia (FCT) and the Programa POCTI.
Empirical analysis of the Hsia option-pricing based model
cost of capital
1. Introduction
The cost of capital is a fundamental issue in the corporate finance literature. It is used in most financial strategic decisions such as the appraisal of capital investments, capital structure policy, corporate and businesses valuations, mergers and acquisitions, spin-offs, management buy-outs and other restructuring processes. The cost of capital is also essential for the value-based management required by modern corporate governance systems. However, the determination of the appropriate cost of capital for a company or business is a challenge for financial economists, based on the variety of models and their contradicting results. The Capital Asset Pricing Model (CAPM) was the standard for many years but has been criticized in many grounds, especially after the Roll’s critique (1977). Subsequently other alternative models appeared in the literature such as the arbitrage-pricing model (Ross, 1976), the multi-factor model of Fama and French (1995) and the option-pricing based models (Hsia, 1981, 1991; McNulty et al., 2002).
The Hsia (1981, 1991) model combines the option-pricing model with the capital asset pricing model and the Modigliani-Miller theorems. According to the formulation, they are all consistent (Hsia, 1981). However, to our knowledge, this consistency was never empirically tested. Therefore, the objective of this paper is to test empirically the consistency between the Hsia model (1991) and the CAPM on the estimated cost of equity and average cost of capital.
3
Section 1 provides a typology of models in the literature to estimate the cost of capital. Section 2 summarizes the Hsia model and the method used to get the input variables required by the model. Section 3 characterizes the sample and the data used. Section 4 analyses the results provided by both, Hsia and CAPM models. The final section presents the conclusions, limitations, and implications for future research.
2. Typology of models for estimating the cost of equity
The models for estimating the cost of equity abound in the financial economics literature. They can follow an ex-post or an ex-ante approach.
The most ancient method, known as the naïve method follows an ex-post approach. Using historical data, it assumes that the cost of equity is the average return observed in the stock market for a long period. This is commonly used in practice to estimate the market risk premium, which is published annually by Ibbotson Associates.
Ex-post models based on the relationship between risk and return, was first developed almost simultaneously by Sharpe and Treynor (Copeland et al. 2005) which determines the market price of risk and the measure of risk for a single asset. This is the well-known CAPM. The model is built on the assumptions that the variance in return is the appropriate measure of risk and the risk that requires rewarding is the non-diversifiable risk. Another important equilibrium pricing model is the arbitrage-pricing model (APT), developed by Ross (1976). For this model, the return of any risky asset is a linear combination of various factors that affect the return. Merton (1980) developed an ex-post method that requires shorter time series than the naïve approach and allows the financial economist to define three different investor’s utility functions for rewarding risks. Fama and French (1995) present a
three-factor model and the Ibbotson Associates publishes now, every year, the risk premium estimates for each of these factors. The D-CAPM (Downside Capital Asset Pricing Model) is an adaptation of the CAPM recently presented and tested by Estrada (2002) using the semi-variance as a measure o risk, instead of the variance, as the investors are concerned with lower than average returns and not with positive excess returns. All the previous models use historical data for estimating the cost of equity and assume a specific relationship between risk and return in the past that is perpetuated in the future. In spite of the controversy and criticism to the CAPM including Fama and French (1992) and Ross (1976), this model is still a standard and the most used by practitioners, according to the surveys of Bruner et al. (1998) and Graham and Harvey (2001). This is the major reason to use it as a basis of comparison to the Hsia option based model in this paper.
A type of ex-ante models uses forward-looking assumptions for the fundamentals to justify the actual stock prices in the market with the premise that they are efficiently set. This is usually called the implicit cost of equity. The Gordon and Shapiro (1956) model based on constant growth and other variations of it, such as the two phases model (Malkiel, 1963) and the H model (Fulher and Hsia, 1984) are some other examples. The assumptions on the fundamentals used by these models, such as the growth opportunities and payout ratios, create substantial uncertainty and variation on the cost of equity (Fama and French, 2001) Another type of ex-ante models for estimating the implicit cost of capital are option-theory based. Hsia (1991) developed a model that combines the option model with the CAPM. McNulty et al. (2002) developed the market deriver capital-pricing model (MCPM) that uses the stock option premium and the stock price to estimate an implicit cost of equity. The advantage of these option-based models is they do not require predictions for
5
estimating the implicit cost of equity or historical data. They only call for data that is currently observable in the market. In the Hsia (1991) option-based model, all parameters are extracted from the market but the instantaneous standard deviation of rates of return of the firm that is endogenously estimated by the model.
The Hsia (1991) model is straightforward and his paper presents specific proposals to overcome some of the difficulties to implement the model. For example, Hsia (1991) builds up on the work of Black and Scholes (1973) that shows the equity of a firm can be valued as a call option using the option-pricing model. However, its implementation requires a number of assumptions that may distort the true value of the firm, such as the debt being similar to a zero coupon bond or the assets of the firm traded and its price observable, which would allow for arbitrage.
Our research aims to analyze the empirical implications of such assumptions and simplifications. To our knowledge, this is the first empirical study of the Hsia cost of capital option-based model.
3. Methodology
Hsia (1991) uses the Option Pricing Model (OPM) of Black and Scholes (1973) and the developments of Copeland and Weston (1988, pp.468-471) for estimating the cost of equity, the cost of debt and the cost of capital of the firm as follows:
The cost of equity: rs =r+
[
(
A/B)
−r]
(
B/S) ( ) (
[
N d1 /N −d1)
]
(3.1)
The cost of debt: i= A/B (3.2)
The cost of capital of the firm: rv =r+
[
(
A/B)
−r]
[
B/(
S+B)
]
[
1/N(
1−d1)
]
Where rs = Cost of equity
i = Cost of debt, continuously compounded
rv = Cost of capital of the firm or average cost of capital (before taxes)
r = Instantaneously risk-less rate of interest per unit of time
S = Equity value
B = Market value of debt equivalent to the present value of a zero-coupon bond A = Financial expenses
N(d1) = Cumulative probability of the standard normal distribution with d1 as the
upper limit
The estimation of the cost of equity in the Hsia model requires four inputs that are observable – the market value of debt, the market value of equity, the risk-free rate, and the financial expenses. The fifth input, the volatility of the rate of return on the firm per unit of time is endogenously deducted from the Black and Scholes (1973) model. This model is adjusted as follows:
) ( ) (d1 Xe N d2 VN S= − −rT (3.4) where d1 =
{
[
ln(V/X)+rT]
/σ
υ T}
+( )
1/2(
σ
υ T)
2 d = d1−συ TN(⋅) = Cumulative probability of the standard normal distribution with d1 or d2 as
the upper limit
r = Instantaneous risk-free rate of return per unit of time
σν = Instantaneous standard deviation of rates of return on the firm’s capital per
unit of time
S = The equity valued as a call option
V = The total value of the firm as the underlying asset
X = The debt of the firm equivalent to the face value of a zero coupon bond T = The term to maturity of the debt equivalent to a zero-coupon bond,
considered as the duration of the debt
The market value of the equity is obtained from the stock price and the number of shares issued, which requires the assumption of market efficiency. According to
7 Hsia (1991), the payment of dividend is irrelevant in the Black and Scholes framework because the issuers and receivers are the same equity owners. This is the reason why Hsia uses the Black and Scholes model with any adjustments for dividends.
The expiry date (T) is estimated by Hsia (1991) assuming the level of debt (B) is constant and permanent. Because of the permanent nature of the debt, the financial expenses (A) can be considered equivalent to an annual coupon payment of a
perpetual bond (Ai ), the duration is
i
1 and the expiry date (T) is estimated as
follows: ) / ( / 1 i B A D T = = = (3.5)
B = Present value of debt
A = Financial expenses
D = Duration
T = Expiry date
i = Interest rate (or cost of debt)
The variables A and B are observable and T can be estimated by equation 3.5.
The exercise price (X) is the value of debt capitalized to the maturity date T,
previously estimated as the duration of the debt: iT
Be
X = .
Because T = 1i then:
Be
X = (3.6)
BeiT = Value of debt at the maturity date
The variables A, B, S and r are observable and X and T are calculated as
previously discussed. The standard deviation of the rate of returns of the firm (σν) is
derived endogenously by Hsia from equation 3.4 using V=S+B, X=Be and T=(B/A)
equalizing the implicit function ƒ(A, B, S, r,
σν
) to zero:(
)(
)
[
]
0 ) ( / 1 exp ) ( ) ( ) , , , , ( 2 1 1 = − − − − = d N rB A A d N d N S B r S B A f συ (3.7) where d1 =(
) ( )(
) ( )
(
)
A B A B A rB A B S / 2 / 1 / / 1 / 1 ln υ υσ
σ
+ − + + 2 d = d1−σ
υ B/Ar = Instantaneous risk-free rate of return per unit of time
σν = Instantaneous standard deviation of rates of return on the firm per unit of time S = Equity value (stock price times number of shares)
B = Present value of debt
A = Financial expenses
In this study, the cost of equity and the firm’s cost of capital derived from the Hsia model (equations 3.1 and 3.3) are compared respectively to the cost of equity estimated by the CAPM and the weighted average cost of capital, for a sample of companies listed in the Euronext Lisbon. The betas required by the CAPM were obtained from Datastream and the risk premium was of 6.38% that was estimated by Neves and Pimentel (2004) for Portugal during the 1990’s.
4. Sample characteristics
The sample is composed by all the 17 non-financial companies listed the Euronext Lisbon that were included in the PSI20 by 31 December 2003. The three banks in the PSI20 were excluded from the sample in order to keep the consistency of data extracted from the financial statements.
9 The data required by the Hsia model was obtained from the 2003 annual accounts and the stock price at 31 December 2003. We find some difficulties with the cost of debt and the market value of debt, which are theoretically observable.
The cost of debt (i) was estimated using the financial statements of the firms as
the quotient between the financial expenses (A) of the year 2003 and the average of
outstanding debt (B) at 31/12/2002, 30/06/2003, and 31/12/2003. This is the best
estimate we could get, however, it can be distorted by accounting policies such as the capitalization of interest and the use of some sort of off-balance financing. More accuracy on the cost of debt would require detailed information on the service of debt, which is not published and is difficult to obtain directly from the firms.
Most Portuguese firms do not issue bonds and consequently the market value of debt is not observable. This study assumes that the book value of debt is
approximately equivalent to its market value (B) because borrowing rates, in Portugal,
are usually indexed to the Euribor.
The market value of equity (S) is straight: The number of shares is reported in
the annual accounts and the stock price at 31 December 2003. The betas were
obtained from Datastream.
The risk free rate (r) is the yield to maturity of the 10 years-Treasury Bonds,
and was obtained from Caixa Geral de Depósitos.
5. Results and Analysis
Table 1 presents the cost of debt for the sample using formula 3.2 except for the following 7 companies: Novabase, SonaeCom, Cimpor, Cofina, Portucel, Sag Gest, and Semapa. The cost of debt calculated by this method was abnormal for those companies as reported:
− The cost of debt for Novabase was 15.89%, which is abnormally high. This was probably a result of some kind of off-balance sheet financing practices. For example, in Portugal is common to offer financial discounts for advances of accounts receivable, According to accounting standards in Portugal this results in financial expense, however, there is no debt behind. Bills of exchange and promissory notes are also widely used for commercial transactions in Portugal and are usually treated as an off-balance-sheet it. Consequently, the ratio of financial expenses to debt is abnormally high for companies that use this kind of instruments. In order to avoid such an outlier it was allocated to this firm the largest cost of debt calculated in the sample;
− The cost of debt of Sonae.Com was 3.23% that is lower than the risk-free rate
of return. For a dotcom company, it would be expected a higher cost of debt. However, the accounting policy of capitalizing financial expenses or special financing deals offered by the holding may hide the true cost of debt in this company. As a consequence, this study uses a cost of debt identical to his holding company Sonae SGPS;
− For the remaining 5 companies with estimated cost of debt inferior to the
risk-free rate a spread of 0.17% was added. This spread was obtained by the
average cost of debt of the other companies in the sample and the risk-free rate of return
11 Table 1 – Cost of Debt
Companies
Cost of
debt Debt to Equity
(i) (B/E) Brisa-Nom.(Privatiz.) 4.60% 0.73 Cimpor-C.Port.SGPS-Nom. 5.57% 0.57 Cofina-SGPS 5.09% 1.33 EDP-Nom. 8.05% 1.25 Ibersol 4.84% 0.37 Impresa, SGPS - Nom. 6.46% 0.45 Jerónimo Martins-SGPS 5.08% 0.90 Novabase, SGPS - Nom. 8.63% 0.06 Pararede – SGPS 5.44% 0.50 Portucel-Nom. 5.70% 0.85 PTelecom, SGPS - Nom. 8.63% 0.59 PTMultimédia, SGPS - NOM. 5.62% 0.05 SAG GEST-Sol.Aut.Glob.SGPS 4.62% 1.78 SEMAPA-SGPS-Nom. 4.91% 1.51 SONAE SGPS 5.82% 2.77 SONAECOM, SGPS 5.82% 0.90 Teixeira Duarte 4.56% 2.99 Total 6.89% 0.86
A, B and E in euros; T em anos
The model of Hsia required these type adjustments to the cost of debt because it is inappropriate to use a cost of debt inferior to the risk-free rate. As the standard deviation of the rates of return of the firm is derived from an implicit function based on the OPM of Black and Scholes (1973), in a competitive market is not admissible that the return of a risky asset to be lower than the return of the risk-less asset. Therefore, it is apparent that the cost of debt calculated from the financial statements is inconsistent with the financial theory for some of the firms in the sample. Moreover, the regression of the cost of debt against the debt to equity ratio is not statistically significant when, according to the theory, higher financial risk would imply higher cost of debt:
Figure 1 – The cost debt and the debt equity ratio
y = -0.0055x + 0.0642 (-1.41) (12.57)* R2 = 0.1179 (0.177) t statistics in parenthesis
* statistically significant at 1% level 0.0% 1.0% 2.0% 3.0% 4.0% 5.0% 6.0% 7.0% 8.0% 9.0% 10.0% 0.00 0.50 1.00 1.50 2.00 2.50 3.00 3.50 D/E C os t of deb t
However, the business risk is missing from the previous regression. The
implicit volatility (σv), derived from the Hsia model, which signals the overall risk of
the firm is presented in the following table:
Table 2 – Implicit volatility and cost of equity
Companies Volatility Cost of equity
V σ rs Brisa-Nom. (Privatiz.) 14.65% 7.22% Cimpor-C.Port.SGPS-Nom. 25.40% 10.56% Cofina-SGPS 15.55% 9.17% EDP-Nom. 30.33% 17.75% Ibersol 22.38% 8.27% Impresa, SGPS - Nom. 33.31% 13.21% Jerónimo Martins-SGPS 18.17% 9.04% Novabase, SGPS - Nom. 66.86% 21.67% Pararede – SGPS 25.66% 10.21% Portucel-Nom. 22.94% 10.96% PTelecom, SGPS - Nom. 40.73% 19.06% PTMultimédia, SGPS – NOM. 47.35% 12.34% SAG GEST-Sol.Aut.Glob.SGPS 9.76% 7.41% SEMAPA-SGPS-Nom. 13.38% 8.57% SONAE SGPS 15.06% 12.12% SONAECOM, SGPS 23.24% 11.33% Teixeira Duarte 6.98% 7.37% Total 29.21% 14.37%
The cost of equity (rs) estimated by equation 3.1 is consistent with the financial
13 two variables is statistically significant at 1% level for both coefficients of the regression: * ) 11 . 6 ( * ) 82 . 4 ( 238 . 0 055 . 0 v s r = + ×σ (5.1) t statistics in parenthesis
* Statistically significant at 1% level
Novabase is an Information Technology company and has the highest implicit volatility of the assets (66.86%). However, Teixeira Duarte, a building construction and engineering company has the lowest implicit volatility (6.28%). This low volatility is probably inconsistent because the business of Teixeira Duarte is highly correlated with the economic cycle, which denotes a high business risk. Moreover, its debt equity ratio (2.99 in table 1) signals high financial risk. EDP, a utility company with the monopoly of electricity in Portugal, has a relatively low debt ratio, however presents one of the largest implicit volatility (table 2), which is inconsistent with its business and financial risk.
The cost of equity (table 2) varies from a minimum of 7.22% for Brisa and a maximum of 21.67% for Novabase. The average implicit volatility for the 17 companies in the sample is 29.21% and the average cost of equity 14.37%. This would result a market risk premium of 10.04% which is relatively high compared to the 4.5% to 5.5% used by most of investment banks in the country and the 6.38% estimated by Neves and Pimentel (2004).
The cost of capital for the firm (table 3) varies from a minimum of 5.27% for Teixeira Duarte and a maximum of 20.87% for Novabase. As expected, this is lower than the cost of equity.
Table 3 – Cost of capital of the firm
Companies Volatility Debt to Equity ratio rv v σ Firm’s cost of capital WACC Brisa-Nom.(Privatiz.) 14.65% 0.73 6.12% 6.12% Cimpor-C.Port.SGPS-Nom. 25.40% 0.57 8.74% 8.74% Cofina-SGPS 15.55% 1.33 6.84% 6.84% EDP-Nom. 30.33% 1.25 12.36% 12.36% Ibersol 22.38% 0.37 7.34% 7.34% Impresa, SGPS - Nom. 33.31% 0.45 11.11% 11.11% Jerónimo Martins-SGPS 18.17% 0.90 7.17% 7.17% Novabase, SGPS - Nom. 66.86% 0.06 20.87% 20.82% Pararede – SGPS 25.66% 0.50 8.62% 8.62% Portucel-Nom. 22.94% 0.85 8.54% 8.54% PTelecom, SGPS - Nom. 40.73% 0.59 15.17% 15.17% PTMultimédia, SGPS - NOM. 47.35% 0.05 12.02% 12.02% SAG GEST-Sol.Aut.Glob.SGPS 9.76% 1.78 5.62% 5.62% SEMAPA-SGPS-Nom. 13.38% 1.51 6.37% 6.37% SONAE SGPS 15.06% 2.77 7.49% 7.49% SONAECOM, SGPS 23.24% 0.90 8.72% 8.72% Teixeira Duarte 6.98% 2.99 5.27% 5.27% Total 29.21% 0.86 10.90% 10.90%
According to the financial theory, the financial and business risks have an effect on both the cost of equity and the cost of debt. Therefore, higher risks would require higher returns for investors. The Hsia model is consistency with theory, with a positive and statistically significant relationship at 1% level and a coefficient of determination of 92% (figure 2):
Figure 2 – Cost of capital of the firm
y = 0.2546x + 0.0285 (5.05)* (13.22)* R2 = 0.921
t statistics in parenthesis * statistically significant at 1% level 0.00% 5.00% 10.00% 15.00% 20.00% 25.00% 0.00% 10.00% 20.00% 30.00% 40.00% 50.00% 60.00% 70.00% 80.00% Volatility of assets C o s t o f cap it al t o t h e f ir m
15 Table 3 also exhibits the consistency between the cost of capital of the firm (equation 3.3) and the weighted average cost of capital before taxes, as mathematically demonstrated by Hsia (1991).
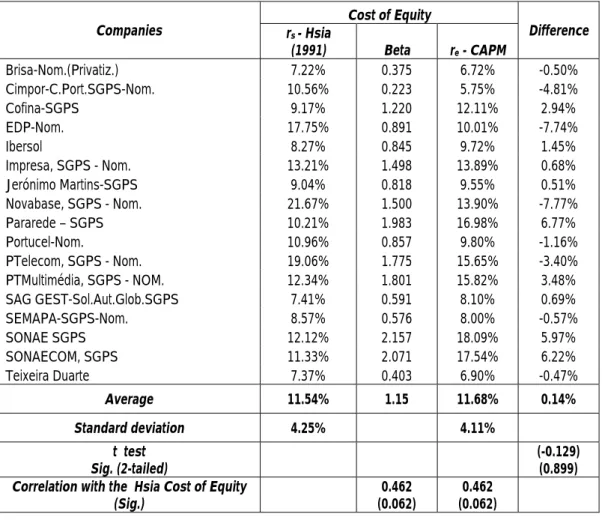
The average difference (Table 4) between the cost of equity derived from the Hsia model and CAPM (table 4) is 0.14% only. The paired sample t test evidences that the average difference is not statistically significant. However, the Pearson correlation between the costs of equity estimated by the Hsia model and the cost of equity (as well as the beta) of CAPM is 46.2% is not statistically relevant (table 4).
Table 4 – Comparison of Hsia model and CAPM cost of equity
Companies rs - Hsia Cost of Equity Difference (1991) Beta re - CAPM Brisa-Nom.(Privatiz.) 7.22% 0.375 6.72% -0.50% Cimpor-C.Port.SGPS-Nom. 10.56% 0.223 5.75% -4.81% Cofina-SGPS 9.17% 1.220 12.11% 2.94% EDP-Nom. 17.75% 0.891 10.01% -7.74% Ibersol 8.27% 0.845 9.72% 1.45% Impresa, SGPS - Nom. 13.21% 1.498 13.89% 0.68% Jerónimo Martins-SGPS 9.04% 0.818 9.55% 0.51% Novabase, SGPS - Nom. 21.67% 1.500 13.90% -7.77% Pararede – SGPS 10.21% 1.983 16.98% 6.77% Portucel-Nom. 10.96% 0.857 9.80% -1.16% PTelecom, SGPS - Nom. 19.06% 1.775 15.65% -3.40% PTMultimédia, SGPS - NOM. 12.34% 1.801 15.82% 3.48% SAG GEST-Sol.Aut.Glob.SGPS 7.41% 0.591 8.10% 0.69% SEMAPA-SGPS-Nom. 8.57% 0.576 8.00% -0.57% SONAE SGPS 12.12% 2.157 18.09% 5.97% SONAECOM, SGPS 11.33% 2.071 17.54% 6.22% Teixeira Duarte 7.37% 0.403 6.90% -0.47% Average 11.54% 1.15 11.68% 0.14% Standard deviation 4.25% 4.11% t test Sig. (2-tailed) (-0.129) (0.899)
Correlation with the Hsia Cost of Equity
(Sig.) (0.062) 0.462 (0.062) 0.462
In fact, the analysis of individual companies shows large variances between the two methods:
− The five largest differences found were Novabase, EDP, Pararede, SonaeCom and Sonae SGPS (differences superior to 5%) that coincides with those firms with inconsistent data for the cost of debt and less detailed information in the annual report concerning the service of debt, which may result in some distortion;
− There are only six companies with differences smaller than 1%
− The remaining six companies exhibit differences between 1% and 5%
The large individual differences are an indication of the inconsistencies between the two models.
The results obtained by the Hsia model are dependent on the quality of the data available concerning the service of debt, but there is also the possibility that investors have changed recently their expectations toward the risk of the firms and this changeover is not immediately capture by historical betas.
The standard deviation of the cost of equity derived from the Hsia model is 4.25%, which is slightly larger than the 4.11% of the CAPM.
Hsia (1981) demonstrated mathematically the coherence between the modern theories including the CAPM and the Option theory. Therefore, the empirical divergence found in this study is a result of the quality of the data available for each company and the potential change of expectations of investors not reflected in the historical betas. If the available data for the Hsia model is not the most appropriate it is also weird that a portfolio of 17 companies that theoretically represents the market exhibit an average beta of 1.15 instead of the expected unity. It can be argued that this portfolio does not represent the market, however these are the largest companies in
17 the market, with the highest liquidity and the blue chips of the market, and consequently we would expect a lower average beta.
This study shows that both models are affected by the quality, availability, and consistency of data, which create difficulties and limitations for the implementation of both models.
6. Conclusion
The cost of capital of the firm derived from the Hsia model and the weighted cost of capital before taxes are consistent as mathematically demonstrated by Hsia (1991).
The difference between the average cost of equity estimated by the Hsia model and the CAPM is not statistically different. However, the correlation between the two estimates is not statistically significant and at the individual level, we find large differences.
Hsia (1991) demonstrates that his model is coherent with the financial theory, however the simplifications required to get the inputs for the model generate distortions and inconsistencies in the cost of debt and implicitly in the cost of equity.
The cost of debt was estimated from the reported data (interest bearing debt and financial expenses) in the financial statements. In seven cases out of seventeen, these calculations generated cost of debt inferior to the free-rate of return, which is incoherent with the financial theory. It is apparent that this inconsistency constrained the Hsia model in estimating the cost of equity and the cost of capital for these firms as the inconsistencies on the cost of debt is directly reflected in the model, in contrast to the CAPM that is independent of the cost of debt. The improvement of the results would require detailed information of the service of debt, with respective interest rates, periodic payments, and debt maturity. However, this is the type of information
is not available in the annual accounts. In addition, the variety of reporting found concerning debt, may signal the need for some accounting reporting standardization.
As a final remark, the empirically difficulties found may explain why the Hsia model did not ascend from the theoretical ground to the world of practice.
This study was exploratory in nature. The size of the sample and the inconsistencies found in the cost of debt are two limitations to the conclusions. The application of the model to more complete markets and consistent cost of debt would be of interest to a better evaluation of the Hsia model. Other benchmarks than the CAPM could also be used in such study.
The Hsia model estimate the cost of capital of the firm or the weighted average cost of capital before taxes, however, if the model is relevant to estimate the cost of equity, than, it would be preferable to have the cost of capital of the firm after taxes.
References
Black, F. and M. Scholes (1973). The Pricing of Options and Corporate Liabilities,
Journal of Political Economy, May-June, 637-659.
Bruner, R. F., K. M .Eades, R. Harris and R.C Higgins (1998). Best Practices in
Estimating the Cost of Capital: Survey and Synthesis, Financial Practice and
Education, October, 8, 13-28.
Copeland, T. and J. Weston (1988). Financial Theory and Corporate Policy, 3rd ed.,
New York, Pearson Addison Wesley, Reading Mass.
Copeland, T., J. Weston and K. Shastri (2005). Financial Theory and Corporate
Policy, 4th ed., New York, Pearson Addison Wesley, Reading Mass.
Estrada, J. (2002). Systematic Risk in Emerging Markets: the D-CAPM, Emerging
Markets Review, 3, 365-379.
Fama, E. and K. French (1992). The Cross-section of Expected Stock Returns,
Journal of Finance, 47(2), 427-466.
Fama, E. and K. French (1995). Size and Book-to-Market factors in earnings and
19
Fama, E. and K. French (2001). The Equity Premium, Working Paper, April,
University of Chicago.
Fuller, R. and C. Hsia (1984). A Simplified Common Stock Valuation Model,
Financial Analysts Journal, September, 49-56.
Gordon, M. and E. Shapiro (1956). Capital Equipment Analysis: The Required Rate
of Profit, Management Science, October, 3, 102-110.
Graham, J.R. and C.R. Harvey (2001). The Theory and Practice of Corporate Finance:
Evidence from the Field, Journal of Financial Economics, 60, 187-243.
Hsia, C. (1981). Coherence of the Modern Theories of Finance, Financial Review,
Winter, 27-42.
Hsia, C. (1991). Estimating a Firm´s Cost of capital: An Option Pricing Approach,
Journal of Business Finance & Accounting, January, 18(2), 281-287.
Malkiel, B. (1963). Equity Yields, Growth, and Structure of Share Prices, American
Economic Review, December, 467-494.
McNulty, J., T. Yeh, W. Schulze and M. Lubatkin (2002). What is Your Real Cost of
Capital?, Harvard Business Review, October, 114-121
Merton, R. C. (1980). On Estimating the Expected Return on the Market, an
Exploratory Investigation, Journal of Financial Economics, December, 8,
323-361.
Neves, J.C. and P.M. Pimentel (2004). The Equity Risk Premium in Portugal in the
1990´s and the Merton Approach, European Review of Economics and Finance,
3(1), 41-65.
Roll, R. (1977). A Critique of the the Assets Pricing Theory’s Tests, Journal of
Financial Economics, March, 129-176.
Ross, S. A. (1976). The Arbitrage Theory of Capital Asset Pricing, Journal of
Economic Theory, 13, pp. 341-360.
Sharpe, W. (1963). A Simplified Model for Portfolio Analysis, Management Science,
January, pp. 277-293.
Sharpe, W. (1964). Capital Asset Prices: A Theory of Market Equilibrium under