In vitro
inhibitory effects of imatinib mesylate
on stromal cells and hematopoietic
progenitors from bone marrow
P.B. Soares
1, T.S. Jeremias
2, M. Alvarez-Silva
2, M.A. Licı´nio
3,
M.C. Santos-Silva
3and C.L. Vituri
4 1Laborato´rio de Ana´lises Clı´nicas, Hospital Universita´rio de Santa Maria, Universidade Federal de Santa Maria,Santa Maria, RS, Brasil 2Laborato´rio de Neurobiologia e Hematologia Celular e Molecular, Departamento de Biologia Celular, Embriologia e Gene´tica, Centro de Cieˆncias Biolo´gicas, Universidade Federal de Santa Catarina, Floriano´polis, SC, Brasil 3Laborato´rio de Oncologia Experimental e Hemopatias, Departamento de Ana´lises Clı´nicas, Centro de Cieˆncias da Sau´de, Universidade Federal de Santa Catarina, Floriano´polis, SC, Brasil 4Laborato´rio de Citologia Clı´nica, Departamento de Ana´lises Clı´nicas, Centro de Cieˆncias da Sau´de, Universidade Federal de Santa Catarina, Floriano´polis, SC, Brasil
Abstract
Imatinib mesylate (IM) is used to treat chronic myeloid leukemia (CML) because it selectively inhibits tyrosine kinase, which is a hallmark of CML oncogenesis. Recent studies have shown that IM inhibits the growth of several non-malignant hematopoietic and fibroblast cells from bone marrow (BM). The aim of the present study was to evaluate the effects of IM on stromal and hematopoietic progenitor cells, specifically in the colony-forming units of granulocyte/macrophage (CFU-GM), using BM cultures from 108 1.5- to 2-month-old healthy Swiss mice. The results showed that low concentrations of IM (1.25mM) reduced
the growth of CFU-GM in clonogenic assays. In culture assays with stromal cells, fibroblast proliferation anda-SMA expression by immunocytochemistry analysis were also reduced in a concentration-dependent manner, with a survival rate of approximately 50% with a dose of 2.5mM. Cell viability and morphology were analyzed using MTT and staining with acrydine orange/ethidium bromide. Most cells were found to be viable after treatment with 5mM IM, although there was gradual growth inhibition of fibroblastic cells while the number of round cells (macrophage-like cells) increased. At higher concentrations (15mM), the majority of cells were apoptotic and cell growth ceased completely. Oil red staining revealed the presence of adipocytes only in untreated cells (control). Cell cycle analysis of stromal cells by flow cytometry showed a blockade at the G0/G1phases in groups treated with 5-15mM. These results suggest that IM differentially inhibits the survival of different types of BM cells since toxic effects were achieved.
Key words: Bone marrow stromal cell; Hematopoietic progenitors; Imatinib mesylate; Myelosuppression
Introduction
Bone marrow (BM) is composed of functional stroma made up of many cell types and an extracellular matrix, which together form an ideal microenvironment that favors the modulation of quiescence, self-renewal, and commit-ment of mesenchymal stem cells (MSCs) and the proliferation, differentiation, and apoptosis of hematopoie-tic cells. These functions correlate with different cell types in the stroma, which consists mainly of macro-phages, endothelial cells, fibroblasts, and adipocytes (1). When grown in culture, fibroblasts from different organs are consistently modulated into myofibroblast-like cells
with varying degrees of alpha-smooth muscle actin (a-SMA) expression (2). These cells can secrete growth factors, including transforming growth factor, platelet-derived growth factors (PDGF), basic fibroblast growth factor (bFGF), hepatocyte growth factor, keratinocyte growth factor, stem cell factor (SCF), epithelial growth factor (EGF), granulocyte/macrophage colony-stimulating factor (GM-CSF), and other cytokines (3). Bone marrow adipocytes mechanically exert hematopoietic control, which in turn controls the increase in marrow fat inclusions, since the acceleration of hematopoiesis is
Correspondence: P.B. Soares, Labora´torio de Ana´lises Clı´nicas, Hospital Universita´rio de Santa Maria, Universidade Federal de Santa Maria, Av. Roraima, 1000, 97105-900, Bairro Camobi, Santa Maria, RS, Brasil. E-mail: [email protected]
associated with the loss of fat vacuoles, increasing the physical space required for growth (4). Since these cell types are derived from MSCs resident in BM, the rapid rate of cell renewal and differentiation makes the hematopoietic system a target for antineoplastic therapy (5), which can result both from direct drug effects on hematopoietic progenitors (6) and from marrow toxicity (5) due to effects on BM stromal cells.
Imatinib mesylate (IM) is an oral anticancer agent used primarily to treat chronic myeloid leukemia (CML), and has selective activity against a small number of tyrosine kinases, including the BCR-ABL1 oncogene (present in the Philadelphia (Ph) chromosome), c-Kit, c-Abl, and PDGF receptor. IM acts as a competitive inhibitor by binding with high affinity to the ATP binding site in the kinase domains of these targets. This leads to the inhibition of the phosphorylation of tyrosine residues of the target protein in the signal transduction pathway and, consequently, the excessive cell proliferation occurring in CML is interrupted and apoptosis is induced (7). Blocking the site of action is also the mechanism by which IM interrupts the signaling exacerbated in cells with a c-Kit mutation, which is common in gastrointestinal stromal tumors (GISTs) (8).
At the current standard dose of IM for CML in the chronic phase (400 mg), peak plasma levels at steady state were approximately 4.6mM and trough levels approximately 2.1mM, with a half-life of 19.3 h (9). Some studies, however, have reported higher plasma levels (10). The maximal recommended dose is 800 mg/ day. However, in these patients the high-dose IM (800 mg/day) may be more effective than standard-dose IM (400 mg/day) (11). Initially approved at doses of 400 and 600 mg daily for advanced GIST patients, the use of high-dose IM (800 mg daily) has been shown to benefit patients with advanced or metastatic GIST that pro-gresses while on the standard dose, and has been recommended under these circumstances by the major management guidelines (12). There are few in vitro
studies that use IM at plasma concentrations achieved with doses of 800 mg/day (10), but it is known that in some cases in which a patient has achieved good hematologic control but has failed to achieve or has lost a cytogenetic response, dose escalation may increase the degree of Ph negativity (13). The duration of exposure of CD34+cells to IM showed a greater effect with prolonged
exposure (14).
While it was initially reported that IM minimally affected normal hematopoiesis, recent studies have shown that IM can inhibit the growth of some non-malignant hematopoietic cells. It was demonstrated that IM may affect the mobilization, proliferation, and differentiation of hematopoietic progenitor cells resulting in myelosuppression in patients receiving treatment. The reversible side effects of IM are dose-dependent and affect all hematopoietic lineages, albeit to varying degrees
(15). Data from GIST patients suggest that IM directly suppresses normal hematopoiesis under the assumption that the disease itself has no effect on normal hematopoi-esis in these patients. In a phase II study of patients with GIST or other soft tissue sarcomas who received 400 mg IM daily, 92% of patients displayed anemia and 47% displayed granulocytopenia (16).
Several studies have described the use of IM, in addition to CML and GIST, as a possible new therapy for fibrotic diseases (17) and for diseases that require an angiogenic stimulus (18). With the possibility of IM use for many other non-hematological diseases, assessment of its myelosuppressive effects has become important and necessary in order to determine the proper use and prescription of this drug. However, only a few recent studies have investigated the normal BM stroma of animal or human origin (19) after IM treatment, while most have focused mainly on patients with CML in complete cytogenetic response (20).
In this study, we used healthy murine BM as a model of the hematopoietic microenvironment to study the effects of IM on marrow stromal and hematopoietic cells, specifically in the colony-forming units (CFU)-GM.
Material and Methods
Collection of BM cells from mice
Bone marrow cells were harvested from 16 femurs (8 animals/protocol) of 1.5- to 2-month-old male Swiss mice (Mus musculus) killed by cervical dislocation by inserting a 21-gauge needle into the shaft of the bone and flushing it with Iscove’s modified Dulbecco’s medium (IMDM; Sigma-Aldrich, USA) containing 10% fetal bovine serum (FBS; Gibco, USA), 0.5mM hydrocortisone, 10,000 U/mL penicillin, and 10,000mg/mL streptomycin. The study was approved by the Ethics Committee of Universidade Federal de Santa Catarina and was conducted on a total number of 108 mice.
Preparation of imatinib besylate
Stock solutions of 10 mM IM were prepared by dissolving IM (GleevecH, Novartis, Switzerland) in a solution of dimethyl sulfoxide and Mili-Q water (1:1) and stored at -20
˚
C.Clonogenic assay of hematopoietic progenitor cells
1.25% agar, 0.1 mL mononuclear cells in BM (16 105 mononuclear cells/mL), 0.1 mL GM-CSF (5 ng/mL; Sigma-Aldrich), and various amounts of IM (1.25-25mM). All experiments were performed in triplicate. Cells cultured without the drug were used as the control group for the experiments. The plates were incubated for 7 days at 37
˚
C in a humid atmosphere containing 5% CO2. After this period, the number of colonies was counted by light microscopy and colony morphology was assessed after staining with May-Gru¨nwald and Giemsa. Cells were considered to have formed a colony when consisting of more than 50 cells, and 10-50 cells were considered to be a cluster.Culture of BM stromal cells
Originally investigated for their role in the formation of hematopoietic cell microenvironment in BM, MSCs and mesenchymal progenitors have the ability to differentiate into cell types phenotypically unrelated to the cells of their tissue of origin. Due to the large number of similar terms and definitions used (21), we chose to use the term ‘‘bone marrow stromal cell’’, encompassing all types of cells that are present in the microenvironment of BM (except hematopoietic cells) and that grow and are adherent in culture. We cannot refer to MSCs because we did not perform tests to prove this assertion, but these are cells derived from MSCs.
The cells obtained from BM were cultivated in IMDM and maintained in culture on 24-well plates or in 75-cm2 culture flasks. The number of cells used was 26 106 cells?1 mL-1?well-1and 66107cells?30 mL-1?flask-1. The plates and flasks were incubated for 14 days at 37
˚
C in a humid atmosphere containing 5% CO2, and were per-mitted to reach 70-80% confluence. Routine maintenance culture was performed every 3-4 days, when half the volume of the supernatant was removed and replaced with an equal volume of IMDM with IM. This technique assured that suspended hematopoietic cells were removed from the culture medium and only the BM stromal cells adherent to plates/flasks were cultivated. Cells cultured without the drug were used as control. The following experiments were carried out on these cultures: 3,-[4,5-dimethylthiazol-2-yl]-2,5-diphenyltetrazolium bro-mide (MTT), cytochemistry oil red O, cell cycle, fluores-cence of acrydine orange/ethidium bromide (AO/EB), immunocytochemistry for BrdU, and a-SMA. Cultures were evaluated morphologically in parallel after staining with May-Gru¨nwald and Giemsa.MTT assay for cell viability
Cell viability was determined using MTT, which is an indicator of mitochondrial function. Cells were incubated for 14 days as described above, without IM (control group) and with 5-25mM IM. After this period, the supernatant from culture wells was removed and IMDM with a 10% MTT solution (Sigma-Aldrich; 5 mg/mL in PBS) was
added. After 3 h of incubation at 37
˚
C, the supernatant was removed. The precipitates formed in each well were dissolved in an acid solution of isopropanol (0.04 N HCl) and the supernatant was transferred to a 96-well plate. The absorbance spectrum was determined using a Microwell Systems spectrophotometer (Organon Teknika, Belgium) at a wavelength of 540 nm. The absorbance of the control group (cells without treatment) was considered to correspond to 100% viability.AO and EB fluorescence staining of viable cells and apoptotic cells
Like the MTT test, AO and EB fluorescence also reveal viable cells, and allow visualization of the morphol-ogy of these cells beyond the specific staining of cells in the apoptotic process. Apoptotic cells were visualized using two fluorescent dyes: AO, which is permeable to the membrane, and EB, which is impermeable. First, the cells were cultured on circular coverslips 13 mm in diameter for 14 days without IM (control group) and with 5-20mM IM (experimental group). After this period, the circular coverslip was placed on a microscope slide. The reagent was prepared at the time of the test by mixing equal volumes of AO (10 mg/mL) and EB (10 mg/mL). The coverslip with cells and fluorescent dyes was covered with another coverslip and incubated for 10 min at room temperature (RT). The slides were observed under an Olympus BX41 immunofluorescence microscope and photographed.
Cytochemistry to identify adipocytes
For the identification of adipocytes in culture, staining was performed using oil red O, a soluble dye. After 14 days of incubation without IM and with 2.5-25mM IM, whole culture medium was removed. The wells were washed twice with PBS 7.4 and the cells were fixed with 500mL 10% formalin/well and incubated at RT for 30 min. Formalin was then removed and the cells were washed twice with PBS 7.4. Next, 200mL 0.3% solution of oil red O (Sigma-Aldrich)/isopropanol diluted with distilled water (3:2) was added to each well and incubated for 10 min at RT. The dye was then removed and the cells were quickly washed with 60% isopropanol followed by washing with distilled water until excess dye was completely removed. After drying, the cells were visualized with the Olympus CX21 light microscope and photographed.
Cell cycle analysis
(Sigma-Aldrich) and stirred for about 5 min. Trypsin was then inactivated by adding 2 mL IMDM containing FBS. The PI/RNase procedure was performed according to the instructions of the kit. Briefly, the washed cells were fixed with 200mL 70% ethanol and incubated for 30 min at a temperature of -4
˚
C. The cells were then washed twice in PBS containing 2% bovine serum albumin and centrifuged at 300g for 10 min. Subsequently, 500mL PI containing RNase was added to the cell pellet for 15 min at RT. The analysis was performed using the BD FacsCalibur flow cytometer (Becton Dickinson Immunocytometry Systems, USA) and the BD CELLQuestTM software. The negative control was pre-pared with cells without drug treatment for the character-ization of the parameters to be analyzed by flow cytometry. To draw the histograms of the cell cycle, at least 10,000 living cells were necessary. The histograms were analyzed with WinMDI 2.8 (data not shown) and the results are presented in Table 1.Cell proliferation anda-SMA expression
The proliferation of cultured cells was evaluated by testing the incorporation of BrdU, a thymidine analogue, into the DNA of proliferating cells during the S phase of the cell cycle. The presence ofa-SMA was used for the identification of fibroblasts because, when grown in culture, fibroblasts from different organs change to myofibroblasts and show various degrees of expression of a-SMA. After 14 days of culture, according to the protocol for cultivation of BM stromal cells without IM (control group) and with 5-25mM IM, cells were incubated for 24 h in a 5% CO2 incubator with 1mg/mL BrdU (Invitrogen, USA). After incubation, cells were fixed with 4% paraformaldehyde for 30 min at RT. Next, the cells were washed twice with distilled water and incubated with 2 N HCl for 30 min at 37
˚
C. Cells were rinsed 3 times with PBS 7.4 and cell membranes were permeabilized with 0.25% PBS-Triton X-100 for 30 min at RT.Nonspecific sites were blocked with 5% FBS for 40 min, and the cells were subjected to an immunocytochemical reaction using specific primary and secondary antibodies. Incubation with primary antibodies (anti-BrdU IgG1 1:100, Calbiochem, Germany; anti-a-SMA IgG2a 1:800, Sigma-Aldrich) was performed for 1 h at RT. Cells were then washed 3 times in 0.05% PBS-Tween 20 and incubated for 1 h with secondary antibodies (anti-mouse IgG1, TxRd, 1:75, and anti-mouse IgG2a, FITC, 1:75; Southern Biotech, USA). After 3 further washes with PBS-Tween, cells were incubated with the nuclear stain DAPI (50 ng/mL; Sigma-Aldrich) for 15 s at RT for analysis of total cell nuclei. Fluorescent staining was observed and photographed using the epifluorescence microscope Olympus BX 40. BrdU, DAPI and a-SMA were simultaneously viewed in cells using different microscope filters. All fields were photographed, i.e., the total area of the well culture was photographed. Fields already photographed acquire a change in the fluorescent color; therefore, the fields are not observed more than once. The overlay of images was performed using a picture editor software.
Statistical analysis
Data are reported as means ± SEM. One-way analysis of variance (ANOVA) with the Tukey post hoc
test was performed for statistical analysis. The calcula-tions and graphs were performed and generated using the Statistica 6.0 software (StatSoft Inc., USA). P values ,0.05 were considered to be statistically significant.
Results
Effects of IM on CFU-GM hematopoietic progenitor cells
Cultured BM mononuclear cells were analyzed using an inverted microscope and the presence of colonies composed of granulocytes and/or macrophages was confirmed. As shown in Figure 1, IM inhibited the formation of CFU-GM (CFU-G/CFU-M) colonies at low concentrations (1.25mM), with approximately 22% inhibi-tion compared to the control group (100%), maintaining a similar inhibitory profile at concentrations up to 20mM. Moreover, with respect to morphology, there was a gradual decrease in the size of CFU-GM colonies (Figure 2).
Morphology of BM stromal cells
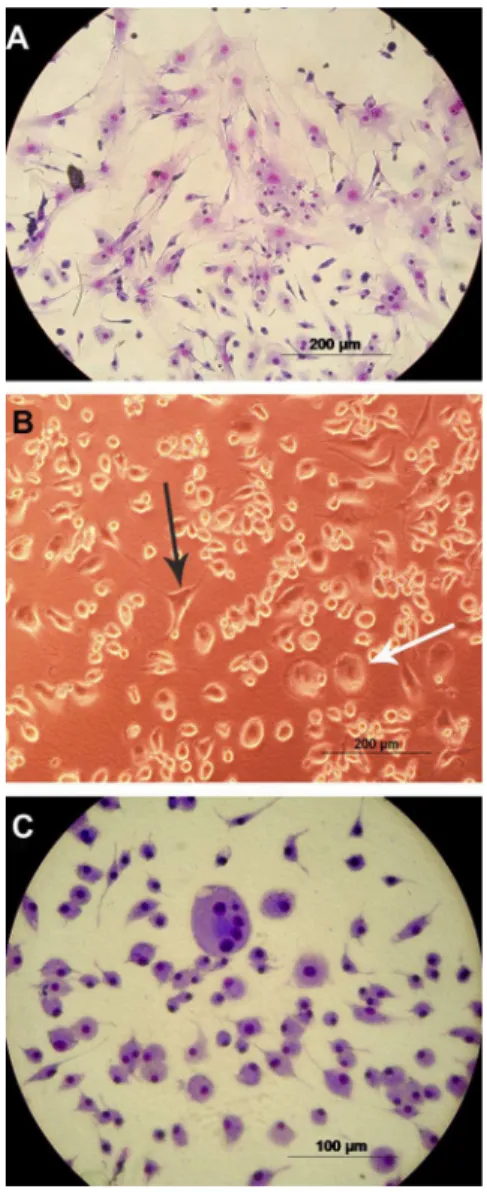
After culture with IM for 14 days, mouse BM stromal cells showed an apparent change in general morphology (Figure 3). Many cells in the control group showed fibroblastic features, large nuclei, and an abundant and elongated cytoplasm (Figure 3, Panel A). The cultures treated with IM gradually presented round cells with smaller nuclei and less abundant cytoplasm, features suggestive of macrophages (Figure 3, Panels B and C). Table 1. Effects of imatinib mesylate (IM) on the cell cycle
phases of bone marrow stromal cells of mice.
Cells detected
IM (mM) G0/G1 S G2/M
Control 67.21 ± 0.91 20.29 ± 4.81 12.5 ± 3.9 5 77.72 ± 3.90 15.88 ± 8.72 6.4 ± 4.8 10 86.73 ± 3.36 7.76 ± 0.03 5.5 ± 3.4 15 90.21 ± 8.09 6.44 ± 2.38 3.35 ± 4.03
20 # # #
This general morphological modification progressed in a concentration-dependent manner.
MTT assay for cell viability
The MTT test was performed to assess the viability of BM stromal cells incubated for 14 days with 5-25mM IM. At doses of 5 and 10mM IM the number of viable cells increased by 18 and 73%, respectively, compared to the control group (100%). However, after incubation with 15mM IM, this percentage fell to 89%, and with 25mM no cells were viable (Figure 4).
Cell viability and apoptotic cells - AO/EB
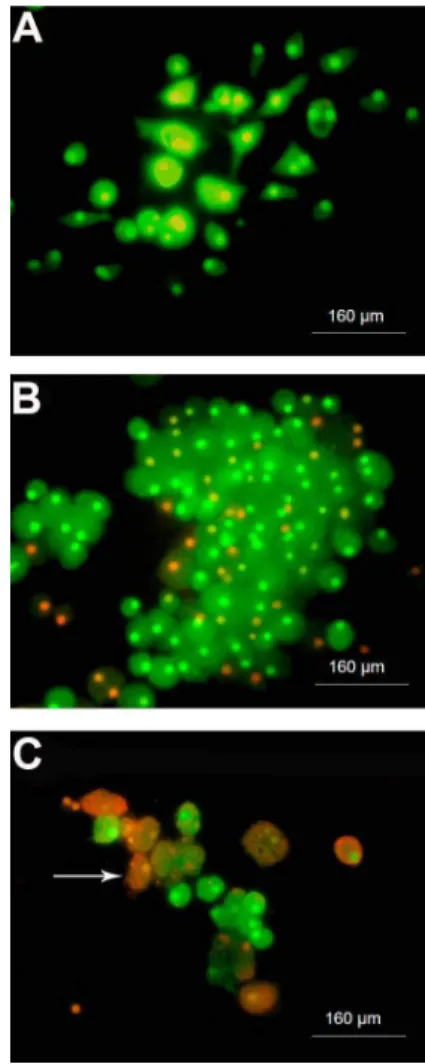
The number of viable BM stromal cells from mice decreased with higher IM concentrations (15-25mM), as demonstrated by the MTT assay. As seen in Figure 5, the control group (Panel A) almost universally showed a greenish color, which is indicative of viable cells. Panels B and C illustrate that cells incubated with 10 and 20mM IM, respectively, had some orange color, primarily in the
nucleus, which is characteristic of apoptotic cells. In cultures treated with IM, there were more rounded cells (macrophages-like) along with the presence of apoptotic cells. At 10mM IM (Figure 5, Panel B), there were greater numbers of cells compared to control, but a considerable number of them were entering apoptosis (orange color only in the nucleus). At 20mM (Figure 5, PanelC) there were few cells in general, and many apoptotic cells, some containing apoptotic bodies. At 25mM IM there were no cells.
Cytochemistry for the identification of adipocytes
As shown in Figure 6, the adipose cells showed reddish lipid vacuoles of varying sizes inside the cytoplasm. At concentrations of 2.5-25mM, IM had a 100% inhibitory effect on adipose cells and only the control group contained cells with lipid content revealed by oil red O staining (Figure 6, Panels A and B), a result repeatedly observed in experiments performed under the same conditions. Quantitative analysis was not performed since the inhibition was complete.
Cell cycle
As shown in Table 1, IM caused a progressive increase in the number of BM stromal cells in the G0/G1 phase of the cell cycle compared to control and conse-quently reduced the number of cells in the S/G2/M phases. Note that even with 5mM IM, only 50% of cells (compared to control) were entering mitosis. The greatest blocking effect was observed in the G0/G1phase of the cell cycle with an IM concentration of 15mM.
Assessment of cell proliferation by BrdU incorporation
The proliferation of BM stromal cells from mice was evaluated by testing BrdU incorporation (nuclei with red color) and the total number of cells was identified by staining with DAPI (nuclei with blue color). The percen-tage of proliferating cells (Figure 7) was obtained by quantifying cells in the photographed fields (Figure 8) and comparing the count to the control group. Figure 7 shows that IM caused a significant decrease in cell proliferation, a reduction of approximately 50, 80, 95, and 100% at con-centrations of 2.5, 5.0, 7.5 to 15, and 20mM, respectively.
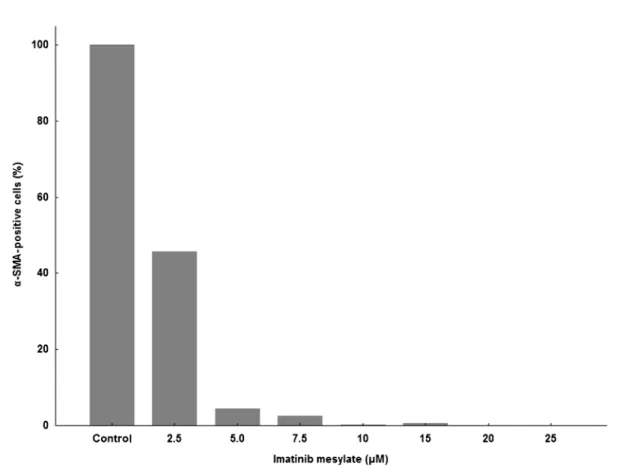
Evaluation ofa-SMA expression
a-SMA positivity (Figure 9) was determined by counting all a-SMA-positive cells (green cells) treated with IM present in each culture well (Figure 8) and compared to the control group. Figure 9 shows that there was a large decrease in the amount of cells expressinga -SMA in the treated groups. IM caused a decrease in the expression of a-SMA in the stromal cells to 45.74 and
2.51% at concentrations of 2.5 and 7.5mM, respectively, and completely inhibited expression at 10mM. By over-laying the images, it was discovered that most a -SMA-positive cells were also -SMA-positive for BrdU, confirming the anti-proliferative effect of IM in fibroblasts.
Ratio of fibroblastic cells and round cells
By quantifying cells with nuclei stained with DAPI and the overlap ofa-SMA-positive cells, a clear difference in the size of the nucleus was observed between cells with characteristics of fibroblastic cells and round cells. Initially, the control exhibited 5.45 times more round cells than fibroblastic cells. As shown in Table 2, this rate Figure 3.Morphology of the cells in the bone marrow of mice after cultivation with imatinib mesylate (IM).A, Control cells stained with May-Gru¨nwald and Giemsa;B, cells treated with 5mM IM;C, cells treated with 10mM IM stained with May-Gru¨nwald and Giemsa. The black arrow indicates cells with fibroblastoid features and the white arrow indicates round cells.
greatly increased in a dose-dependent manner due to an increase in the number of round cells at the expense of decreasing numbers of fibroblast cells, a fact evident in Figures 3 and 8.
Discussion
Bone marrow stromal cells appear to regulate the survival, self-renewal, migration, and differentiation of hematopoietic stem cells through several mechanisms, including cell contact interactions or the production of growth factors, chemokines, and extracellular matrix molecules. Four main cell types of the marrow stromal tissue are known to take part in supporting hematopoiesis: one is of hematopoietic origin (macrophages), whereas the others derive from MSCs (reticular/fibroblastic cells, adipocytes, and osteoblasts) (22). Due to the constant renewal of blood cells, the hematopoietic progenitors/ precursors exhibit a high proliferation rate, rendering this system very susceptible to the actions of anticancer drugs, which may directly or indirectly affect hemato-poiesis (23,24).
The observation of the anti-proliferative effects of IM in BCR-ABL1-negative hematopoietic cells is supported by observations in patients with Ph-negative myeloprolifera-tive disorders who were successfully treated with IM (23,24). Holtz et al. (14) suggested that IM acts mainly by inhibiting the growth of committed progenitor cells (CFCs) and this inhibitory effect increases significantly with prolonged exposure through mechanisms not dependent on BCR-ABL1. In our study, IM reduced the growth of CFU-GM colonies from doses as low as 1.25mM (Figure 1) and a decrease in colony size was observed, featuring colonies with ever fewer cells in a concentration-dependent manner (Figure 2).
Imatinib mesylate selectively inhibits SCF receptor c-Kit cell signaling. Although SCF itself does not promote colony formation in vitro, it works in synergy with other growth factors such as GM-CSF, G-CSF, IL-3, IL-6, IL-7, and Epo to stimulate formation of both differentiated progenitor cells and more primitive multilineage progenitor cells of myeloid and erythroid lineages (25). The decrease seen in the CFU-GM clonogenic assay can perhaps be explained by IM c-Kit blocking effects.
In order to assess the viability and morphology of stromal cells, we performed both MTT and AO/EB assays. The results were consistent with those observed by light microscopy, showing a change in the total morphology of adherent cells. In untreated cells (Figure 3, Panel A; Figure 5, Panel A) and cells treated with lower concentra-tions of IM (5mM; Figure 3, Panel B), the predominant morphology was typically fibroblastic. At 10mM, an increase was observed in the number of rounded cells with a considerable number of cells entering apoptosis (orange color only in the nucleus) (Figure 3, Panel C; Figure 5, Panel B). The decrease in cell viability was observed only with high concentrations of IM (15-25mM). At 20mM (Figure 5, Panel C) there were few cells in general and many apoptotic cells, some containing apoptotic bodies. The evaluation of the results of the MTT and AO/EB assays suggests that cell viability showed a peak (Figure 4) due to the increased number of rounded cells, indicating a possible proliferative effect of IM on these cells, herein referred to as macrophage-like cells (also seen in Figure 8, Panels H and J, with DAPI), and an opposite effect on fibroblast cells confirmed by expression ofa-SMA (Figure 8, Panels C, F, I, and K). These results can be related to the data in Table 2, which shows that there was a progressive increase in the ratio of round cells to fibroblastic cells. At the 10mM dose of IM, the number of round cells was 383 times higher than the number of fibroblast cells, and was reduced only at high concentrations (15-25mM IM).
In accordance with other studies (26,27), the evalua-tion of the cell cycle of BM stromal cells with IM showed the blocking of cells in the G0/G1 phases (67.21% in controls and up to 90.21% with 15mM IM) and a decreased percentage of cells that were in the S (20.29% in controls and up to 6.44% with 15mM IM) and G2/M phases (12.5% in controls and up to 3.35% with 15mM IM) (Table 1). The decrease in cells in the S phase Figure 5.Cytomorphological alterations of bone marrow stromal
cells from mice treated with imatinib mesylate (IM).A, Control; B, 10mM IM;C, 20mM IM. Viable cells showed green fluorescent staining (acrydine orange) and apoptotic cells exhibited orange staining (ethidium bromide; white arrow).
is consistent with the results of BrdU staining (Figure 7), since BrdU is only incorporated into the nucleus of cells that are undergoing proliferation. In this study, we did not assess the mechanisms involved in blocking the cell cycle; however, the blockade in G0/G1 can lead to apoptosis (seen by the presence of apoptotic bodies stained with EB) (Figure 5, Panel C). In addition, there is a decrease in cells undergoing the mitotic process.
According to Vittal et al. (28), IM induces a concentra-tion-dependent inhibition of fibroblast proliferation with almost complete inhibition at 20mM. In our study, the proliferation of stromal cells decreased gradually in the presence of IM (Figure 7), reaching 50, 80, 95, and 100% inhibition at concentrations of 2.5, 5.0, 7.5 to 15, and 20mM, respectively. Confirming the anti-proliferative effects of IM on fibroblasts, the expression ofa-SMA, a myofibroblast marker, in the BM stromal cells on day 14 was strongly inhibited (Figure 9). At 2.5mM, the expres-sion was reduced by approximately half, at 7.5mM IM, it decreased to 2.51%, and was almost completely inhibited at 10mM. By overlapping the images (Figure 8, Panels C, F, I, and K), we noted that most cells expressinga-SMA
with large nuclei were also in the process of proliferating (BrdU-positive), an event that occurred in the absence, or at very low concentrations, of IM.
It has been demonstrated in the literature that the presence of adipose cells in culture is associated with increased survival of the hematopoietic system, which can serve as a positive indicator of the culture success in maintaining primordial cells (29). Our results demon-strated that adipocytes stained with oil red O only in the control cultures of BM stromal cells (Figure 6, Panels A and B), suggesting that IM has an effect on the differentiation of stromal cells into adipocytes or, perhaps, induces apoptosis of pre-existing adipocytes.
tissues have shown that local proliferation plays a significant role in the renewal and maintenance of many types of macrophages, whereas in some cases the recruitment of circulating precursors has little or no role (31). Based on these considerations, there may be a local proliferation of macrophages in tissues, and it is believed that this explains the effects occurring in stroma cultures treated with 10-15mM IM, as can be seen in Figures 3 (Panel C), 5 (Panel B), and 8 (Panels I and K), where there was an increase of cells morphologically similar to macrophages at the expense of cells with fibroblastic features. If there was proliferation of macrophage-like cells, it would not have occurred on the 14th day of culture
since proliferation assessed by BrdU showed a large decrease in a concentration-dependent manner even at lower IM concentrations. This method evaluates the number of cells that proliferate within 24 h after incubation with BrdU.
chemotherapy/radiotherapy (15), in addition to the direct effect on hematopoietic progenitors involved in myelo-suppression. Imatinib mesylate may interfere with the homing of transplanted stem cells by damaging the BM microenvironment of patients previously treated with IM and increase the side effects such as myelosuppression
and liver toxicity (32), although there are studies that contradict this hypothesis.
Imatinib mesylate is also being tested for the treat-ment of several diseases with beneficial results. Studies have shown that IM is a potent inhibitor of PDGF-b
signaling and proliferation of fibroblasts and has, there-fore, been proposed as a potent antifibrotic therapeutic agent that may not only halt the progression but also induce the regression of tissue fibrosis (17,33-36). Imatinib has also demonstrated antiangiogenic effects through inhibition of angiogenesis induced by vascular endothelial growth factor (VEGF), bFGF and PDGF in vivo, and by inhibition of tumor growth (18). In previous studies, our group demonstrated that IM acts to decrease the production of reticular fibers produced by stromal cells, suggesting a main activity in fibroblasts. Furthermore, we observed a correlation between fibrosis and vascularization of BM and cytogenetic response in patients with CML (37).
The effects of IM on different cell types, likely through mechanisms of inhibition of the PDGF receptor and a series of growth factors and cytokines (VEGF, bFGF, IL-6, and IL-8) that are also directly or indirectly affected by IM, may have influenced the results obtained here. For Figure 9.Quantification of alpha-smooth muscle actin (a-SMA)-positive cells. Bone marrow stromal cells of mice were cultured for 14 days and subjected to immunocytochemical reaction to verifya-SMA expression. Data are reported as percentage in relation to the control group (100%).
Table 2.Ratio of fibroblastic cells to round cells of bone marrow stromal cells from mice.
IM (mM) Round cells/fibroblastic cells
Control 5.45
2.5 21.51
5.0 41.15
7.5 68.76
10 383.63
15 80.71
20 45
25 0
instance, low levels of growth factors in culture medium alone can induce a decrease in the number of fibroblast cells; however, the low levels of growth factors could be a consequence of the decrease in fibroblasts.
This study demonstrates the inhibitory effect exerted by IM on different cell types present in the BM, represented by hematopoietic cells by inhibiting the growth of CFU-GM, as well as in stromal cells, acting
mainly on fibroblasts and adipocytes. These data suggest that IM is more effective on stromal cells than on hematopoietic cells. Thus, in view of the numerous studies that have been performed, the present investiga-tion demonstrates the importance of knowing the effects of IM on non-leukemic cells, since it is a drug used as first-line therapy, for prolonged use in CML and GIST, and is being tested in various other Ph-negative pathologies.
References
1. Hubin F, Humblet C, Belaid Z, Lambert C, Boniver J, Thiry A, et al. Murine bone marrow stromal cells sustainin vivothe survival of hematopoietic stem cells and the granulopoietic differentiation of more mature progenitors.Stem Cells2005; 23: 1626-1633, doi: 10.1634/stemcells.2005-0041.
2. Hinz B, Celetta G, Tomasek JJ, Gabbiani G, Chaponnier C. Alpha-smooth muscle actin expression upregulates fibro-blast contractile activity.Mol Biol Cell2001; 12: 2730-2741. 3. Powell DW, Mifflin RC, Valentich JD, Crowe SE, Saada JI, West AB. Myofibroblasts. I. Paracrine cells important in health and disease.Am J Physiol1999; 277: C1-C9. 4. Anjos AR, Alvares-Silva M, Borelli P. Matriz extracelular e
leucemia.Rev Bras Hematot Hemoter2000; 22: 404-412. 5. Parent-Massin D. Relevance of clonogenic assays in
hematotoxicology. Cell Biol Toxicol 2001; 17: 87-94, doi: 10.1023/A:1010906104558.
6. Pessina A, Albella B, Bayo M, Bueren J, Brantom P, Casati S, et al. Application of the CFU-GM assay to predict acute drug-induced neutropenia: an international blind trial to validate a prediction model for the maximum tolerated dose (MTD) of myelosuppressive xenobiotics.Toxicol Sci2003; 75: 355-367, doi: 10.1093/toxsci/kfg188.
7. Druker BJ, Talpaz M, Resta DJ, Peng B, Buchdunger E, Ford JM, et al. Efficacy and safety of a specific inhibitor of the BCR-ABL tyrosine kinase in chronic myeloid leukemia. N Engl J Med 2001; 344: 1031-1037, doi: 10.1056/ NEJM200104053441401.
8. Joensuu H, Roberts PJ, Sarlomo-Rikala M, Andersson LC, Tervahartiala P, Tuveson D, et al. Effect of the tyrosine kinase inhibitor STI571 in a patient with a metastatic gastrointestinal stromal tumor. N Engl J Med 2001; 344: 1052-1056, doi: 10.1056/NEJM200104053441404. 9. Peng B, Hayes M, Racine-Poom A, Druker B. Clinical
investigation of the pharmacokinetic/pharmacodynamic relationship for Glivec (STI571): a novel inhibitor of signal transduction. Proc Am Soc Clin Oncol 2001; 20: 280, (Abstract).
10. Peng B, Hayes M, Resta D, Racine-Poon A, Druker BJ, Talpaz M, et al. Pharmacokinetics and pharmacodynamics of imatinib in a phase I trial with chronic myeloid leukemia patients. J Clin Oncol 2004; 22: 935-942, doi: 10.1200/ JCO.2004.03.050.
11. Cortes J, Giles F, O’Brien S, Thomas D, Garcia-Manero G, Rios MB, et al. Result of high-dose imatinib mesylate in patients with Philadelphia chromosome-positive chronic myeloid leukemia after failure of interferon-alpha. Blood 2003; 102: 83-86, doi: 10.1182/blood-2003-01-0025. 12. Gronchi A, Blay JY, Trent JC. The role of high-dose imatinib
in the management of patients with gastrointestinal stromal
tumor. Cancer 2010; 116: 1847-1858, doi: 10.1002/ cncr.24944.
13. Marin D, Marktel S, Bua M, Armstrong L, Goldman JM, Apperley JF, et al. The use of imatinib (STI571) in chronic myelod leukemia: some practical considerations. Haematologica2002; 87: 979-988.
14. Holtz MS, Slovak ML, Zhang F, Sawyers CL, Forman SJ, Bhatia R. Imatinib mesylate (STI571) inhibits growth of primitive malignant progenitors in chronic myelogenous leukemia through reversal of abnormally increased pro-liferation. Blood 2002; 99: 3792-3800, doi: 10.1182/ blood.V99.10.3792.
15. Appel S, Balabanov S, Brummendorf TH, Brossart P. Effects of imatinib on normal hematopoiesis and immune activation.Stem Cells2005; 23: 1082-1088, doi: 10.1634/ stemcells.2005-0069.
16. Verweij J, van Oosterom A, Blay JY, Judson I, Rodenhuis S, van der Graaf W, et al. Imatinib mesylate (STI-571 Glivec, Gleevec) is an active agent for gastrointestinal stromal tumours, but does not yield responses in other soft-tissue sarcomas that are unselected for a molecular target. Results from an EORTC Soft Tissue and Bone Sarcoma Group phase II study.Eur J Cancer2003; 39: 2006-2011, doi: 10.1016/S0959-8049(02)00836-5.
17. Akhmetshina A, Venalis P, Dees C, Busch N, Zwerina J, Schett G, et al. Treatment with imatinib prevents fibrosis in different preclinical models of systemic sclerosis and induces regression of established fibrosis.Arthritis Rheum 2009; 60: 219-224, doi: 10.1002/art.24186.
18. Buchdunger E, O’Reilly T, Wood J. Pharmacology of imatinib (STI571).Eur J Cancer2002; 38 (Suppl 5): S28-S36, doi: 10.1016/S0959-8049(02)80600-1.
19. Melzer D, Neumann U, Ebell W, Seeger K, Neuhaus P, Gaedicke G, et al. Imatinib mesylate (STI571) considerably affects normal human bone marrow stromal cell growthin vitro.Blood2004; 104a.
20. Sanchez-Guijo FM, Hernandez JM, Lumbreras E, Morais P, Santamaria C, Garcia JL, et al. Effects of imatinib mesylate on normal bone marrow cells from chronic myeloid leukemia patients in complete cytogenetic response.Leuk Res2009; 33: 170-173, doi: 10.1016/j.leukres.2008.07.014.
21. Bianco P, Robey PG, Simmons PJ. Mesenchymal stem cells: revisiting history, concepts, and assays. Cell Stem Cell2008; 2: 313-319, doi: 10.1016/j.stem.2008.03.002. 22. Dazzi F, Ramasamy R, Glennie S, Jones SP, Roberts I. The
role of mesenchymal stem cells in haemopoiesis.Blood Rev 2006; 20: 161-171, doi: 10.1016/j.blre.2005.11.002. 23. Silver RT. Imatinib mesylate (Gleevec (TM)) reduces
2003; 17: 1186-1187, doi: 10.1038/sj.leu.2402938. 24. Jones CM, Dickinson TM. Polycythemia vera responds to
imatinib mesylate.Am J Med Sci2003; 325: 149-152, doi: 10.1097/00000441-200303000-00007.
25. Buchdunger E, Cioffi CL, Law N, Stover D, Ohno-Jones S, Druker BJ, et al. Abl protein-tyrosine kinase inhibitor STI571 inhibits in vitro signal transduction mediated by c-kit and platelet-derived growth factor receptors.J Pharmacol Exp Ther2000; 295: 139-145.
26. Fitter S, Dewar AL, Kostakis P, To LB, Hughes TP, Roberts MM, et al. Long-term imatinib therapy promotes bone formation in CML patients. Blood 2008; 111: 2538-2547, doi: 10.1182/blood-2007-07-104281.
27. Gioni V, Karampinas T, Voutsinas G, Roussidis AE, Papadopoulos S, Karamanos NK, et al. Imatinib mesylate inhibits proliferation and exerts an antifibrotic effect in human breast stroma fibroblasts. Mol Cancer Res 2008; 6: 706-714, doi: 10.1158/1541-7786.MCR-07-0355. 28. Vittal R, Zhang H, Han MK, Moore BB, Horowitz JC,
Thannickal VJ. Effects of the protein kinase inhibitor, imatinib mesylate, on epithelial/mesenchymal phenotypes: implications for treatment of fibrotic diseases.J Pharmacol Exp Ther2007; 321: 35-44, doi: 10.1124/jpet.106.113407. 29. Dexter TM, Allen TD. The regulation of growth and
development of normal and leukaemic cells. J Pathol 1983; 141: 415-433, doi: 10.1002/path.1711410316. 30. Helftenbein G, Krusekopf K, Just U, Cross M, Ostertag W,
Niemann H, et al. Transcriptional regulation of the c-fms proto-oncogene mediated by granulocyte/macrophage colony-stimulating factor (GM-CSF) in murine cell lines.
Oncogene1996; 12: 931-935.
31. Gordon S, Taylor PR. Monocyte and macrophage hetero-geneity.Nat Rev Immunol2005; 5: 953-964, doi: 10.1038/ nri1733.
32. Zander AR, Zabelina T, Renges H, et al. Pretreatment with Glivec increases transplant-related mortality after allogeneic transplant.Blood2003; 102: 468a, (abstract 1708). 33. Distler JH, Jungel A, Huber LC, Schulze-Horsel U, Zwerina
J, Gay RE, et al. Imatinib mesylate reduces production of extracellular matrix and prevents development of experi-mental dermal fibrosis.Arthritis Rheum2007; 56: 311-322, doi: 10.1002/art.22314.
34. Chung L, Fiorentino DF, Benbarak MJ, Adler AS, Mariano MM, Paniagua RT, et al. Molecular framework for response to imatinib mesylate in systemic sclerosis.Arthritis Rheum 2009; 60: 584-591, doi: 10.1002/art.24221.
35. Wang S, Wilkes MC, Leof EB, Hirschberg R. Imatinib mesylate blocks a non-Smad TGF-beta pathway and reduces renal fibrogenesis in vivo. FASEB J 2005; 19: 1-11, doi: 10.1096/fj.04-2370com.
36. Paniagua RT, Sharpe O, Ho PP, Chan SM, Chang A, Higgins JP, et al. Selective tyrosine kinase inhibition by imatinib mesylate for the treatment of autoimmune arthritis. J Clin Invest2006; 116: 2633-2642.