proposed alternatives in poverty measurement according to
the methodology of Sonia Rocha
Giordano Benites Tronco
Universidade Federal do Rio Grande do Sul Porto Alegre / RS — Brazil
Marília Patta Ramos
Universidade Federal do Rio Grande do Sul / Programa de Pós-Graduação em Políticas Públicas Porto Alegre / RS — Brazil
his paper criticizes the methodology of poverty measurement used by the Brazilian federal government called Brasil Sem Miséria Plan (PBSM). Using a compilation and analysis of secondary data collected from the National Household Sample Survey (PNAD), we conducted a comparison between the government methodology and that one used by the economist Sonia Rocha. Her methodology establishes poverty lines which are regionalized and indexed to the consumer basket values found in diferent regions of the country. he results of both methodolo-gies are compared, showing that PBSM lines are incapable of detecting 12.9 million Brazilians living in poverty. In our conclusions, we present suggestions to improve the government’s poverty measurement methodology, i.e., the need of a regionalization of poverty lines and that they become indexed to regional consumer basket prices. Keywords: poverty; measurement; poverty line; methodology; regionalization.
Linhas de pobreza no Plano Brasil Sem Miséria: análise crítica e proposta de alternativas para a medição da pobreza conforme metodologia de Sonia Rocha
O presente trabalho critica a metodologia de medição da pobreza empregada pelo governo federal no âmbito do Plano Brasil Sem Miséria. Foi efetuada uma comparação, via compilação e análise descritiva de dados secundá-rios da PNAD, entre essa metodologia e aquela utilizada pela economista Sonia Rocha, a qual estabelece linhas de pobreza regionalizadas e indexadas aos valores de cestas de consumo observadas nas diferentes regiões do país. Os resultados das duas medições foram comparados, mostrando que as linhas do PBSM são incapazes de captar 12,9 milhões de brasileiros que vivem em situação de pobreza. Como conclusão do artigo são sugeridas, para o aperfeiçoamento da medição do governo, a regionalização das linhas e sua indexação ao preço de cestas de consumo regionais.
Palavras-chave: pobreza; medição; linha de pobreza; metodologia; regionalização.
Las líneas de pobreza en el Plano Brasil Sem Miséria: crítica y alternativas propuestas a la medición de la pobreza
Este trabajo aporta una metodología de medición de la pobreza crítica utilizados por el gobierno federal bajo el Plano Brasil Sin Pobreza. Se hizo una comparación a través de la recopilación y análisis de datos secundarios, entre esta metodología y la utilizada por la economista Sonia Rocha, que establece líneas de pobreza regionalizadas e indexadas a valores de cestas de consumo observados en diferentes regiones del país. Los resultados de las dos mediciones son comparados, lo que demuestra que las líneas de PBSM son incapaces de identiicar 12,9 millones de brasileños que viven en la pobreza. Para mejorar la medición del gobierno, sugerimos la regionalización de las líneas, así como la indexación del precio de las cestas de consumo regionales.
Palabras clave: pobreza; medición; línea de pobreza; metodología; regionalización.
DOI: http://dx.doi.org/10.1590/0034-7612162786
1. INTRODUCTION
In 2011, the federal government launched the Brasil Sem Miseria Plan (PBSM), a plan that ar-ticulates several existing and new programs around the goal of eradicating extreme poverty in Brazil, reaching “Brazil’s most vulnerable, more distant, more abandoned” (Campello and Mello, 2014:34). To do this, it was necessary to establish an oicial line to determine who was, in fact, poor - something that had never been done before, because until then each program and study used its own criterion to deine what “poverty” was. he Ministry of Social Development and the Fight against Hunger (MDS), in charge of the task, established the cut-of point of R$ 70.00 per capita to deine families living in extreme poverty and double the amount (R$ 140.00) to deine those living in poverty.
An important characteristic of these two lines is that they are applied in all regions of Brazil and therefore do not take into account the existing diferences in poverty between rural and urban areas, metropolitan and non-metropolitan regions. In addition, these values are not corrected annually: there is no established rule for updating the lines and they are not indexed to any type of variable, such as the minimum wage or the inlation rate. Other methodologies, such as that developed by economist Sonia Rocha, a researcher at the Institute of Labor and Society Studies (Iets), work with the measurement of poverty from the minimum food and non-food needs of the individuals and their market care, with values corrected annually according to the inlation of food prices and basic consumer items. Inlation-modifying methodologies and regional cost-of-living diferences are most efective in measuring poverty by identifying individuals that would be invisible if a single line was used without update.
Ater presenting more information on the two methodologies (the federal government and Sonia Rocha’s measurement), we compare the results to identify the diferences between them in the coun-ting of the poor population of Brazil. he reasons behind these diferences and how the government can improve the current methodology are also analyzed.
he comparison presented in this article, despite being exclusively descriptive, is unprecedent1
and raises a fundamental issue: the methodology used by the government to count and deine the poor excludes millions of brazilians in metropolies and urbanized cities. hus, it is necessary to em-phasize that this article does not deal with a mere critical discussion of methodologies; it is based on the management of secondary data and a descriptive and comparative analysis of them.
2. CONCEPT OF POVERTY
According to Jaccourd, the deinition of “poverty” difers according to diferent epochs or societies. Even if it is related to situations of “deiciency”, it is necessary to know “what needs are covered and what goods and services should be guaranteed” (Jaccourd, 2010:121), and such deiciencies may difer
1 here are articles that measure poverty with other indicators, such as Ottonelli and Mariano (2014), Paes de Barros, Carvalho and
qualitatively or quantitatively depending on the season or region. Indeed, the diferences between the poverty of the “rich” and the “poor” countries led some international organizations, such as the United Nations Development Program (UNDP), to adopt diferent methodologies for measuring the phenomenon of “poverty” in developed and developing countries.2 herefore, the government needs
to know how poverty manifests itself in its territory to know which measurement strategy makes the most sense in the articulation of its social policies and programs.
Regardless the interpretation of poverty that is applied (or used), there is a consesus that failure to meet daily minimum needs for calories and protein is linked to more elementary notions of poverty. In any society, those who do not have the means to guarantee their own minimum daily food are considered poor. his acute type of poverty, linked to insuicient food, is called “indigence”. Measu-ring and deining the indigence line (which determines the minimum amount of money needed to meet an individual’s food needs in a one-month period) is the irst step in most methodologies that measure poverty. From the indigence line, poverty lines are deined, which can include other aspects such as access to income, public services and shelter. he poverty line is the sum of the indigence line with the other minimum costs for an individual to survive in any given society.3
When we speak of lines of poverty and indigence, we are talking about measurements by me-ans of the variable “income”. Income is taken into account as the most popular variable for such use, mainly because of its international comparability and because it is the hegemonic mean, in monetized societies, to obtain goods and products that provide well-being; yet it is not the only possible variable, nor is it the most recommended in the case of societies where the level of social and productive development is very low (Rocha, 2003). In addition to measurements of income (poverty lines) and anthropometric variables (based on ideal values of weight and height of the population at each age), the third way to examine poverty is through indicators of basic needs. Proponents of this approach argue that poverty is multidimensional (Rocha, 2003) so it can not be deined only as lack of money or food.
It is worth highlighting theoretical perspectives that measure poverty beyond the monetary cri-terion and encompass other dimensions of life where poverty also manifests itself. In spite of the fact that we do not intend to discuss other approaches, it is worth remembering Sen’s (2010) argument. According to the author, we can better understand poverty by taking into account objective needs and perceptions, including people’s “life chances”, entitlements and capacities, or resources and skills, especially those living in contexts of social vulnerability and inequality.
Following the same line, Erikson (1996) considers that the central element to understand the conditions of a person’s life is the domain of resources and how one controls the means they have to conduct their living conditions. Also for Cummins (1999 apud Asmus, 2004), the objective dimen-sion is characterized by culturally relevant measures of objective well-being; already the subjective dimension is characterized by the satisfaction promoted by the other dimensions, which are evaluated by the importance that the individual attributes to them.
2 he UNDP’s Human Poverty Index (HPI) separates nations in “developing countries” (HPI-1) and “industrialized countries” (HPI-2).
Each index is formed by a diferent set of indicators.
3 Deaton (2004:3) recalls that the poorest of the poor spend most of their money on food, however as they leave poverty, their spending
In terms of studies aimed at discussing and describing poverty in Brazil, we highlight the article by Otonelli and Mariano (2014) that measures poverty in the Northeast of Brazil from a multidimen-sional point of view, involving 19 indicators (functioning) distributed in four dimensions: education, health, housing conditions and income. It is also worth noting the work of Schneider and Freitas (2013), who consider the material, social and personal growth needs to deine people’s quality of life. In addition, several studies by Ipea (Brazilian Applied Economics Research Institute) technicians propose measures of poverty with a multidimensional character, such as “Multidimensional Poverty in Brazil” by Paes and Barros, Carvalho and Franco (2006) and “Poverty in Brazil: a multidimensional perspective” by Kageyama and Hofman (2006). In contrast with the present article, these studies, while proposing new measures of poverty, do not aim to compare themselves with oicial government measures used in public policies.
In any case, the exempliication of these studies shows that the indicators chosen for studies on poverty must be heterogeneous, multidimensional and related to reality. However, the methodological problems to deine which dimensions to use, which ones to consider, and the weight to be assigned to each are still far from reaching a consensus.
3. POVERTY MEASUREMENT LINES IN THE BRASIL SEM MISÉRIA PLAN
In order to understand the oicial poverty line of the Brazilian federal government, it is neces-sary to understand its origin as part of the Brasil Sem Miseria Plan (PBSM), which coordinates more than 70 programs, services and public beneits and involves 11 ministries, began in 2011 with the objective of eradicating extreme poverty in Brazil and predicting to last four years, but in practice its actions continue throughout 2015 and 2016. Among the initiatives within the um-brella of the PBSM are old and new programs aimed at guaranteeing income, access to services and productive inclusion of the poorest among the poor, that is, those families in such vulnerable conditions, those who are not in a position to request assistance from the State. In order to reach this demographic, the State itself began to seek the poorest of the poor and include them in the Single Register of Social Programs (Cadúnico), a large Record of the Brazilian population with low income, from which they are enrolled in social programs such as Bolsa Family. his movement was called Active Search.
To monitor the success of PBSM, there was a need to determine how many were poor and extre-mely poor. According to Falcão and Costa (2014:69-70), the methodology of measuring poverty was the most pragmatic possible. he government discarded the creation of a new technical commission and adopted as lines of extreme poverty and poverty the lines already used in the operationalization of the Bolsa Família Program (R$ 70.00 and R$ 140.00, respectively),4 which had as an advantage
of being used in a large program and, according to the authors, to be similar (at the time this article was writen) to the values of the poverty lines used by Rocha and the World Bank. Using data from the 2010 Demographic Census, IBGE and MDS (Social Development and the Fight against Hunger Ministery) accounted for a population of 16.27 million Brazilians living in extreme poverty. his
4 As already mentioned in the introduction of the article, the calculation of the value of the MDS poverty line is done by doubling the
number would be monitored year by year and corrected with information from the National Hou-sehold Sample Survey (PNAD).
Despite Falcão and Costa’s assertion, we do not see similarities between the PBSM lines and the World Bank line, much less with the Rocha lines. We will show below why this similarity argument seems to be inadequate to defend the methodological strength of the PBSM line.
he World Bank (WB) poverty line is known as a dollar a day — although it is currently worth $ 1.25/day. To deine it, the national poverty lines of 115 developing countries are averaged, and the purchasing power of the lines is calculated, even when calculated in diferent currencies. To convert US $ 1.25/day into reais (R$) you should not use the commercial exchange rate. Instead, it uses the purchasing power parity rate (PPP) (Deaton, 2010). PPP is more stable and calculated in order to preserve the real purchase value of the diferent currencies in the world.
If we take the value of the World Bank line at the time of the launch of Brasil Sem Miséria Plan (ie in 2011), we will see that US $ 1.25/day was equivalent to R$ 62.62/month in Brazil, 10% lower than the R$ 70.00 of the Brazilian line. Although it can be argued that the diference is small, they did not have the same value. In any case, the PBSM line does not have the same updatable mechanisms as the WB line, which means that in the medium term, due to product price changes, they will evolve independently until they lose the similarity of values.
In any case, the BM line does not constitute a good reference for a national poverty line, since it was intended to be used in the comparison of numbers between countries and in measuring the attainment of international targets, and not for the use in public policies. International comparability, despite reinforcing “the spatial consistency of local actions with global thinking” (Neri, 2013:130), is a double-edged sword because an international standard will always be a generalist measure that will demand the sacriice of internal speciicities. Unlike the Rocha lines, the WB is not regionalizable, nor is it at least an average of Brazilian measurements, but rather from countries that do not necessarily have much to do with our poverty proile.
he comparison between the methodology of the federal government and that of Rocha is even more complex than that of the World Bank, because Rocha works with a set of 50 regionalized lines, 25 of poverty and 25 of indigence.5 According to Falcão and Costa (2014:73), the PBSM line is in
accordance with the Rocha lines because the latter was “orbiting the R$ 70.00 per person per month”. It would be more accurate to say that some of the lines orbited the R$ 70.00, or that the average values of the indigence lines orbited the R$ 70.00, as shown in graph 1.
he colored lines in graph 1 represent Rocha’s 25 indigence lines and their value variations between 2011 and 2014,6 while the black line represents the extreme poverty line of PBSM between 2011 and
2015. Analyzing Rocha’s lines for 2011, we can see that, although most of the urban and rural lines actually had values close to R$ 70.00, the lines of all metropolitan regions were higher than this value. It is also evident from the graph that the absence of an annual value correction mechanism increases
5 he MDS calls “poverty” or “extreme poverty” the situation of the poorest of the poor; diferently Rocha uses the term “indigence”,
which is a little diferent because it means not having the minimum necessary to fulill nutritional needs. he terms are similar enough to make the MDS “extreme poverty” and Rocha’s “indigence” to be comparable.
the diference between the two methodologies over the years. By 2014, only six of the 25 indigence lines continued to be below or equal to the PBSM line. Even the late correction of the line to R$ 77.00, in the same year, was not suicient to cover the variation occurred in most of Rocha’s lines.
GRAPH 1 VARIATION IN THE VALUES OF THE ROCHA INDIGENCE LINES AND THE PBSM EXTREME POVERTY LINE (2011 TO 2015)
R$ 127,00
R$ 117,00
R$ 107,00
R$ 97,00
R$ 87,00
R$ 77,00
R$ 67,00
R$ 57,00
R$ 47,00
2011 2012 2013 2014 2015
São Paulo (metropolitan) Rio de Janeiro (metropolitan)
Recife
Salvador
São Paulo (urban)
Brasília Belém Fortaleza Curitiba
Midwes (urban) M.G./E.S. (urban)
Northeast (urban)
Rio de Janeiro (rural) PBSM line
Northeast (rural) M.G./E.S. (rural)
North (rural)
Line v
alues
Year
Source: Elaborated by the authors
individual earns a monthly value below this line, they theoretically have no way of surviving in the society in question (at least not through the market, for they can theoretically produce their own food if they can aford it). he poverty line is calculated by adding to the food basket the value of a non-food basket with the basic monthly expenditure in six other consumption categories. In order to calculate the lines in the diferent regions, Rocha uses the Family Budgeting Survey (POF), Pnad, Endef 1974-75,7 annual inlation indicators and international determinations on minimum caloric
consumption (Rocha, 1997, 2000, 2003).
Because we have stronger references to counting the poor and indigent population, we consi-der Rocha’s methodology to be more accurate than that of the feconsi-deral government, but it can still produce biases. Some of his reference searches, such as POF and Endef, are old, with outdated data. In addition, the calculation of a population mean of caloric needs is problematic for two reasons: irstly, because the result is sensitive to the researcher’s interpretation of the distribution of the work force and the use of energy in the population. Some jobs require more energy (and therefore more calories) than others, and the classiication of occupational activities as light or heavy is related to the interpretations of each researcher. Secondly, an average of caloric needs disregards the need of individuals whose metabolisms need more calories than the population mean and therefore would be indigent even IF consuming the equivalent of the minimum food basket. hese individuals are not computed in the Rock calculation. Finally, the data used by Rocha does not allow for estimating the impact of one’s own production on household con-sumption. Some families, especially in rural areas, manage to get around the lack of money by producing their own food, which is not captured in a methodology based on lines expressed in monetary values (R$). he true number of indigents in rural areas, therefore, may be lower than that computed by Rocha.
4. RELATIONSHIP BETWEEN THE PBSM LINES AND THE BOLSA FAMÍLIA PROGRAM
Given that neither the Rocha lines nor the WB line result in an exact value of R$ 70.00, it seems likely that the main reference for the PBSM extreme poverty line - perhaps the only one — is the value of the line of operation of the Bolsa Família Program. In fact, the values of the Bolsa Família line, the PBSM extreme poverty line and the basic beneit of the Bolsa Familia are identical and the only update of the PBSM lines that have occurred until today was identical and simultaneous to the Bolsa Família.8
he Bolsa Família Program is a federal non-contributory income transfer program aimed at families living in poverty and extreme poverty, it aims to alleviate poverty and hunger and promote the social inclusion of these families (Campello, 2013:15). If there are in the family composition, pregnant women, children in early childhood and children and adolescents of school age up to 15
7 he National Study of Family Expenses (Endef) from 1974-75 was, until nowdays, the only family consumption survey conducted
throughout Brazil. Its data are used by Rocha in calculating the indigence lines of rural and non-metropolitan regions. he use of such an outdated data source is the main weakness of Rocha’s methodology.
years of age, additional beneits are allocated. he transfer of beneits depends on the fulillment of conditionalities in the areas of education (ensuring a minimum school attendance of school-a-ge children in the family) and health (keeping shots up-to-date) among others. he program is coordinated at the federal level by the Ministry of Social Development and Fight against Hunger (MDS), which is responsible for determining the poverty lines of the PBSM, but its management is decentralized, with municipalities registering the target population and sending families eligible for the program. he transfer of the onlendings to the beneiciaries is operationalized by Caixa Econômica Federal Bank.
he operating lines of Bolsa Família were inherited from the Zero Hunger Program, which ope-rationalized income transfers using two income parameters: families with incomes of up to R$ 50 per month per capita could receive R$ 50 / month, plus an additional beneit Of R$ 15,00 per child up to 15 years of age, up to a maximum of three children; families with per capita income between R$ 50 and R$ 100.00 per month received only the additional beneits if there were children in the family. hese parameters of R$ 50.00 and R$ 100.00 were based on the aforementioned cut of 1 dollar per day of the World Bank, but — most importantly — the conversion of values used the commercial quotation of the dollar of September 1999, and Not the PPP factor (Graziano et al., 2010:44-45), as recommended by the World Bank itself. hus, the R$ 100.00 line was conveniently close to the mi-nimum wage at the time. In practice, they were able to receive the beneit if he earned less than one minimum wage per month.
With the creation of the Bolsa Família Program in 2003, the Zero Hunger Program lines were adopted, but their values were de-indexed from any other indicator, be it the World Bank line or the minimum wage. Corrections in beneits and cut-of values of participants were made by the federal government based on their budget availability. he same was true for the number of beneiciaries, which was stipulated by the government, regardless of the real size of the poor population.
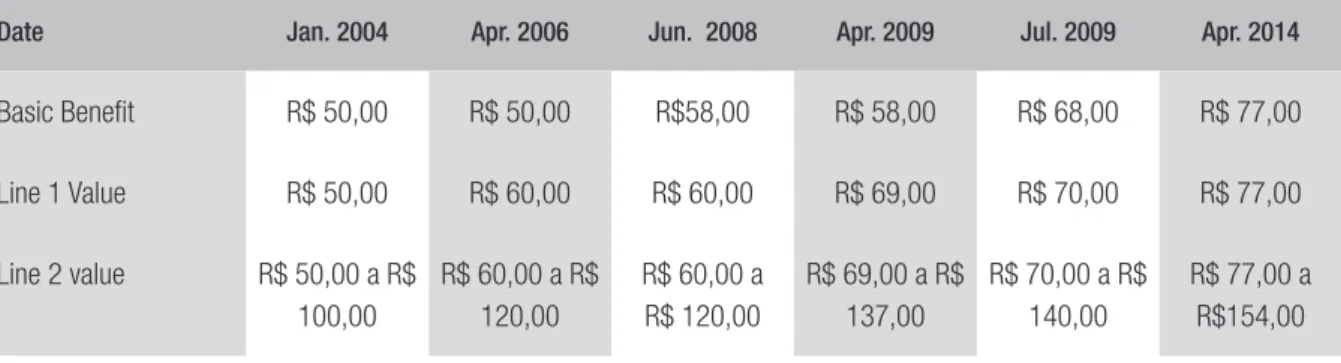
hus, the updates to the beneits and operating lines of the program were inconstant, carried out by means of laws and decrees, as shown in table 1.
TABLE 1 CHANGES IN THE VALUES OF THE BASIC BENEFIT AND OPERATING LINES OF THE BOLSA FAMÍLIA PROGRAM OVER THE YEARS
Date Jan. 2004 Apr. 2006 Jun. 2008 Apr. 2009 Jul. 2009 Apr. 2014
Basic Beneit R$ 50,00 R$ 50,00 R$58,00 R$ 58,00 R$ 68,00 R$ 77,00
Line 1 Value R$ 50,00 R$ 60,00 R$ 60,00 R$ 69,00 R$ 70,00 R$ 77,00
Line 2 value R$ 50,00 a R$ 100,00
R$ 60,00 a R$ 120,00
R$ 60,00 a R$ 120,00
R$ 69,00 a R$ 137,00
R$ 70,00 a R$ 140,00
R$ 77,00 a R$154,00
In more than 10 years of the PBF, the gap between the corrections in the value of the lines and be-neits has already been two years, three years, some months, and reached ive years during the 2009-14 period. During that same time, inlation and the minimum wage were updated annually, resulting in an increase in the cost of living. However, the Bolsa Família corrections did not keep the same pace.
he truth is that the INPC (National Consumers Prices Index) may have served as an inspiration for the corrections, but not as an accurate reference, because if this were so, the basic beneit of Bolsa Família should have been corrected in 2014 to R$ 87.05 (a result of accumulated inlation of the period 2003-14 on the original value of the beneit), not to R$ 77.00. he sporadic updates of Bolsa Família have no exact reference in any indicator, being, according to their design, inluenced by the government’s budget availability. hus, the use of Bolsa Familia as a reference for the poverty line is problematic, as it is doing the opposite of what would be advisable: instead of deining the budget of a program according to the calculation of the target public, informed by reliable poverty lines, the federal government updates its poverty lines according to the availability of the Bolsa Família budget.
5. COMPARISON BETWEEN MDS AND ROCHA’S MEASUREMENTS OF POVERTY
he methodologies employed by MDS and Rocha have diferent results in counting the poor popu-lation in Brazil. By having lines adapted to diferent realities, updated according to Pnad, the Rocha instruments capture a greater number of people living in poverty and indigence. With limited ins-truments (only two measurement lines) and outdated, the federal government can not capture these same families.
he results of the comparison between the two methodologies for the year 2014 are presented below. A poor and indigent population was counted according to the criteria in the Rocha metho-dology as well as the “Poverty Indicators, according to the Federation Units, Regions and strata of residence — 2014 ‘and’ Indicators of Indigence (or Extreme Poverty), according to the Units of the Federation, regions and strata of residence — 2014”, elaborated by Rocha in partnership with the Institute of Studies of Work and Society (Iets) and available on the IETS website.9 he federal
government count used in this article was extracted from the PIC Social tool, available on the website of the Ministry of Social Development and Fight against Hunger (MDS).10 he indicators
“Number of permanent private households with per capita household income of R$ 0.00 to 70.00”” and “Number of permanent private households with per capita household income of R$ 70.01 to 140.00”, with results available for all states of Brazil plus the Federal District.11 hese indicators
were analyzed in the present work to determine the numbers of poor12 and extremely poor in Brazil
and regions according to MDS.
9 Available at: <http://iets.org.br/dado/parametros-e-resultados-da-pnad-2014>. Accessed on: April 15th 2016. 10 Available at: <http://aplicacoes.mds.gov.br/sagi/portal/?grupo=72>. Accessed on: April 15th 2016
11 Included in the Sagi count is the population living in households with no income or no income statement that have some proxy
in-dicator of poverty (such as absence of toilets or household connection with some water supply system), according to the discriminant analysis methodology described In the Sagi Technical Study 15/2014.
12 In the case of the calculation of the poor, the count of the indicators “Quantity [...] from R$ 0.00 to 70.00” and “Quantity [...] from R$
It is important to note that in 2014 the federal government updated the value of its lines, from R$ 70.00 and R$ 140.00 to R$ 77.00 and R$ 154.00 respectively. Until the completion of this article, the Sagi site had not been updated with these new values, so in this comparison we still use the value of the lines from the beginning of PBSM as a reference.
Graph 2, constructed for this article based on the data mentioned, compares the results of the Federal Government’s extreme poverty measurement with those of the Rocha indigence measurement. Graph 3 was constructed by the authors of this article to compare the result of the number of poor people between the two methodologies.
GRAPH 2 NUMBER OF INDIGENTS (ROCHA) AND EXTREMELY POOR (FEDERAL GOVERNMENT) BY REGION OF THE COUNTRY (PNAD 2014)
8000000
7000000
6000000
5000000
4000000
3000000
2000000
1000000
0
Brazil Midwest Northeast North Southeast South
Population in indigency situation (Rocha)
Population in extreme poverty situation (fed. gov.)
Source: Elaborated by the authors
For the country as a whole, the results of the two measurements are diferent: while the federal government locates 5.1 million Brazilians living in extreme poverty, the number of indigent Brazilians, for Rocha, is 6.8 million. he distortion between results increases when poverty is measured: Rocha’s result is almost twice that calculated by the government (27 million against 14.1 million).
GRAPH 3 NUMBER OF POOR (ROCHA AND FEDERAL GOVERNMENT) BY REGION OF THE COUNTRY (PNAD 2014)
30000000
25000000
20000000
15000000
10000000
5000000
0
Brazil
Midwest Northeast North Southeast South
Population in poverty situation (Rocha)
Population in poverty situation (Fed. Gov.)
Source: Elaborated by the authors.
he diferences between the estimates of the poor in the Southeast region are the one that most weighs in the disparity of the total count of poor people in Brazil between the two methodologies. he number found by Rocha in the Southeast is more than four times larger than the government’s poor count and accounts for almost half of the 13 million “poor” individuals who are invisible to the federal government. In the state of São Paulo alone the diference in counting is ive million.
GRAPH 4 NUMBER OF INDIGENT/EXTREMELY POOR AND POOR IN THE STATE OF SÃO PAULO, ACCORDING TO ROCHA AND FEDERAL GOVERNMENT (PNAD 2014)
6.000.000
5.000.000
4.000.000
3.000.000
2.000.000
1.000.000
Number of indigent/extremely poor Number of poor
Rocha´s methodology Federal Government´s methodology
Comparatively, in the states of the Northeast the diference between the counts of indigents (Ro-cha) and extremely poor (federal government) is small.
GRAPH 5 NUMBER OF INDIGENTS (ROCHA) AND EXTREMELY POOR (FEDERAL GOVERNMENT) IN THE NORTHEASTERN STATES (PNAD 2014)
Sergipe
Rio Grande do Norte
Piauí
Pernambuco
Paraíba
Maranhão
Ceará
Bahia
Alagoas
Number of indigent (Rocha) Number of extremely poor (fed. gov.)
0 200000 400000 600000 800000
Source: Elaborated by the authors.
Maranhão and Alagoas are the only states where the federal government’s count is higher than that of Rocha, which can be explained by the combination of two factors: the low cost of the minimum food basket in the rural Northeast (R$ 70.50 to be more accurate) and the low rate of urbanization of both states. Maranhão is the only Brazilian state with more indigent living in the rural zone than in the urban area (549 thousand against 325 thousand, respectively).
What makes the results of the two methodologies diferent in the Southeast and closer in the Northeast? he case of Maranhão provides us with a clue: when the cost of living of a region is low, the indigence line will be closer to the PBSM R$ 70.00 line. In regions where the cost of living is higher, the indigence line (and, consequently, poverty) will have a high value, and therefore, further away from the R$ 70.00. As the cost of food and non-food baskets is lower in rural regions and hi-gher in urban regions, then a plausible hypothesis is that the distortion between the Rocha and MDS measurements will always be lower in rural regions and higher in regions with predominantly urban poverty — because there the indigence line tends to be higher.
Graph 613 shows that rural indigence is a striking phenomenon in the Northeast region, but not
very representative of the Southeast, South and Center-West regions, precisely where the greatest disparities between Rocha and the federal government measurements are found.
13 Rocha works to count the indigent population in three groups: rural, urban and metropolitan. As the metropolitan regions are mostly
GRAPH 6 NUMBER OF INDIGENTS BY REGION OF THE COUNTRY, ACCORDING TO THE SITUATION OF RESIDENCE (ROCHA, PNAD 2014)
Midwest Northeast North Southeast South
Urban and Metropolitan 2500000
2000000
1500000
1000000
500000
0
Rural
Source: Elaborated by the authors.
he same pattern is repeated for poverty, as shown in graph 7
GRAPH 7 NUMBER OF POOR BY REGION OF THE COUNTRY, ACCORDING TO A SITUATION OF RESIDENCE (ROCHA, PNAD 2014)
Urban and Metropolitan Rural
10000000
8000000
6000000
4000000
2000000
0
Midwest Northeast North Southeast South
In order to verify the relationship between urbanization rate and distortion among measure-ments, graph 8 presents the measurements of the two methodologies for poverty in the ive states with the highest urbanization rate in Brazil (including the Federal District) and in the ive states with the lowest rate. Looking at the results, it can be noted that the PBSM line can not capture as much poverty in highly urbanized regions as the Rocha lines. As expected, the distortion between the two measurements is lower in states with lower urbanization rates. he percentage, in graph 8, next to the name of the state represents the rate of urbanization.
GRAPH 8 COMPARISON OF POVERTY MEASUREMENTS IN THE MOST URBANIZED AND LESS URBANIZED STATES (PNAD 2014)
Rio de Janeiro (97%)
São Paulo (96%)
Federal District (65%)
Goiás (91,6%)
Amapá (90%)
Alagoas (71,5%)
Acre (71%)
Pará (69%)
Piauí (68%)
Maranhão (58%)
0 1000000 2000000 3000000 4000000 5000000 6000000
Nº of poors (gov. fed.) Nº of poors (Rocha)
Source: Elaborated by the authors.
deiciency in the measurement of poverty in these regions, which contain populous and highly ur-banized states such as Rio de Janeiro and São Paulo, results in the exclusion of millions of Brazilians from statistics on poverty and their exclusion in accessing income transfer programs.
6. CONCLUSION
he poverty and extreme poverty line of the PBSM was created with the objective of measuring the progress of the eradication of poverty in Brazil. For this, a value of R$ 70.00 was initially established, identical to the line of operation and basic beneit of the Bolsa Família Program. To date, the PBSM and Bolsa Família lines have been linked, so the updates of the irst depend on changes in the second. As changes in the Bolsa Familia are irregular, the PBSM line is only updated when the government has the budget capacity to review the Bolsa Família beneit.
his creates diiculties in monitoring poverty in Brazil. he problem is not to delimit a cut-of point for Bolsa Família care, but rather to use this limit to monitor the eradication of extreme po-verty. It would be more plausible to do the opposite: on the basis of an accurate measurement of the phenomenon, conducted with methodological rigor, a plan for the eradication of misery could be drawn. As established, the PBSM’s goal of eradicating extreme poverty with the care of 16.2 million Brazilians relects the size of the public that the government can meet, not the public that actually exists. As a result, even if PBSM achieves its goal of liting 16.2 million Brazilians out of misery and the government announces the end of extreme poverty, it will not actually be eradicated.
At the same time, there are measurement instruments developed by Sonia Rocha that, although are not perfect, are updated annually according to reliable national surveys, being therefore a more reliable thermometer to measure the real phenomenon of poverty than the PBSM lines. Comparing the two methodologies, this article demonstrates that the measurement of the federal government needs to recognize at least 1.7 million Brazilians as extremely poor, and another 12.9 million as poor. It is considered that this conclusion is very relevant to help optimize the allocation of resources to Brazilian social policies, speciically the Brazil Without Poverty Plan.
It is not uncommon for poverty measurement criteria to be simpliied according to the state’s ability to address poverty. Sonia Rocha herself says that poverty lines that inform the proportions of very high poor are impracticable for use in the diagnosis and orientation of policies (Rocha, 2003:77-78). herefore, the choice of the federal government for a methodology that cuts the poorer population would be justiied if the true number exceeds the state’s capacity for service, but this does not seem to be the case. According to Rocha’s data, the indigent and poor population is, respectively, 3% and 13.8% of the Brazilian population — a large number, but an operable one.
In order to amortize the budget deicit caused by this increase, the federal government could de-velop partnerships with municipal and state governments, as is already the case with Bolsa Família in the state and municipality of Rio de Janeiro and in several other states where the federal government pays the amount referring to the basic beneit and the other spheres of government complement this value, adjusting it to the local cost of living. Local transfers of income are nothing new: municipalities as diverse as Franca, Guariba, Goiânia, Belo Horizonte, Jundiaí, Jaboticabal and Ourinhos, as well as the Federal District (Soares and Sátyro, 2009:9), all adhere to this method in the 1990s, which shows some degree of possibility of co-inancing of Bolsa Família in certain municipalities. hat would not be enough to absorb the full impact on the federal budget, but it would partially amortize it, even though it would lead to increased spending in other federal spheres.
REFERENCES
ASMUS, Rosa M. F. Qualidade de vida na agricultura
familiar. Tese (doutorado) — Centro de
Desenvolvi-mento Sustentável — Política e Gestão, Universidade de Brasília, Brasília, 2004.
CAMPELLO, Tereza. Uma década derrubando mitos e superando expectativas. In: CAMPELLO,
Tereza; NERI, Marcelo C. Programa Bolsa Família:
uma década de inclusão e cidadania. Brasília: Ipea,
2013. p. 15-24.
CAMPELLO, Tereza; MELLO, Janine. O processo de formulação e os desaios do Plano Brasil Sem Miséria: por um país rico e com oportunidades para todos. In: CAMPELLO, Tereza; FALCÃO, Tiago; DA
COSTA, Patrícia V. O Brasil Sem Miséria. Brasília:
MDS, 2014. p. 33-66.
DEATON, Angus. Measuring poverty. Research
Program in Development Studies. New Jersey: Princeton University, 2004. Available at: <http:// rrojasdatabank.info/deaton_povertymeasured.pdf>. Accessed on: 14 Apr. 2016.
DEATON, Angus. Price indexes, inequality, and
the measurement of world poverty.he American
Economic Review, v. 100, n. 1, p. 1-34, 2010.
ERIKSON, Robert. Descripciones de la desigualdad: el enfoque sueco de la investigación sobre el
bienes-tar. In: NUSSBAUM, Martha C.; SEN, Amartya. La
calidad de vida. México: Fondo de Cultura
Econó-mica, 1996. p. 101-120.
FALCÃO, Tiago; DA COSTA, Patrícia V. A linha de
extrema pobreza e o público-alvo do Plano Brasil Sem Miséria. In: CAMPELLO, Tereza et al. (Org.).
O Brasil Sem Miséria. Brasília: MDS, 2014. p. 67-96.
GRAZIANO, José; BELIK, Walter; TAKAGI, Maya. Para os críticos do Fome Zero. In: GRAZIANO, José;
Del GROSSI, Mauro E. Fome Zero: a experiência
brasileira. Brasília: MDA, 2010. p. 39-52.
HELLMANN, Aline G. Como funciona o Bolsa Família? Melhores Práticas na Implementação de Programas de Transferência de Renda
Condicio-nadas na América Latina e Caribe. IDB Technical
Note (Social Sector. Social Protection and Health
Division); IDB-TN-856. Banco Interamericano de
Desenvolvimento, 2015.
JACCOURD, Luciana. O Programa Bolsa Família e o combate à pobreza: reconigurando a proteção social
no Brasil? In: De CASTRO, Jorge A.; MODESTO,
Lúcia. Bolsa Família 2003-2010: avanços e desaios.
Brasília: Ipea, 2010. v. 1, p. 101-136.
KAGEYAMA, Angela; HOFFMAN, Rodolfo. Po-breza no Brasil: uma perspectiva multidimensional.
Economia e Sociedade, Campinas, v. 15, n. 1, p.
79-112, Jan./June 2006.
NERI, Marcelo C. Sistemas de pagamento subna-cionais baseados no Bolsa Família. In: CAMPELLO,
Tereza; NERI, Marcelo C. Programa Bolsa Família:
uma década de inclusão e cidadania. Brasília: Ipea,
2013. p. 125-136.
OTTONELLI, Janaina; MARIANO, Jorge L. Pobreza multidimensional nos municípios da Região
Nor-deste. Rev. Adm. Pública, v. 48, n. 5, p. 1253-1279,
Sept./Oct. 2014.
PAES de BARROS, Ricardo; DE CARVALHO,
Mi-rella; FRANCO, Samuel. Pobreza Multidimensional
no Brasil. Texto para discussão. Ipea, 2006. Available
at: <www.ipea.gov.br/portal/images/stories/PDFs/ TDs/td_1227.pdf>. Accessed on: 2 Apr. 2016.
PAIVA, Luís H.; FALCÃO, Tiago; BARTHOLO, Letícia. Do Bolsa Família ao Brasil Sem Miséria: um resumo do percurso brasileiro recente na busca da superação da pobreza extrema. In: CAMPELLO,
Tereza; NERI, Marcelo C. Programa Bolsa Família:
uma década de inclusão e cidadania. Brasília: Ipea,
2013. p. 25-46.
ROCHA, Sonia. Indicadores de indigência, segundo
unidades de federação, regiões e estratos de
residên-cia — 2014. Planilha do Excel. Rio de Janeiro: Iets,
2015. Available at: <http://iets.org.br/dado/para-metros-e-resultados-da-pnad-2014>. Accessed on: 15 Apr. 2016.
ROCHA, Sonia. Indicadores de pobreza, segundo
unidades de federação, regiões e estratos de
residên-cia — 2014. Planilha do Excel. Rio de Janeiro: Iets,
2015. Available at: <http://iets.org.br/dado/para-metros-e-resultados-da-pnad-2014>. Accessed on: 15 abr. 2016.
ROCHA, Sonia. Do consumo observado à linha de
pobreza. Pesquisa e planejamento econômico (PPE),
v. 27, n. 2, p. 313-352, Aug. 1997.
Brasil. Texto para Discussão n. 720 do Ipea. Rio de Janeiro: Ipea, 2000.
ROCHA, Sonia. Pobreza no Brasil: ainal, do que se
trata? Rio de Janeiro: Editora FGV, 2003.
SCHNEIDER, Sérgio; FREITAS, Tanise D. Qua-lidade de vida, diversiicação e desenvolvimento: referências práticas para análise do bem-estar no
meio rural.Revista Olhares Sociais, v. 2, n. 1, p.
121-142, 2013.
SEN, Amartya K.; KLIKSBERG, Bernard. As pessoas
em primeiro lugar. A ética do desenvolvimento e os
problemas do mundo globalizado. São Paulo: Com-panhia das Letras, 2010.
SOARES, Sergei; SÁTYRO, Natália. O Programa Bolsa Família: desenho institucional, impactos e
possibilidades futuras. Texto para Discussão n. 1.424
do Ipea. Brasília: Ipea, 2009.
Giordano Benites Tronco
Holds a bachelor’s degree in public policy from the Federal University of Rio Grande do Sul (UFRGS) and a bachelor’s degree in social communication from the Pontiical Catholic University of Rio Grande do Sul (PUC-RS). E-mail: [email protected].
Marília Patta Ramos