METHODOLOGICAL PAPER
A new criterion for assessing discriminant validity
in variance-based structural equation modeling
Jörg Henseler&Christian M. Ringle&Marko Sarstedt
Received: 18 March 2014 / Accepted: 29 July 2014 / Published online: 22 August 2014 #The Author(s) 2014. This article is published with open access at Springerlink.com
Abstract Discriminant validity assessment has become a generally accepted prerequisite for analyzing relationships between latent variables. For variance-based structural equa-tion modeling, such as partial least squares, the Fornell-Larcker criterion and the examination of cross-loadings are the dominant approaches for evaluating discriminant validity. By means of a simulation study, we show that these ap-proaches do not reliably detect the lack of discriminant valid-ity in common research situations. We therefore propose an alternative approach, based on the multitrait-multimethod ma-trix, to assess discriminant validity: the heterotrait-monotrait ratio of correlations. We demonstrate its superior performance by means of a Monte Carlo simulation study, in which we compare the new approach to the Fornell-Larcker criterion and the assessment of (partial) cross-loadings. Finally, we provide guidelines on how to handle discriminant validity issues in variance-based structural equation modeling.
Keywords Structural equation modeling (SEM) . Partial least squares (PLS) . Results evaluation . Measurement model assessment . Discriminant validity . Fornell-Larcker criterion . Cross-loadings . Multitrait-multimethod (MTMM) matrix . Heterotrait-monotrait (HTMT) ratio of correlations
Introduction
Variance-based structural equation modeling (SEM) is growing in popularity, which the plethora of recent devel-opments and discussions (e.g., Henseler et al. 2014; Hwang et al. 2010; Lu et al. 2011; Rigdon 2014; Tenenhaus and Tenenhaus 2011), as well as its frequent application across different disciplines, demonstrate (e.g., Hair et al.2012a, b; Lee et al.2011; Peng and Lai 2012; Ringle et al. 2012). Variance-based SEM methods—such as partial least squares path modeling (PLS; Lohmöller 1989; Wold 1982), generalized structured component analysis (GSCA; Henseler 2012; Hwang and Takane 2004), regularized generalized canonical correlation anal-ysis (Tenenhaus and Tenenhaus 2011), and best fitting proper indices (Dijkstra and Henseler 2011)—have in common that they employ linear composites of observed variables as proxies for latent variables, in order to esti-mate model relationships. The estiesti-mated strength of these relationships, most notably between the latent variables, can only be meaningfully interpreted if construct validity was established (Peter and Churchill 1986). Thereby, re-searchers ensure that the measurement models in their studies capture what they intend to measure (Campbell and Fiske 1959). Threats to construct validity stem from various sources. Consequently, researchers must employ different construct validity subtypes to evaluate their re-sults (e.g., convergent validity, discriminant validity, cri-terion validity; Sarstedt and Mooi 2014).
J. Henseler
Faculty of Engineering Technology, University of Twente, Enschede, Netherlands
e-mail: [email protected]
J. Henseler
ISEGI, Universidade Nova de Lisboa, Lisbon, Portugal
C. M. Ringle
Hamburg University of Technology (TUHH), Hamburg, Germany e-mail: [email protected]
C. M. Ringle
University of Newcastle, Newcastle, Australia
M. Sarstedt
Otto-von-Guericke-University Magdeburg, Magdeburg, Germany
M. Sarstedt (*)
University of Newcastle, Newcastle, Australia e-mail: [email protected]
In this paper, we focus on examining discriminant validity as one of the key building blocks of model evaluation (e.g.,Bagozzi and Phillips 1982; Hair et al. 2010). Discriminant validity ensures that a construct measure is empirically unique and represents phenomena of interest that other measures in a structural equation model do not capture (Hair et al.2010). Technically, discriminant validity requires that“a test not correlate too highly with measures from which it is supposed to differ”(Campbell1960, p. 548). If discrim-inant validity is not established,“constructs [have] an influ-ence on the variation of more than just the observed variables to which they are theoretically related” and, as a consequence, “researchers cannot be certain results confirming hypothesized structural paths are real or whether they are a result of statistical discrepancies” (Farrell2010, p. 324). Against this background, discrim-inant validity assessment has become common practice in SEM studies (e.g., Shah and Goldstein 2006; Shook et al. 2004).
Despite its obvious importance, researchers using variance-based SEM usually rely on a very limited set of approaches to establish discriminant validity. As shown in Table1, tutorial articles and introductory books on PLS almost solely recommend using the Fornell and Larcker (1981) criterion and cross-loadings (Chin1998). Reviews of PLS use suggest that these recommendations have been widely applied in published research in the fields of management informa-tion systems (Ringle et al. 2012), marketing (Hair et al. 2012a), and strategic management (Hair et al. 2012b). For example, the marketing studies in Hair et al.'s (2012a) review that engage in some type of discriminant validity assessment use the Fornell-Larcker criterion (72.08%), cross-loadings (7.79%), or both (26.13%). Reviews in other disciplines paint a similar monotonous picture. Very few studies report other means of assessing discriminant validity. These alternatives in-clude testing whether the latent variable correlations are significantly different from one another (Milberg et al. 2000) and running separate confirmatory factor analyses prior to employing variance-based SEM (Cording et al. 2008; Pavlou et al. 2007; Ravichandran and Rai 2000) by using, for example, Anderson and Gerbing's (1988) test as the standard.1
While marketing researchers routinely rely on the Fornell-Larcker criterion and cross-loadings (Hair et al.2012a), there are very few empirical findings on the suitability of these criteria for establishing discriminant validity. Recent research suggests that the Fornell-Larcker criterion is not effective
under certain circumstances (Henseler et al. 2014; Rönkkö and Evermann2013), pointing to a potential weakness in the most commonly used discriminant validity criterion. However, these studies do not provide any systematic assess-ment of the Fornell-Larcker criterion’s efficacy regarding testing discriminant validity. Furthermore, while researchers frequently note that cross-loadings are more liberal in terms of indicating discriminant validity (i.e., the assessment of cross-loadings will support discriminant validity when the Fornell-Larcker criterion fails to do so; Hair et al.2012a,b; Henseler et al.2009), prior research has not yet tested this notion.
In this research, we present three major contributions to variance-based SEM literature on marketing that are rele-vant for the social sciences disciplines in general. First, we show that neither the Fornell-Larcker criterion nor the assessment of the cross-loadings allows users of variance-based SEM to determine the discriminant validity of their measures. Second, as a solution for this critical issue, we propose the heterotrait-monotrait ratio of correlations (HTMT) as a new approach to assess discriminant validity in variance-based SEM. Third, we demonstrate the effica-cy of HTMT by means of a Monte Carlo simulation, in which we compare its performance with that of the Fornell-Larcker criterion and with the assessment of the cross-loadings. Based on our findings, we provide re-searchers with recommendations on when and how to use the approach. Moreover, we offer guidelines for treating discriminant validity problems. The findings of this research are relevant for both researchers and practi-tioners in marketing and other social sciences disciplines, since we establish a new standard means of assessing discriminant validity as part of measurement model eval-uation in variance-based SEM.
Traditional discriminant validity assessment methods
Comparing average communality and shared variance
In their widely cited article on tests to evaluate structural equation models, Fornell and Larcker (1981) suggest that discriminant validity is established if a latent variable accounts for more variance in its associated indicator variables than it shares with other constructs in the same model. To satisfy this requirement, each construct’s av-erage variance extracted (AVE) must be compared with its squared correlations with other constructs in the mod-el. According to Gefen and Straub (2005, p. 94), “[t]his comparison harkens back to the tests of correlations in multi-trait multi-method matrices [Campbell and Fiske, 1959], and, indeed, the logic is quite similar.”
The AVE represents the average amount of variance that a construct explains in its indicator variables relative to the
1It is important to note that studies may have used different ways to
overall variance of its indicators. The AVE for constructξjis
defined as follows:
AVEξj¼
XKj
k¼1
λ2
jk
XKj
k¼1
λ2
jkþΘjk
; ð1Þ
whereλjkis the indicator loading andΘjkthe error variance
of thekthindicator (k = 1,…,Kj) of constructξj.Kjis the number of indicators of constructξj. If all the indicators are standardized
(i.e., have a mean of 0 and a variance of 1), Eq.1simplifies to
AVEξj¼ 1 Kj
∑
Kj
k¼1
λ2
jk: ð2Þ
The AVE thus equals the average squared standardized loading, and it is equivalent to the mean value of the indicator reliabilities. Now, letrijbe the correlation coefficient between
the construct scores of constructsξiandξjThe squared
inter-construct correlationrij2 indicates the proportion of the
vari-ance that constructsξiandξjshare. The Fornell-Larcker
crite-rion then indicates that discriminant validity is established if the following condition holds:
AVEξj>maxr2i j ∀i≠j: ð3Þ
Since it is common to report inter-construct correlations in publications, a different notation can be found in most reports on discriminant validity:
ffiffiffiffiffiffiffiffiffiffiffiffiffiffi
AVEξj
q
>maxjri jj ∀i≠j: ð4Þ
From a conceptual perspective, the application of the Fornell-Larcker criterion is not without limitations. For exam-ple, it is well known that variance-based SEM methods tend to overestimate indicator loadings (e.g., Hui and Wold 1982; Lohmöller1989). The origin of this characteristic lies in the methods’ treatment of constructs. Variance-based SEM methods, such as PLS or GSCA, use composites of indicator variables as substitutes for the underlying constructs (Henseler et al.2014). The loading of each indicator on the composite represents a relationship between the indicator and the com-posite of which the indicator is part. As a result, the degree of overlap between each indicator and composite will be high, yielding inflated loading estimates, especially if the number of indicators per construct (composite) is small (Aguirre-Urreta et al.2013).2Furthermore, each indicator’s error variance is also included in the composite (e.g., Bollen and Lennox 1991), which increases the validity gap between the construct and the composite (Rigdon2014) and, ultimately, compounds the inflation in the loading estimates. Similar to the loadings, variance-based SEM methods generally underestimate struc-tural model relationships (e.g., Reinartz et al. 2009; Marcoulides, Chin, and Saunders2012). While these devia-tions are usually relatively small (i.e., less than 0.05; Reinartz Table 1 Recommendations for
establishing discriminant validity in prior research
Other prominent introductory texts on PLS (e.g., Falk and Miller 1992; Haenlein and Kaplan2004; Lohmöller1989; Tenenhaus et al. 2005; Wold1982) do not offer recommendations for assessing discriminant validity
Reference Recommendation
Fornell-Larcker criterion Cross-loadings
Barclay, Higgins, and Thompson (1995) ✓ ✓
Chin (1998,2010) ✓ ✓
Fornell and Cha (1994) ✓
Gefen and Straub (2005) ✓ ✓
Gefen, Straub, and Boudreau (2000) ✓ ✓
Götz, Liehr-Gobbers, and Krafft (2010) ✓
Hair et al. (2011) ✓ ✓
Hair et al. (2012a) ✓ ✓
Hair et al. (2012b) ✓ ✓
Hair et al. (2014) ✓ ✓
Henseler et al. (2009) ✓ ✓
Hulland (1999) ✓
Lee et al. (2011) ✓ ✓
Peng and Lai (2012) ✓
Ringle et al. (2012) ✓ ✓
Roldán and Sánchez-Franco (2012) ✓ ✓
Sosik et al. (2009) ✓
2Nunnally (1978) offers an extreme example with five mutually
et al.2009), the interplay between inflated AVE values and deflated structural model relationships in the assessment of discriminant validity has not been systematically examined. Furthermore, the Fornell-Larcker criterion does not rely on inference statistics and, thus, no procedure for statistically testing discriminant validity has been developed to date.
Assessing cross-loadings
Another popular approach for establishing discriminant validity is the assessment of cross-loadings, which is also called“item-level discriminant validity.”According to Gefen and Straub (2005, p. 92),“discriminant validity is shown when each measurement item correlates weakly with all other constructs except for the one to which it is theoretically associated.”This approach can be traced back to exploratory factor analysis, where researchers routinely examine indicator loading patterns to identify indicators that have high loadings on the same factor and those that load highly on multiple factors (i.e., double-loaders; Mulaik2009).
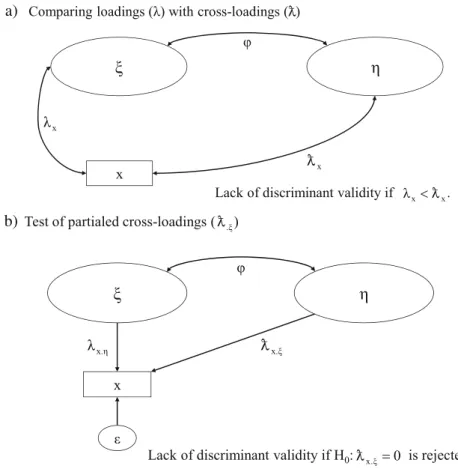
In the case of PLS, Barclay et al. (1995), as well as Chin (1998), were the first to propose that each indicator loading should be greater than all of its cross-loadings.3Otherwise,“the measure in question is unable to discriminate as to whether it belongs to the construct it was intended to measure or to another (i.e., discriminant validity problem)”(Chin2010, p. 671). The upper part a) of Fig.1illustrates this cross-loadings approach.
However, there has been no reflection on this approach’s usefulness in variance-based SEM. Apart from the norm that an item should be highly correlated with its own construct, but have low correlations with other constructs in order to estab-lish discriminant validity at the item level, no additional theoretical arguments or empirical evidence of this approach’s performance have been presented. In contrast, research on covariance-based SEM has critically reflected on the approach’s usefulness for discriminant validity assessment. For example, Bollen (1989) shows that high inter-construct correlations can cause a pronounced spurious correlation be-tween a theoretically unrelated indicator and construct. The paucity of research on the efficacy of cross-loadings in variance-based SEM is problematic, because the methods tend to overestimate indicator loadings due to their reliance on composites. At the same time, the introduction of composites as substitutes for latent variables leaves cross-loadings largely unaffected. The majority of variance-based SEM methods are limited information approaches, estimating model equations separately, so that the inflated loadings are only imperfectly introduced in the cross-loadings. Therefore, the very nature of
algorithms, such as PLS, favors the support of discriminant validity as described by Barclay et al. (1995) and Chin (1998). Another major drawback of the aforementioned approach is that it is a criterion, but not a statistical test. However, it is also possible to conduct a statistical test of other constructs’ influence on an indicator using partial cross-loadings.4 The partial cross-loadings determine the effect of a construct on an indicator other than the one the indicator is intended to mea-sure after controlling for the influence of the construct that the indicator should measure. Once the influence of the actual construct has been partialed out, the residual error variance should be pure random error according to the reflective mea-surement model:
εjk ¼xjk−λjkξj; εjk⊥ξi ∀i: ð5Þ
Ifεjkis explained by another variable (i.e., the correlation
between the error term of an indicator and another construct is significant), we can no longer maintain the assumption thatεjk
is pure random error but must acknowledge that part of the measurement error is systematic error. If this systematic error is due to another construct ξi, we must conclude that the
indicator does not indiscriminately measure its focal construct ξj, but also the other construct ξi, which implies a lack of
discriminant validity. The lower part b) of Fig.1illustrates the working principle of the significance test of partial cross-loadings.
While this approach has not been applied in the context of variance-based SEM, its use is common in covariance-based SEM, where it is typically applied in the form of modification indices. Substantial modification indices point analysts to the correlations between indicator error terms and other con-structs, which are nothing but partial correlations.
An initial assessment of traditional discriminant validity methods
Although the Fornell-Larcker criterion was established more than 30 years ago, there is virtually no systematic examination of its efficacy for assessing discriminant validity. Rönkkö and Evermann (2013) were the first to point out the Fornell-Larcker criterion’s potential problems. Their simulation study, which originally evaluated the performance of model valida-tion indices in PLS, included a populavalida-tion model with two identical constructs. Despite the lack of discriminant validity, the Fornell-Larcker criterion indicated this problem in only 54 of the 500 cases (10.80%). This result implies that, in the vast majority of situations that lack discriminant validity, empirical
3Chin (2010) suggests examining the squared loadings and
cross-loadings instead of the cross-loadings and cross-cross-loadings. He argues that, for instance, compared to a cross-loading of 0.70, a standardized loading of 0.80 may raise concerns, whereas the comparison of a shared variance of
researchers would mistakenly be led to believe that discrimi-nant validity has been established. Unfortunately, Rönkkö and Evermann’s (2013) study does not permit drawing definite conclusions about extant approaches’efficacy for assessing discriminant validity for the following reasons: First, their calculation of the AVE—a major ingredient of the Fornell-Larcker criterion—was inaccurate, because they determined one overall AVE value instead of two separate AVE values; that is, one for each construct (Henseler et al.2014).5Second, Rönkkö and Evermann (2013) did not examine the perfor-mance of the cross-loadings assessment.
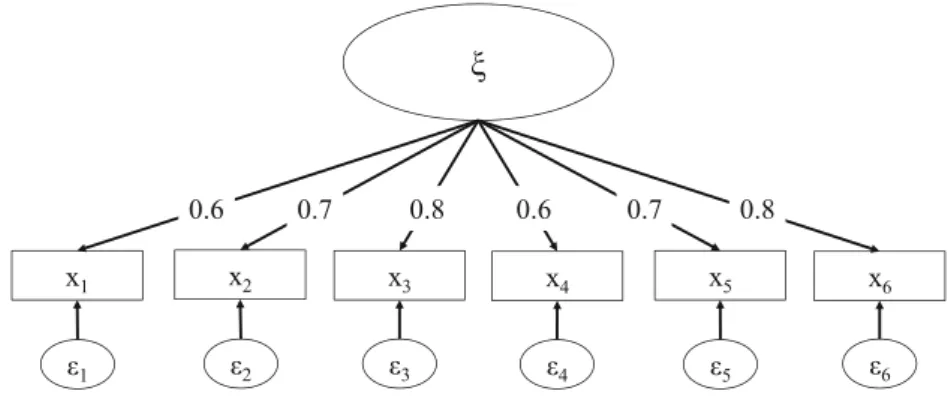
In order to shed light on the Fornell-Larcker criterion’s efficacy, as well as on that of the cross-loadings, we conducted a small simulation study. We randomly created 10,000 datasets with 100 observations, each according to the one-factor population model shown in Fig.2, which Rönkkö and Evermann (2013) and Henseler et al. (2014) also used. The indicators have standardized loadings of 0.60, 0.70, and 0.80, analogous to the loading patterns employed in previous sim-ulation studies on variance-based SEM (e.g., Goodhue et al. 2012; Henseler and Sarstedt2013; Reinartz et al.2009).
To assess the performance of traditional methods regarding detecting (a lack of) discriminant validity, we split the
construct in Fig.2into two separate constructs, which results in a two-factor model as depicted in Fig.3. We then used the artificially generated datasets from the population model in Fig.2to estimate the model shown in Fig.3by means of the variance-based SEM techniques GSCA and PLS. We also benchmarked their results against those of regressions with summed scales, which is an alternative method for estimating relationships between composites (Goodhue et al.2012). No matter which technique is used to estimate the model param-eters, the Fornell-Larcker criterion and the assessment of the cross-loadings should reveal that the one-factor model rather than the two-factor model is preferable.
Table2shows the results of this initial study. The reported percentage values denote the approaches’sensitivity, indicating their ability to identify a lack of discriminant validity (Macmillan and Creelman 2004). For example, when using GSCA for model estimation, the Fornell-Larcker criterion points to a lack of discriminant validity in only 10.66% of the simulation runs.
The results of this study render the following main find-ings: First, we can generally confirm Rönkkö and Evermann’s (2013) report on the Fornell-Larcker criterion’s extremely poor performance in PLS, even though our study’s concrete sensitivity value is somewhat higher (14.59% instead of 10.80%).6 In addition, we find that the sensitivity of the
5
We thank Mikko Rönkkö and Joerg Evermann for providing us with the code of their simulation study (Rönkkö and Evermann2013), which helped us localize this error in their analysis.
6
The difference between these results could be due to calculation errors by Rönkkö and Evermann (2013), as revealed by Henseler et al. (2014).
b)
a)
Fig. 1 Using the cross-loadingscross-loadings regarding assessing discriminant validity is 8.78% in respect of GSCA and, essentially, zero in respect of PLS and regression with summed scales. These results allow us to conclude that both the Fornell-Larcker criterion and the assessment of the cross-loadings are insufficiently sensitive to detect discriminant validity problems. As we will show later in the paper, this finding can be generalized to alternative model settings with different loading patterns, inter-construct correlations, and sample sizes. Second, our results are not due to a certain method’s characteristics, be-cause we used different model estimation techniques. Although the results differ slightly across the three methods (Table2), we find that the general pattern remains stable. In conclusion, the Fornell-Larcker criterion and the assessment of the cross-loadings fail to reliably uncover discriminant validity problems in variance-based SEM.
The heterotrait-monotrait ratio of the correlations approach to assess discriminant validity
Traditional approaches’unacceptably low sensitivity regard-ing assessregard-ing discriminant validity calls for an alternative criterion. In the following, we derive such a criterion from the classical multitrait-multimethod (MTMM) matrix (Campbell and Fiske1959), which permits a systematic dis-criminant validity assessment to establish construct validity.
Surprisingly, the MTMM matrix approach has hardly been applied in variance-based SEM (for a notable exception see Loch et al.2003).
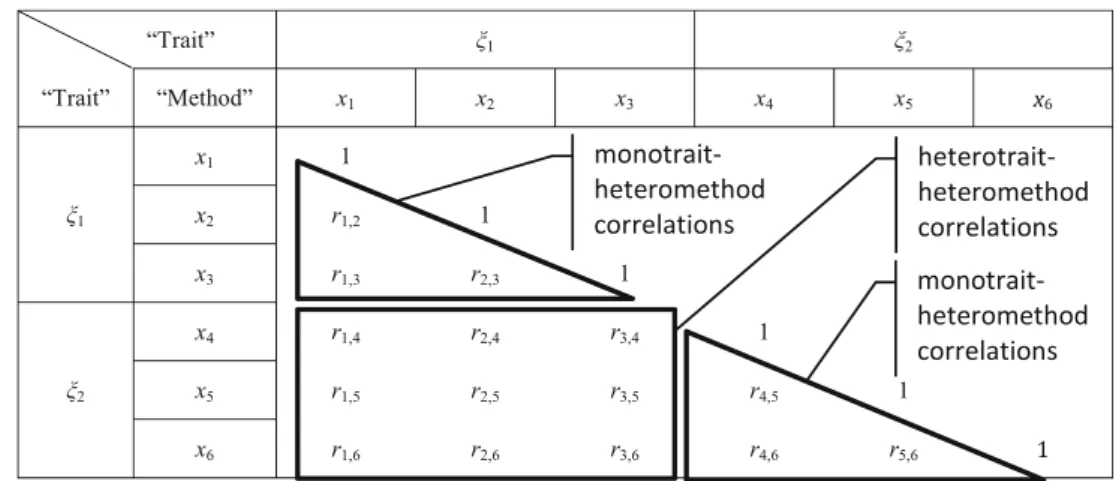
The application of the MTMM matrix approach requires at least two constructs (“multiple traits”) originating from the same respondents. The MTMM matrix is a particular arrange-ment of all the construct measures’correlations. Campbell and Fiske (1959) distinguish between four types of correlations, two of which are relevant for discriminant validity assessment. First, the monotrait-heteromethod correlations quantify the relationships between two measurements of the same con-struct by means of different methods (i.e., items). Second, the heterotrait-heteromethod correlations quantify the rela-tionships between two measurements of different constructs by means of different methods (i.e., items). Figure4visualizes the structuring of these correlations types by means of a small example (Fig. 3) with two constructs (ξ1 andξ2) measured
with three items each (x1tox3andx4tox6). Since the MTMM
matrix is symmetric, only the lower triangle needs to be considered. The monotrait-heteromethod correlations subpart includes the correlations of indicators that belong to the same construct. In our example, these are the correlations between the indicatorsx1tox3and between the indicatorsx4tox6, as
the two triangles in Fig. 4 indicate. The heterotrait-heteromethod correlations subpart includes the correlations between the different constructs’indicators. In the example in Fig. 4, the heterotrait-heteromethod correlations subpart Fig. 2 Population model
(one-factor model)
consists of the nine correlations between the indicators of the constructξ1(i.e.,x1tox3) and those of the constructξ2(i.e.,x4
tox6), which are indicated by a rectangle.
The MTMM matrix analysis provides evidence of discrim-inant validity when the monotrait-heteromethod correlations are larger than the heterotrait-heteromethod correlations (Campbell and Fiske1959; John and Benet-Martínez2000). That is, the relationships of the indicators within the same construct are stronger than those of the indicators across constructs measuring different phenomena, which implies that a construct is empirically unique and a phenomenon of interest that other measures in the model do not capture.
While this rule is theoretically sound, it is problematic in empirical research practice. First, there is a large potential for ambiguities. What if the order is not as expected in only a few incidents? It cannot be ruled out that some heterotrait-heteromethod correlations exceed monotrait-heterotrait-heteromethod
correlations, although the two constructs do in fact differ (Schmitt and Stults1986). Second, one-by-one comparisons of values in large correlation matrices can quickly become tedious, which may be one reason for the MTMM matrix analysis not being a standard approach to assess discriminant validity in variance-based SEM.
We suggest assessing the heterotrait-monotrait ratio (HTMT) of the correlations, which is the average of the heterotrait-heteromethod correlations (i.e., the correlations of indicators across constructs measuring different phenomena), relative to the average of the monotrait-heteromethod correla-tions (i.e., the correlacorrela-tions of indicators within the same con-struct). Since there are two monotrait-heteromethod submatrices, we take the geometric mean of their average correlations. Consequently, the HTMT of the constructs ξi and ξj with, respectively, Ki and Kj indicators can be
formulated as follows:
HTMTij¼
1 KiKj
X
g¼1 KiX
h¼1 Kj
rig;jh
|fflfflfflfflfflfflfflfflfflfflfflfflfflfflfflfflfflfflfflfflfflfflffl{zfflfflfflfflfflfflfflfflfflfflfflfflfflfflfflfflfflfflfflfflfflfflffl}
average heterotrait− heteromethod
2
KiðKi−1Þ
⋅X
Ki−1
g¼1
X
h¼gþ1 Ki
rig;ih⋅
2 Kj Kj−1
⋅ X
Kj−1
g¼1
X
h¼gþ1 Kj
rjg;jh
!1 2
:
|fflfflfflfflfflfflfflfflfflfflfflfflfflfflfflfflfflfflfflfflfflfflfflfflfflfflfflfflfflfflfflfflfflfflfflfflfflfflfflfflfflfflfflfflfflfflfflfflffl{zfflfflfflfflfflfflfflfflfflfflfflfflfflfflfflfflfflfflfflfflfflfflfflfflfflfflfflfflfflfflfflfflfflfflfflfflfflfflfflfflfflfflfflfflfflfflfflfflffl}
geometric mean of the average monotrait−heteromethod correlation of constructξiand the average
monotrait−heteromethod correlation of constructξj
ð6Þ
In essence, as suggested by Nunnally (1978) and Netemeyer et al. (2003), the HTMT approach is an estimate of the correlation between the constructsξiand ξj (see the
Appendix for the derivation), which parallels the disattenuated construct score correlation. Technically, the HTMT provides two advantages over the disattenuated construct score corre-lation: The HTMT does not require a factor analysis to obtain factor loadings, nor does it require the calculation of construct scores. This allows for determining the HTMT even if the raw data is not available, but the correlation matrix is. Furthermore, HTMT builds on the available measures and data and—contrary to the standard MTMM approach—does not require simultaneous surveying of the same theoretical concept with alternative measurement approaches. Therefore, this approach does not suffer from the standard MTMM approach’s well-known issues regarding data requirements and parallel measures (Schmitt 1978; Schmitt and Stults 1986).
Because the HTMT is an estimate of the correlation be-tween the constructsξiandξj, its interpretation is
straightfor-ward: if the indicators of two constructsξiandξjexhibit an
HTMT value that is clearly smaller than one, the true correla-tion between the two constructs is most likely different from one, and they should differ. There are two ways of using the HTMT to assess discriminant validity: (1) as a criterion or (2) as a statistical test. First, using the HTMT as a criterion involves comparing it to a predefined threshold. If the value of the HTMT is higher than this threshold, one can conclude that there is a lack of discriminant validity. The exact threshold level of the HTMT is debatable; after all,“when is a correla-tion close to one”? Some authors suggest a threshold of 0.85 (Clark and Watson1995; Kline2011), whereas others propose a value of 0.90 (Gold et al. 2001; Teo et al.2008). In the remainder of this paper, we use the notations HTMT.85and
HTMT.90 in order distinguish between these two absolute
thresholds for the HTMT. Second, the HTMT can serve as Table 2 Sensitivity of traditional
approaches to assessing discrimi-nant validity
Approach GSCA PLS Regression with summed scales
Fornell-Larcker criterion 10.66 % 14.59 % 7.76 %
the basis of a statistical discriminant validity test (which we will refer to as HTMTinference). The bootstrapping procedure
allows for constructing confidence intervals for the HTMT, as defined in Eq. 6, in order to test the null hypothesis (H0: HTMT ≥ 1) against the alternative hypothesis (H1:
HTMT < 1).7A confidence interval containing the value one (i.e., H0 holds) indicates a lack of discriminant validity.
Conversely, if the value one falls outside the interval’s range, this suggests that the two constructs are empirically distinct. As Shaffer (1995, p. 575) notes,“[t]esting with confidence intervals has the advantage that they give more information by indicating the direction and something about the magnitude of the difference or, if the hypothesis is not rejected, the power of the procedure can be gauged by the width of the interval.”
In real research situations with multiple constructs, the
HTMTinferenceanalysis involves the multiple testing
prob-lem (Miller1981). Thus, researchers must control for an inflation of Type I errors resulting from applying multiple tests to pairs of constructs. That is, discriminant validity assessment using HTMTinferenceneeds to adjust the upper
and lower bounds of the confidence interval in each test to maintain the familywise error rate at a predefinedαlevel (Anderson and Gerbing 1988). We use the Bonferroni adjustment to assure that the familywise error rate of
HTMTinference does not exceed the predefined α level in
all the (J–1)J/2 (J= number of latent variables) tests. The Bonferroni approach does not rely on any distributional assumptions about the data, making it particularly suitable in the context of variance-based SEM techniques such as PLS (Gudergan et al.2008). Furthermore, Bonferroni is a rather conservative approach to maintain the familywise error rate at a predefined level (Hochberg 1988; Holm 1979). Its implementation therefore also renders
HTMTinferencemore conservative in terms of its sensitivity
assessment (compared to other multiple testing ap-proaches), which seems warranted given the Fornell-Larcker criterion and the cross-loadings’ poor perfor-mance in the previous simulation study.
Comparing the approaches by means of a computational experiment
Objectives
To examine the different approaches’ efficacy for estab-lishing discriminant validity, we conduct a second Monte Carlo simulation study. The aims of this study are (1) to shed further light on the performance of the Fornell-Larcker criterion and the cross-loadings in alternative model settings and (2) to evaluate the newly proposed HTMT criteria’s efficacy for assessing discriminant va-lidity vis-à-vis traditional approaches. We measure the approaches’ performance by means of their sensitivity and specificity (Macmillan and Creelman 2004). The sensitivity, as introduced before, quantifies each approach’s ability to detect a lack of discriminant valid-ity if two constructs are identical. The specificvalid-ity indi-cates how frequently an approach will signal discrimi-nant validity if the two constructs are empirically dis-tinct. Both sensitivity and specificity are desirable char-acteristics and, optimally, an approach should yield high values in both measures. In real research situations, how-ever, it is virtually impossible to achieve perfect sensi-tivity and perfect specificity simultaneously due to, for example, measurement or sampling errors. Instead, ap-proaches with a higher sensitivity will usually have a lower specificity and vice versa. Researchers thus face a trade-off between sensitivity and specificity, and need to find a find a balance between the two (Macmillan and Creelman 2004).
7
Strictly speaking, one should assess the absolute value of the HTMT, because a correlation of−1 implies a lack of discriminant validity, too. Fig. 4 An example of a reduced
Experimental design and analysis
The design of the Monte Carlo simulation was motivated by the objective to define models that (1) allow for the assess-ment of approaches’sensitivity and specificity with regard to detecting a lack of discriminant validity and (2) resemble set-ups commonly encountered in applied research (Paxton et al. 2001). In line with Rönkkö and Evermann (2013), as well as Henseler et al. (2014), the simulation study’s population mod-el builds on a two-construct modmod-el, as shown in Fig. 3. Drawing on the results of prior PLS reviews (e.g., Hair et al. 2012a; Ringle et al. 2012), we vary the indicator loading patterns to allow for (1) different levels of the AVE and (2) varying degrees of heterogeneity between the loadings. Specifically, we consider four loading patterns for each of the two constructs:
1. A homogenous pattern of loadings with higher AVE:
λ11¼λ12¼λ13¼λ21¼λ22 ¼λ23¼:90;
2. A homogenous pattern of loadings with lower AVE:
λ11¼λ12¼λ13¼λ21¼λ22 ¼λ23¼:70;
3. A more heterogeneous pattern of loadings with lower AVE:
λ11 ¼λ21¼:60;λ12¼λ22 ¼:70;λ13 ¼λ23¼:80;
4. A more heterogeneous pattern of loadings with lower AVE:
λ11 ¼λ21¼:50;λ12¼λ22 ¼:70;λ13 ¼λ23¼:90:
Next, we examine how different sample sizes—as routine-ly assumed in simulation studies in SEM in general (Paxton et al. 2001) and in variance-based SEM in particular (e.g., Reinartz et al.2009; Vilares and Coelho2013)—would influ-ence the approaches’ efficacy. We consider sample sizes of 100, 250, 500, and 1,000.
Finally, in order to examine the sensitivity and specificity of the approaches, we vary the inter-construct correlations. First, to examine their sensitivi-ty, we consider a situation in which the two constructs
a situation in which an analyst mistakenly models two constructs, although they actually form a single con-struct. Optimally, all the approaches should indicate a lack of discriminant validity under this condition.
In line with Vilares et al. (2010), as well as Vilares and Coelho (2013), we generate 1,000 datasets for each combination of design factors. Hence, the simulation study draws on a total number of 816,000 simulation runs: 4 levels of loading patterns times 4 levels of sample sizes times 51 levels of inter-construct correla-tions times 1,000 datasets per condition. In each simu-lation run, we apply the following approaches to assess the discriminant validity:
1. The Fornell-Larcker criterion: Is the squared correlation between the two constructs greater than any of the two constructs’AVE?
2. The cross-loadings: Does any indicator correlate more strongly with the other constructs than with its own construct?
3. The partial cross-loadings: Is an indicator significantly explained by a construct that it is not intended to measure when the actual construct’s influence is partialed out?
4. The HTMT.85 criterion: Is the HTMT criterion greater
than 0.85?
5. The HTMT.90 criterion: Is the HTMT criterion greater
than 0.90?
6. The statistical HTMTinferencetest: Does the 90% normal
bootstrap confidence interval of the HTMT criterion with a Bonferroni adjustment include the value one?8
In the simulation study, we focus on PLS, which is regarded as the“most fully developed and general system” (McDonald 1996, p. 240) of the variance-based SEM techniques. Furthermore, the initial simulation study showed that PLS is the variance-based SEM technique with the highest sensitivity (i.e., 14.59% in respect of the Fornell-Larcker criterion; Table 2). All calculations were carried out with R 3.1.0 (R Core Team 2014) and we applied PLS as implemented in the semPLS package (Monecke and Leisch 2012).
8
Since HTMTinferencerelies on one-tailed tests, we use the 90% bootstrap
confidence interval in order to warrant an error probability of five percent.
are perfectly correlated (φ= 1.0). This condition mirrors
Second, to examine the approaches’ specificity, we
de-crease the inter-construct correlations in 50 steps of 0.02
from φ= 1.00 to φ= 0.00, covering the full range of
Sensitivity results
With respect to each sensitivity analysis situation, we report each approach’s relative frequency to indicate the lack of discriminant validity if the true correlation between the con-structs is equal to one (Table 3). This frequency should be 100%, or at least very close to this percentage.
Extending our previous findings, the results clearly show that traditional approaches used to assess discriminant validity perform very poorly; this is also true in alternative model settings with different loading patterns and sample sizes. The most commonly used approach, the Fornell-Larcker criterion, fails to identify discriminant validity issues in the vast major-ity of cases (Table3). It only detects a lack of discriminant validity in more than 50% of simulation runs in situations with very heterogeneous loading patterns (i.e., 0.50 /0.70 /0.90) and sample sizes of 500 or less. With respect to more homo-geneous loading patterns, the Fornell-Larcker criterion yields much lower sensitivity rates, particularly when the AVE is low.
The analysis of the cross-loadings fails to identify any discriminant validity problems, as this approach yields sensi-tivity values of 0% across all the factor level combinations (Table3). Hence, the comparison of cross-loadings does not provide a basis for identifying discriminant validity issues. However, the picture is somewhat different regarding the partial cross-loadings. The sensitivity remains unacceptably
low in respect of homogeneous loadings patterns, no matter what the sample size is. However, the sensitivity improves substantially in respect of heterogeneous loadings patterns. The sample size clearly matters for the partial cross-loadings approach. The larger the sample size, the more sensitive the partial cross-loadings are regarding detecting a lack of dis-criminant validity.
In contrast to the other approaches, the two absolute HTMT.85 and HTMT.90 criteria, as well as HTMTinference,
yield sensitivity levels of 95% or higher underallsimulation conditions (Table3). Because of its lower threshold, HTMT.85
slightly outperforms the other two approaches with an average sensitivity rate of 99.90% compared to the 99.45% of HTMT.90 and the 97.01% of HTMTinference. In general, all
three HTMT approaches detect discriminant validity issues reliably.
Specificity results
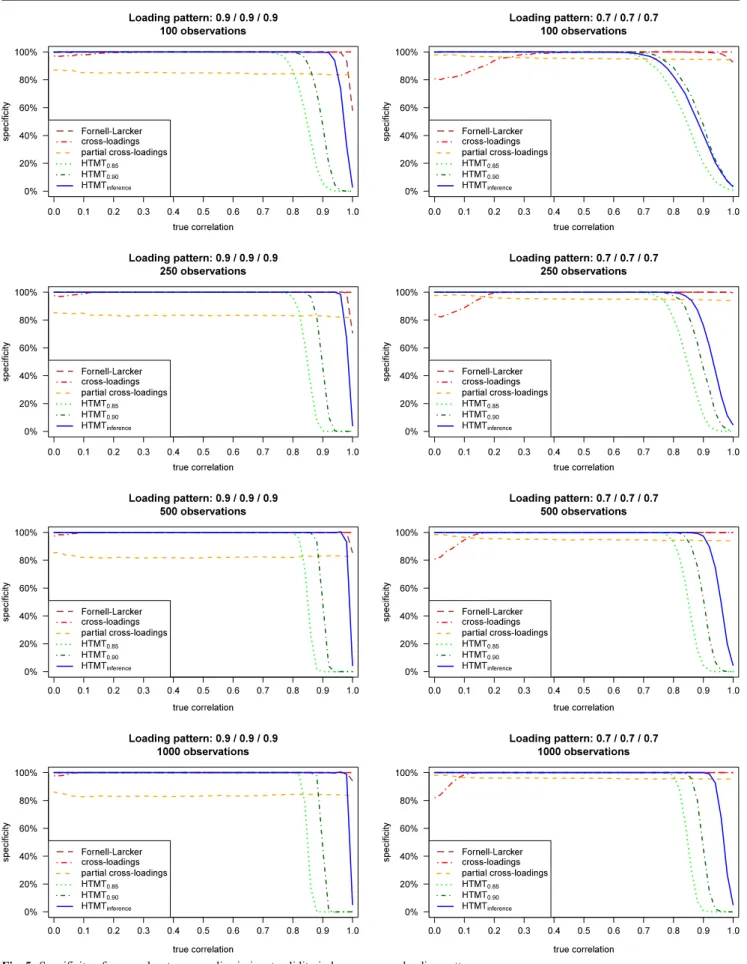
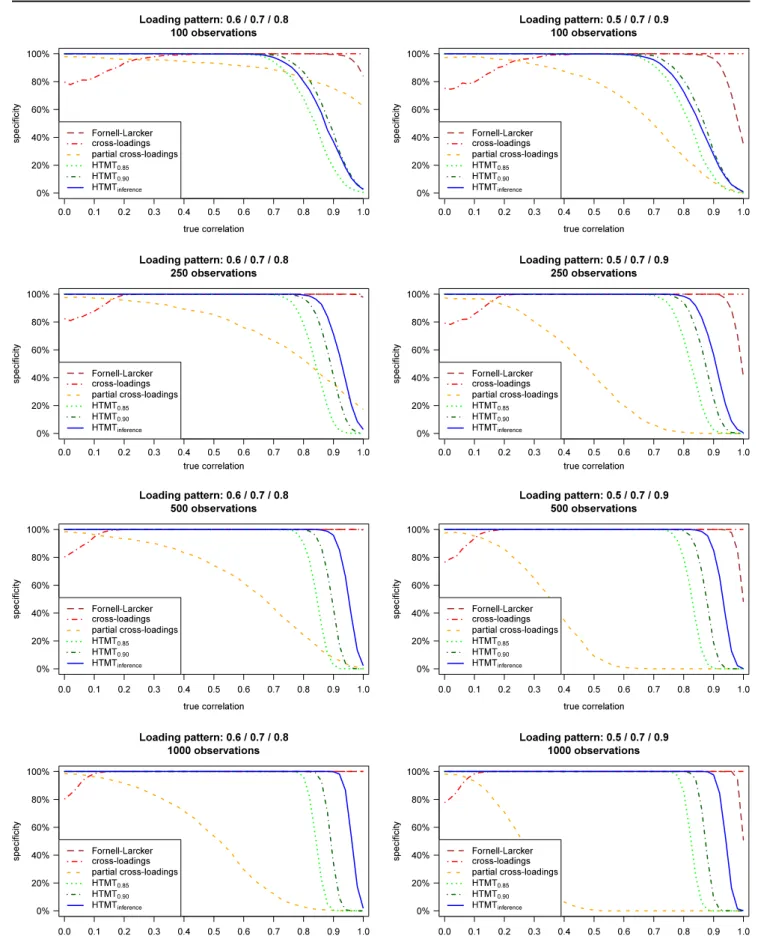
The specificity results are depicted in Fig.5(for homogeneous loading patterns) and Fig.6(for heterogeneous loadings pat-terns). The graphs visualize the frequency with which each approach indicates that the two constructs are distinct regard-ing varyregard-ing levels of inter-construct correlations, loadregard-ing pat-terns, and sample sizes. The discussion focuses on the three HTMT-based approaches, as the sensitivity analysis has al-ready rendered the Fornell-Larcker criterion and the Table 3 Results: Sensitivity of approaches to assess discriminant validity
Loading pattern Sample size Approach to assess discriminant validity
Fornell-Larcker Cross-loadings Partial cross-loadings HTMT.85 HTMT.90 HTMTinference
0.90/0.90/0.90 100 42.10 % 0.00 % 16.70 % 100.00 % 100.00 % 96.30 %
250 27.30 % 0.00 % 15.30 % 100.00 % 100.00 % 96.00 %
500 15.40 % 0.00 % 17.70 % 100.00 % 100.00 % 95.50 %
1,000 4.80 % 0.00 % 19.40 % 100.00 % 100.00 % 96.00 %
0.70/0.70/0.70 100 6.90 % 0.00 % 5.10 % 99.10 % 95.90 % 96.00 %
250 0.30 % 0.00 % 5.10 % 100.00 % 99.90 % 95.70 %
500 0.00 % 0.00 % 5.60 % 100.00 % 100.00 % 94.90 %
1,000 0.00 % 0.00 % 6.40 % 100.00 % 100.00 % 95.50 %
0.60/0.70/0.80 100 13.70 % 0.00 % 39.60 % 99.40 % 96.90 % 96.60 %
250 2.30 % 0.00 % 82.80 % 100.00 % 100.00 % 96.80 %
500 0.20 % 0.00 % 99.50 % 100.00 % 100.00 % 97.10 %
1,000 0.00 % 0.00 % 100.00 % 100.00 % 100.00 % 98.40 % 0.50/0.70/0.90 100 64.60 % 0.00 % 99.50 % 99.90 % 98.50 % 98.20 %
250 59.50 % 0.00 % 100.00 % 100.00 % 100.00 % 99.40 %
500 53.90 % 0.00 % 100.00 % 100.00 % 100.00 % 99.80 %
1,000 42.10 % 0.00 % 100.00 % 100.00 % 100.00 % 100.00 % Average 20.82 % 0.00 % 50.79 % 99.90 % 99.45 % 97.01 %
assessment of the (partial) cross-loadings ineffective (we nev-ertheless plotted their specificity rates for completeness sake). All HTMT approaches show consistent patterns of decreas-ing specificity rates at higher levels of inter-construct correla-tions. As the correlations increase, the constructs’ distinctive-ness decreases, making it less likely that the approaches will indicate discriminant validity. Furthermore, the three ap-proaches show similar results patterns for different loadings, sample sizes, and inter-construct correlations, albeit at differ-ent levels. For example, ceteris paribus, when loading patterns are heterogeneous, specificity rates decrease at lower levels of inter-construct correlations compared to conditions with ho-mogeneous loading patterns. A more detailed analysis of the results shows that all three HTMT approaches have specificity rates of well above 50% with regard to inter-construct corre-lations of 0.80 or less, regardless of the loading patterns and sample sizes. At inter-construct correlations of 0.70, the spec-ificity rates are close to 100% in all instances. Thus, neither approach mistakenly indicates discriminant validity issues at levels of inter-construct correlations, which most researchers are likely to consider indicative of discriminant validity.
Comparing the approaches shows that HTMT.85 always
exhibits higher or equal sensitivity, but lower or equal speci-ficity values compared to HTMT.90. That is, HTMT.85is more
likely to indicate a lack of discriminant validity, an expected finding considering the criterion’s lower threshold value. The difference between these two approaches becomes more pro-nounced with respect to larger sample sizes and stronger loadings, but it remains largely unaffected by the degree of heterogeneity between the loadings.
Compared to the two threshold-based HTMT approaches,
HTMTinferencegenerally yields much higher specificity values,
thus constituting a rather liberal approach to assessing dis-criminant validity, as it is more likely to indicate two con-structs as distinct, even at high levels of inter-construct corre-lations. This finding holds especially in conditions where loadings are homogeneous and high (Fig. 5). Here,
HTMTinference yields specificity rates of 80% or higher in
terms of inter-construct correlations as high as 0.95, which many researchers are likely to view as indicative of a lack of discriminant validity. Exceptions occur in sample sizes of 100 and with lower AVE values. Here, HTMT.90achieves higher
sensitivity rates compared to HTMTinference. However, the
differences in specificity between the two criteria are marginal in these settings.
Empirical example
To illustrate the approaches, we draw on the American Customer Satisfaction Index (ACSI) model (Anderson and Fornell2000; Fornell et al.1996), using empirical data from
the first quarter of 1999 with N=10,417 observations after excluding cases with missing data from the indicators used for model estimation (case wise deletion). In line with prior studies (Ringle et al.2010,2014) that used this dataset in their ACSI model examples, we rely on a modified version of the ACSI model without the constructs complaints (dummy-coded indicator) and loyalty (more than 80% of the cases for this construct measurement are missing). Figure7shows the reduced ACSI model and the PLS results.
The reduced ACSI model consists of the four reflectively measured constructs: customer satisfaction (ACSI), customer expectations (CUEX), perceived quality (PERQ), and per-ceived value (PERV). The evaluation of the PLS results meets the relevant criteria (Chin1998,2010; Götz et al.2010; Hair et al.2012a), which Ringle et al. (2010), using this example, presented in detail. According to the Fornell-Larcker criterion and the cross-loadings (Table4), the constructs’discriminant validity has been established: (1) the square root of each construct’s AVE is higher than its correlation with another construct, and (2) each item loads highest on its associated construct. Table4 also lists the significant (p<0.05) partial cross-loadings. Two thirds of them are significant. This rela-tively high percentage is not surprising, considering that even marginal correlations (e.g., an absolute value of 0.028) be-come significant as a result of the high sample size. Hence, and in line with the approach’s sensitivity results (Table3), the multitude of significant partial cross-loadings seems to sug-gest serious problems with respect to discriminant validity.
Next, we compute the HTMT criteria for each pair of constructs on the basis of the item correlations (Table5) as defined in Eq. 6.9The computation yields values between 0.53 in respect of HTMT(CUEX,PERV) and 0.95 in respect of HTMT(ACSI,PERQ) (Table6). Comparing these results with the threshold values as defined in HTMT.85gives rise to
concern, because two of the six comparisons (ACSI and PERQ; ACSI and PERV) violate the 0.85 threshold. However, in the light of the conceptual similarity of the ACSI model’s constructs, the use of a more liberal criterion for specificity seems warranted. Nevertheless, even when using HTMT.90as the standard, one comparison (ACSI and
PERQ) violates this criterion. Only the use of HTMTinference
suggests that discriminant validity has been established. This empirical example of the ACSI model and the use of original data illustrate a situation in which the classical criteria do not indicate any discriminant validity issues, whereas the two more conservative HTMT criteria do. While it is beyond this study’s scope to discuss the implications of the results for model design, they give rise to concern regarding the empirical distinctiveness of the ACSI and PERQ constructs.
9
Summary and discussion
Key findings and recommendations
Our results clearly show that the two standard approaches to assessing the discriminant validity in variance-based SEM— the Fornell-Larcker criterion and the assessment of cross-loadings—have an unacceptably low sensitivity, which means that they are largely unable to detect a lack of discriminant validity. In particular, the assessment of the cross-loadings completely fails to detect discriminant validity issues. Similarly, the assessment of partial cross-loadings—an ap-proach which has not been used in variance-based SEM— proves inefficient in many settings commonly encountered in applied research. More precisely, the criterion only works well in situations with heterogeneous loading patterns and high sample sizes.
As a solution to this critical issue, we present a new set of criteria for discriminant validity assessment in variance-based SEM. The new HTMT criteria, which are based on a compar-ison of the heterotrait-heteromethod correlations and the monotrait-heteromethod correlations, identify a lack of dis-criminant validity effectively, as evidenced by their high sen-sitivity rates.
The main difference between the HTMT criteria lies in their specificity. Of the three approaches, HTMT.85 is the most
conservative criterion, as it achieves the lowest specificity rates of all the simulation conditions. This means that HTMT.85 can pint to discriminant validity problems in
re-search situations in which HTMT.90and HTMTinference
indi-cate that discriminant validity has been established. In con-trast, HTMTinference is the most liberal of the three newly
proposed approaches. Even if two constructs are highly, but not perfectly, correlated with values close to 1.0, the criterion is unlikely to indicate a lack of discriminant validity, particu-larly when (1) the loadings are homogeneous and high or (2) the sample size is large. Owing to its higher threshold, HTMT.90always has higher specificity rates than HTMT.85.
PERQ
qual1
qual2
qual3
PERV
value1
value2
CUEX
exp1
exp2
exp3
ACSI
acsi1
acsi2
acsi3 .926
.903
.867 .394
.559
.021 .072
.619
.948
.935 .556
.919 .916
.731
.848 .845
.629
Fig. 7 Reduced ACSI model and PLS results
Table 4 Fornell-Larcker criterion results and cross loadings
ACSI CUEX PERQ PERV
Fornell-Larcker criterion ACSI 0.899
CUEX 0.495 0.781
PERQ 0.830 0.556 0.860
PERV 0.771 0.417 0.660 0.942
Cross-loadings
acsi1 0.926 0.489 0.826 0.757 acsi2 0.903 0.398 0.729 0.676 acsi3 0.867 0.447 0.672 0.638
exp1 0.430 0.845 0.471 0.372
exp2 0.429 0.848 0.474 0.356
exp3 0.283 0.629 0.346 0.229
qual1 0.802 0.561 0.916 0.640
qual2 0.780 0.486 0.919 0.619
qual3 0.515 0.364 0.731 0.408
value1 0.751 0.418 0.663 0.948 value2 0.699 0.364 0.575 0.935 Significant (p<0.05) partial cross-loadings
acsi1 0.702 n.s. 0.178 0.098
acsi2 0.996 −0.057 −0.037 −0.044 acsi3 1.037 0.060 −0.176 −0.071
exp1 n.s. 0.841 −0.029 0.029
exp2 0.028 0.846 n.s. n.s.
exp3 −0.063 0.638 0.064 −0.031
qual1 0.122 0.068 0.770 n.s. qual2 0.058 −0.040 0.891 n.s. qual3 −0.277 −0.047 0.999 n.s.
value1 n.s. n.s. 0.067 0.906
value2 n.s. n.s. −0.074 0.982
Compared to HTMTinference, the HTMT.90 criterion yields
much lower specificity rates in the vast majority of conditions. We find that none of the HTMT criteria indicates discriminant validity issues for inter-construct correlations of 0.70 or less. This outcome of our specificity analysis is important, as it shows that neither approach points to discriminant validity problems at comparably low levels of inter-construct correlations.
Based on our findings, we strongly recommend drawing on the HTMT criteria for discriminant validity assessment in variance-based SEM. The actual choice of criterion depends on the model set-up and on how conservative the researcher is in his or her assessment of discriminant validity. Take, for example, the technology acceptance model and its variations (Davis1989; Venkatesh et al.2003), which include the con-structs intention to use and the actual use. Although these constructs are conceptually different, they may be difficult to distinguish empirically in all research settings. Therefore, the choice of a more liberal HTMT criterion in terms of specificity (i.e., HTMT.90 or HTMTinference, depending on the sample
size) seems warranted. Conversely, if the strictest standards are followed, this requires HTMT.85 to assess discriminant
validity.
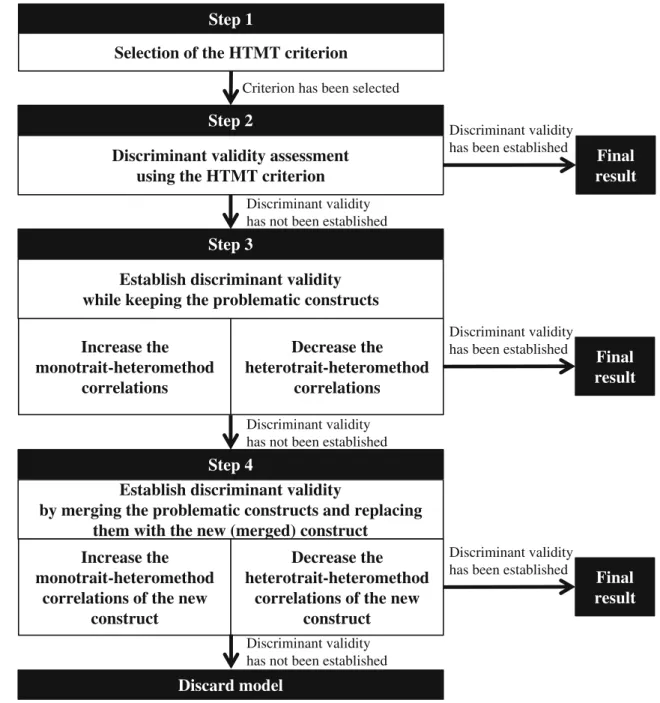
Guidelines for treating discriminant validity problems
To handle discriminant validity problems, researchers may follow different routes, which we illustrate in Fig.8. The first approach retains the constructs that cause discrimi-nant validity problems in the model and aims at increasing the average monotrait-heteromethod correlations and/or decreasing the average heteromethod-heterotrait correla-tions of the constructs measures. When researchers seek to decrease the HTMT by increasing a construct’s average monotrait-heteromethod correlations, they may eliminate items that have low correlations with other items measur-ing the same construct. Likewise, heterogeneous sub-dimensions in the construct’s set of items could also deflate the average monotrait-heteromethod correlations. In this case, researchers may consider splitting the con-struct into homogenous sub-concon-structs, if the measure-ment theory supports this step. These sub-constructs then replace the more general construct in the model. However, researchers need to re-evaluate the newly generated con-structs’ discriminant validity with all the opposing con-structs in the model. When researchers seek to decrease the average heteromethod-heterotrait correlations, they Table 5 Item correlation matrix
acsi1 acsi2 acsi3 cuex1 cuex2 cuex3 perq1 perq2 perq3 perv1 perv2
acsi1 1.000 acsi2 0.770 1.000 acsi3 0.701 0.665 1.000 cuex1 0.426 0.339 0.393 1.000 cuex2 0.423 0.345 0.385 0.574 1.000 cuex3 0.274 0.235 0.250 0.318 0.335 1.000 perq1 0.797 0.705 0.651 0.517 0.472 0.295 1.000 perq2 0.779 0.680 0.635 0.406 0.442 0.268 0.784 1.000 perq3 0.512 0.460 0.410 0.249 0.277 0.362 0.503 0.533 1.000 perv1 0.739 0.656 0.622 0.373 0.359 0.230 0.645 0.619 0.411 1.000 perv2 0.684 0.615 0.579 0.326 0.310 0.200 0.556 0.543 0.354 0.774 1.000
Table 6 HTMT results
ACSI CUEX PERQ PERV
ACSI
CUEX .63 CI.900[0.612;0.652]
PERQ .95 CI.900[0.945;0.958]
.73 CI.900[0.713;0.754]
PERV .87 CI.900[0.865;0.885]
.53 CI.900[0.511;0.553]
.76 CI.900[0.748;0.774]
The two results marked in bold indicate discriminant validity problems according to the HTMT.85criterion, while the one problem regarding the
may consider (1) eliminating items that are strongly cor-related with items in the opposing construct or (2) reassigning these indicators to the opposing construct, if theoretically plausible.
It is important to note that the elimination of items purely on statistical grounds can have adverse conse-quences for the construct measures’ content validity (e.g., Hair et al. 2014). Therefore, researchers should carefully scrutinize the scales (either based on prior research results, or on those from a pretest in case of the newly developed measures) and determine whether all the construct domain facets have been captured. At least two expert coders should conduct this judgment
independently to ensure a high degree of objectivity (Diamantopoulos et al. 2012).
The second approach to treat discriminant validity prob-lems aims at merging the constructs that cause the probprob-lems into a more general construct. Again, measurement theory must support this step. In this case, the more general con-struct replaces the problematic concon-structs in the model and researchers need to re-evaluate the newly generated con-struct’s discriminant validity with all the opposing con-structs. This step may entail modifications to increase a construct’s average monotrait-heteromethod correlations and/or to decrease the average heteromethod-heterotrait cor-relations (Fig. 8).
Step 1
Selection of the HTMT criterion
Step 2
Discriminant validity assessment
using the HTMT criterion
Criterion has been selected
Final
result
Discriminant validity has been established
Step 3
Establish discriminant validity
while keeping the problematic constructs
Discriminant validity has not been established
Increase the
monotrait-heteromethod
correlations
Decrease the
heterotrait-heteromethod
correlations
Final
result
Discriminant validity has been established
Step 4
Establish discriminant validity
by merging the problematic constructs and replacing
them with the new (merged) construct
Discriminant validity has not been established
Increase the
monotrait-heteromethod
correlations of the new
construct
Decrease the
heterotrait-heteromethod
correlations of the new
construct
Final
result
Discriminant validity has been established
Discard model
Discriminant validity has not been established
Further research and concluding remarks
Our research offers several promising avenues for future re-search. To begin with, many researchers view variance-based SEM as the natural approach when the model includes forma-tively measured constructs (Chin1998; Fornell and Bookstein 1982; Hair et al.2012a). Obviously, the discriminant validity concept is independent of a construct’s concrete operationalization. Constructs that are conceptually different should also be empirically different, no matter how they have been measured, and no matter the types of epistemic relation-ships between a construct and its indicators. However, just like the Fornell-Larcker criterion and the (partial) cross-loadings, the HTMT-based criteria assume reflectively measured con-structs. Applying them to formatively measured constructs is problematic, because neither the monotrait-heteromethod nor the heterotrait-heteromethod correlations of formative indica-t o r s a r e i n d i c a indica-t i v e o f d i s c r i m i n a n indica-t v a l i d i indica-t y. A s Diamantopoulos and Winklhofer (2001, p. 271) point out, “there is no reason that a specific pattern of signs (i.e., positive versus negative) or magnitude (i.e., high versus moderate versus low) should characterize the correlations among for-mative indicators.”
Prior literature gives practically no recommendations on how to assess the discriminant validity of formatively mea-sured constructs. One of the few exceptions is the research by Klein and Rai (2009), who suggest examining the cross-loadings of formative indicators. Analogous to their reflective counterparts, formative indicators should correlate more high-ly with their composite construct score than with the compos-ite score of other constructs. However, considering the poor performance of cross-loadings in our study, its use in forma-tive measurement models appears questionable. Against this background, future research should seek alternative means to consider formatively measured constructs when assessing dis-criminant validity.
Apart from continuously refining, extending, and testing the HTMT-based validity assessment criteria for variance-based SEM (e.g., by evaluating their sensitivity to different base response scales, inducing variance basis differences and differential response biases), future research should also as-sess whether this study’s findings can be generalized to covariance-based SEM techniques, or the recently proposed consistent PLS (Dijkstra2014; Dijkstra and Henseler2014a, b), which mimics covariance-based SEM. Specifically, the Fornell-Larcker criterion is a standard approach to assess dis-criminant validity in covariance-based SEM (Shah and Goldstein2006; Shook et al.2004). Thus, it is necessary to evaluate whether this criterion suffers from the same limita-tions in a factor model setting.
In the light of the Fornell-Larcker criterion and the cross-loadings’poor performance, researchers should carefully re-consider the results of prior variance-based SEM analyses.
Failure to properly disclose discriminant validity problems may result in biased estimations of structural parameters and inappropriate conclusions about the hypothesized relation-ships between constructs. Revisiting the analysis results of prominent models estimated by means of variance-based SEM, such as the ACSI and the TAM, seems warranted. In doing so, researchers should analyze the different sources of discriminant validity problems and apply adequate procedures to treat them (Fig.8).
It is important to note, however, that discriminant validity is not exclusively an empirical means to validate a model. Theoretical foundations and arguments should provide reasons for constructs correlating or not (Bollen and Lennox 1991). According to the holistic construal process (Bagozzi and Phillips 1982; Bagozzi1984), per-haps the most influential psychometric framework for measurement development and validation (Rigdon 2012), constructs are not necessarily equivalent to the theoretical concepts at the center of scientific research: a construct should rather be viewed as “something cre-ated from the empirical data which is intended to enable empirical testing of propositions regarding the concept” (Rigdon2014, pp. 43–344). Consequently, any derivation of HTMT thresholds is subjective. On the other hand, concepts are partly defined by their relationships with other concepts within a nomological network, a system of law-like relationships discovered over time and which anchor each concept. Therefore, hindsight failure to es-tablish discriminant validity between two constructs does not necessarily imply that the underlying concepts are identical, especially when follow-up research provides continued support for differing relationships with the antecedent and the resultant concepts (Bagozzi and Phillips 1982). Nevertheless, our research clearly shows that future research should pay greater attention to the empirical validation of discriminant validity to ensure the rigor of theories’ empirical testing and validation.
Acknowledgments We would like to thank Theo Dijkstra, RijksuniversiteitGroningen, The Netherlands, for his helpful comments to improve earlier versions of the manuscript. The authors contributed equally and are listed in alphabetical order. The manuscript was written when the first author was an associate professor of marketing at the Institute for Management Research, Radboud University Nijmegen, The Netherlands.
Appendix
Letxi1,…,xiKibe theKireflective indicators of constructξi,
andxj1,…,xjKjtheKjreflective indicators of constructξj. The
empirical correlation matrixRis then
R¼
1 ri1;i2 … ri1;iKi ri1;j1 ri1;j2 … ri1;jKj
ri2;i1 1 … ri2;iKi ri2;j1 ri2;j2 … ri2;jKj
⋮ ⋮ ⋱ ⋮ ⋮ ⋮ ⋮ ⋮
riKi;i1 riKi;i2 … 1 riKi;j1 riKi;j2 … riKi;jKj
rj1;i1 rj1;i2 … rj1;iKi 1 rj1;j2 … rj1;jKj
rj2;i1 rj2;i2 … rj2;iKi rj2;j1 1 … rj2;jKj
⋮ ⋮ ⋮ ⋮ ⋮ ⋮ ⋱ ⋮
rjKj;i1 rjKj;i2 … rjKj;iKi rjKj;j1 rjKj;j2 … 1
0 B B B B B B B B B B @ 1 C C C C C C C C C C A
ðA1Þ
If the reflective measurement model (i.e., a common factor model) holds true for both constructs, the implied correlation matrixΣis then
Σ¼ 1
λi2λi1 ⋮
λiKiλi1
φijλj1λi1
φijλj2λi1 ⋮
φijλjKjλi1
λi1λi2 1 ⋮
λiKiλi2
φijλj1λi2
φijλj2λi2 ⋮
φijλjKjλi2 ⋯ ⋯ ⋱ ⋯ ⋯ ⋯ ⋮ ⋯
λi1λiKi
λi2λiKi ⋮ 1
φijλj1λiKi
φijλj2λiKi ⋮
φijλjKjλiKi
φijλi1λj1
φijλi2λj1 ⋮
φijλiKiλj1
1
λj2λj1 ⋮
λjKjλj1
φijλi1λj2
φijλi2λj2 ⋮
φijλiKiλj2
λj1λj2 1 ⋮
λjKjλj2 ⋯ ⋯ ⋮ ⋯ ⋯ ⋯ ⋱ ⋯
φijλi1λjKj
φijλi2λjKj ⋮
φijλiKiλjKj
λj1λjKj
λj2λjKj ⋮ 1 0 B B B B B B B B B B @ 1 C C C C C C C C C C A
ðA2Þ
We depart from the notion that Cronbach’s alpha is
α¼ K⋅r
1þðK−1Þ⋅r ðA3Þ
¼ K⋅ 1
K Kð −1Þ⋅
X
g¼1
K
X
h¼1
K
rg;h−K
!!
¼ 1þðK−1Þ⋅ 1 K Kð −1Þ⋅
X
g¼1
K
X
h¼1
K
rg;h−K
!!
¼ 1
K−1⋅
X
g¼1
K
X
h¼1
K
rg;h−K
!
1
K⋅
X
g¼1
K
X
h¼1
K
rg;h
!
Moreover, the composite reliabilityρc, is:
α¼ ρc¼ X
g¼1
K λg
!2
X
g¼1
K λg
!2
þX
g¼1
K εg 0 @ 1 A ¼ X
g¼1
K λg
!2
X
g¼1
K
X
h¼1
K
rg;h
If a construct’s indicators are tau-equivalent, Cronbach’s alpha is a consistent estimate of a set of indicators just like the composite reliabilityρc, which implies that:
1
K−1⋅
X
g¼1
K
X
h¼1
K
rg;h−K
!
1 K⋅
X
g¼1
K
X
h¼1
K
rg;h
!
¼ X
g¼1
K λg
!2
X
g¼1
K
X
h¼1
K
rg;h
!
⇔ 1
K Kð −1Þ⋅
X
g¼1
K
X
h¼1
K
rg;h−K
!
¼ 1
K2
X
g¼1
K λg
!2
The HTMTijof constructsξiand ξj as introduced in the
manuscript is then:
HTMTij¼
1 KiKj
⋅X
g¼1
Ki
X
h¼1
Kj rig;jh
2 KiðKi−1Þ
⋅X
g¼1
Ki−1
X
h¼gþ1
Ki rig;ih⋅
2 Kj Kj−1
⋅ X
g¼1
Kj−1
X
h¼gþ1
Kj rjg;jh
!12
¼ 1
KiKj
⋅X
g¼1
Ki
X
h¼1
Kj rig;jh
1 KiðKi−1Þ
⋅ X
g¼1
Ki
X
h¼1
Ki rig;ih−Ki
!
⋅ 1
Kj Kj−1
⋅ X
g¼1
Kj
X
h¼1
Kj
rjg;jh−Kj
!!12
¼ϕ⋅ 1
KiKj
⋅X g¼1 Ki X h¼1 Kj
λigλjh 1 K2 i X g¼1 Ki λig !2 ⋅ 1 K2 j ⋅ X h¼1 Kj λjh !2 0 @ 1 A 1 2
¼ ϕ⋅X g¼1 Ki
X
h¼1 Kj
λigλjh X
g¼1 Ki
λig⋅ X
h¼1 Kj
λjh !
¼ϕq:e:d: