Analysis of general and specific combining abilities of popcorn populations,
including selfed parents
José Marcelo Soriano Viana and Frederico de Pina Matta
Universidade Federal de Viçosa, Departamento de Biologia Geral, Viçosa, MG, Brazil.
Abstract
Estimation of general and specific combining ability effects in a diallel analysis of cross-pollinating populations, including the selfed parents, is presented in this work. The restrictions considered satisfy the parametric values of the GCA and SCA effects. The method is extended to self-pollinating populations (suitable for other species, without the selfed parents). The analysis of changes in population means due to inbreeding (sensitivity to inbreeding) also permits to assess the predominant direction of dominance deviations and the relative genetic variability in each parent population. The methodology was used to select popcorn populations for intra- and inter-population breeding programs and for hybrid production, developed at the Federal University of Viçosa, MG, Brazil. Two yellow pearl grain popcorn populations were selected.
Key words:diallele cross, combining ability, inbreeding depression, popcorn breeding. Received: November 21, 2000; Accepted: August 12, 2003.
Introduction
Diallel analysis of self- and cross-pollinating popula-tions is used to study the genetic control of quantitative traits (Jinks and Hayman, 1953; Hayman, 1954, 1958), to assess general and specific combining abilities (Griffing 1956a, b) and to perform heterosis analysis (Gardner and Eberhart, 1966; Gardner, 1967). It allows to select superior pure lines for hybridization and, in cross-pollinating spe-cies, to screen populations for use in intra- and inter-population breeding programs. Griffing’s methodol-ogy is certainly the most frequently used, because its analy-sis is easy to perform and to interpret. Gardner and Eberhart’s method gives the same information as Griffing’s (Cruz and Vencovsky, 1989; Viana, 2000a). Hayman’s method is the most complex to understand and to interpret, specifically for homozygous populations. Because of their potentials, these methodologies were adapted for partial diallels, with two groups of parents (Miranda Filho and
Geraldi, 1984; Geraldi and Miranda Filho, 1988; Vianaet
al., 1999).
Regarding cross-pollinating species, the general combining ability (GCA) effect is an indicator of the rela-tive value of the population in terms of frequency of favor-able genes and of its divergence, as compared to the other parents in the diallel. Thus, the analysis of GCA effects al-lows identification of superior parents, to be used in intra-population breeding programs. The specific
combin-ing ability (SCA) effect of two populations expresses the differences of gene frequencies between them and their di-vergence, as compared to the diallel parents. Therefore, the GCA and SCA effects should be considered in the selection of populations for hybrid production and for reciprocal re-current selection programs. In addition to being indicators of the divergence of each population compared to the diallel parents, the SCA effects of a population with itself allow assessment of the predominant direction of the devia-tions due to dominance (Cruz and Vencovsky, 1989; Viana, 2000b).
An important information in the selection of a popu-lation for a hybrid program is its sensitivity to inbreeding, which can be assessed from a diallel analysis by the inclu-sion of the selfed parents. In this case, the breeder can as-sess the genetic variability within each population and the change in the population mean due to inbreeding. The aim of this study is to present a methodology for general and specific combining abilities analysis of a diallel, including the selfed parents. The method will be used to select pop-corn maize populations for intra- and inter-population breeding programs and for a hybrid development program, to be carried out at the Federal University of Viçosa, Brazil.
Material and Methods
We considered the experimental assessment of N
populations, their N(N - 1)/2 F1hybrids, obtained from the
crossing of those populations in a diallel system, and the
www.sbg.org.br
selfed parental populations. The phenotypic means in the diallel table can be defined as follows (Viana, 2000b):
Yjj= M••+ 2gj+ sjj+ ejj
Yjj’= M••+ gj+ gj’+ sjj’+ ejj’
YjjF= M••+ 2gj+ sjj+ djF+ ejjF
where Yjj, Yjj’and YjjFare, respectively, the means of the jth
population, of the hybrid between the jth and j’th popula-tions, and of the n times selfed jth population (j, j’ = 1, ..., N);
(
)
M•• mi p a p p d
i=1 k i i i=1 k i i i=1 k i
=
∑
+∑
2 −1 +2∑
(1− ) is thediallel mean;
(
)
[
(
)
]
gj pij pi ai p di i
i=1 k
=
∑
− + −1 2 is the GCA effect ofthe jth population;
(
) (
)
[
( )
]
{
}
sjj’ p pi ij pi p pi ij’ pi p pij ij’ pi di
i=1 k
=2
∑
− + − − − 2is the SCA effect of the jth and jth populations;
(
)
djF F pij pij d
2 i i 1 k = − − =
∑
2 is the alteration in the genotypic
mean of the jth population due to n generations of selfing,
where F = 1 - (1/2)nis the inbreeding coefficient;
ejj, ejj’and ejjFare the errors associated to observations Yjj,
Yjj’and YjjF, respectively.
For all loci of the polygenic system under analysis, mi
is the mean of the genotypic values of the homozygotes, ai
is the deviation between the genotypic value of the
homozygote with greatest expression and mi, and diis the
deviation due to dominance (Falconer and Mackay, 1996).
The pijprobability is the frequency in population j of the
lo-cus i gene that increases the trait expression.
The greater the absolute value of djF, the closer to 1/2
should be the gene frequencies in the population. Similarly
to the sjjeffects, the changes in the population means due to
inbreeding are indicators of the direction of dominance ef-fects. When the mean change is positive, there is negative unidirectional dominance. If inbreeding decreases the
genotypic means of the populations (negative djFvalues),
the deviations due to dominance are predominantly
posi-tive. Positive and negative djF values are indicators of
bi-directional dominance.
The least squares estimators of the parameters,
ob-tained under the restrictions gj
j=1 N
=
∑
0 and sjj’j’=1 N
=
∑
0, forall j, which satisfy the parametric values of the GCA and SCA effects (Viana, 2000b), are:
$
M Y 2Y
N
••
••P ••H 2
= +
where Y••P Yjj
j=1 N
=
∑
and Y••H Yjj’j’ 1 N
j=1 N
=
< =
∑
∑
$ $ $
g Y M
N Y M
j j • •• jj’ ••
j’=1 N
= − = 1
∑
−$ $ $
sjj =Yjj−M••−2gj
$ $ $ $
sjj’=Yjj’−M••−gj −gj’
$
djF =YjjF−Yjj
If the parents were selfed only once (F = 1/2), the esti-mator of the mean of the inbred lines which may be ob-tained from a population without selection is
MjjF 1= =Yjj+2d$jF 1/ 2= =2YjjF 1/ 2= −Yjj
The sampling variances of the estimators of the pa-rameters and of the differences between effects are:
$ $ $
V(M ) 2N 1
N r
•• = 3
− σ2
whereσ$2
is the mean square of error of the variance analy-sis, and r is the number of replications,
$ $ $
V(g ) (N 1)
N r j 2 3 = −
σ
2
$ $ $ ) $
V(g g 2(N 1)
N r
j − j’ = 2
− σ2 $ $ $
V(s ) (N N )
N r jj 3 3 = − +
4 3 σ2
$ $ $ ) $
V(s s 2(N )
N r
jj j’ j’
2 2 − = −
4 σ2
$ $ $
V(s ) (N N )
N r jj’ 3 2 3 = − +
2 3
2
σ
$ $ $ ) $
V(s s 2(N N )
N r jj’ jj’’ 2 2 − = − −
1
2
σ
$ $ $ ) $
V(s s 2(N N )
N r
jj’ j’’ j’’’
2 2 − = − −
2 2 σ2
$ $
)
$
V(d
r
jF =
2 2 σ $ $ $ ) $ V(d d r
jF− j’F =
4 2 σ
The following hypotheses can be tested in the vari-ance analysis of the diallel table:
• H0(1): gj= 0 for all j. Its rejection indicates
• H0(2): sjj’= 0 for all j and j’. If there is genetic
vari-ability between the parents, its rejection indicates the pres-ence of dominance;
• H0(3): pij= 1 or pij= 0 for all i (djF= 0 for all j). If there
is dominance, testing this hypothesis is equivalent to test for no genetic variability in each parent population.
Let
[
]
β’= M g••M L1 gNMs11 s12Ls1NLsNNMd1FLdNF =
[
µM M Mg s d]
be the parameter vector, R(.) the reduction in the total sum
of squares due to fitting a certain model, and R(..) a
differ-ence between two R(.) terms (Searle, 1971; Graybill,
1976). The sum of squares attributable to hypothesis H0(1)
(GCA sum of squares) is
R(g µ, s, d) = R(µ, g, s, d) - R(µ, s, d), with N - 1 de-grees of freedom, where:
R(µ, g, s, d) = r YjjF Y
2 jj’ 2 j’=1 N j=1 N j=1 N + ≤
∑
∑
∑
is the parameter sumof squares of the complete model;
R( , s, d) = r M•• Y••F Y••P Y••H sjj YjjF Yjj
j= µ $ ( + + )+ $ ( + )+ 1 N
∑
$ $s Yjj’ jj’ d YjF jjF j=1 N < j’=1 N j=1 N +
∑
∑
∑
is the parameter sum of squaresof the complete model reduced by the H0(1) hypothesis,
given Y••F YjjF
j=1 N
=
∑
, and further,$
M Y 2Y
N •• ••P ••H 2 = + $
sjj =Yjj−Yj •
$ $
sjj’ =Yjj’−Yj •−Yj’•+M••
$ $ $
djF =YjjF−M••−sjj
The sum of squares attributable to hypothesis H0(2)
(SCA sum of squares) is the same as that of Griffing’s model (1956b), given by
R(s µ, g, d) = r Y
N 2 Y Y
jj’ 2 j’=1 N j=1 N
jj j • j=1 N ≤
∑
∑
−∑
+ + + 1 2
( )
2(Y Y )2
(N 1)(N 2)
••P+ ••H
+ +
, with N(N - 1)/2 degrees of freedom
The sum of squares attributable to hypothesis H0(3)
(sum of squares due to inbreeding) is
R(d µ, g, s) = R(µ, g, s, d) - R(µ, g, s), with N de-grees of freedom, where:
(
)
(
)
r M•• Y••F Y••P Y••H gj YjjF Yjj Yj •
j=1 N
$ + + + $ + + +
∑
2(
)
$ $
sjj YjjF Yjj s Y
j=1 N jj’ jj’ < j’=1 N j=1 N + +
∑
∑
∑
= R(µ, g, s) is theparam-eter sum of squares of the complete model reduced by the
H0(3)hypothesis, and further,
$
M Y Y Y
2N
••
••F ••P ••H 2
= + +4
$ $
g 1
N Y
Y Y
2 M
j j •
jjF jj •• = + − − $ $ $
sjj Y Y M 2g
jjF jj
•• j
= + − −
2
$ $ $ $
sjj’=Yjj’−M••−gj −gj’
Due to inclusion of the selfed parents, the sum of squares attributable to the hypothesis of absence of
domi-nance (di= 0 for all i) is not the SCA sum of squares. Its
value is given by the following expression:
R(s, d µ, g) = R(µ, g, s, d) - R(µ, g), with N(N + 1)/2 degrees of freedom, where:
R(µ, g) =r Y Y Y
(
)
N +N(N )
2
g Y + Y Y
••F ••P ••H
j jjF jj j• j=1 N ( + + ) $ + + +
∑
2 1 2 , given(
)
$ g 1N 6 2Y Y Y (N 3)
Y Y Y
N N(N 1)
2
j jjF jj j •
••F ••P ••H
= + + + − + + + + +
For analysis only with parents and hybrids, the esti-mators of the GCA and SCA effects and of the variances of the effect and contrast estimators are the same as already presented. The parameter sum of squares of the complete model is
R(µ, g, s) = r Yjj’
2 j’=1 N j=1 N ≤
∑
∑
The sum of squares attributable to hypothesis H0(1)
(GCA sum of squares) is R(g µ, s) = R(µ, g, s) - R(µ, s),
with N - 1 degrees of freedom, where
R(µ, s) = r M••
(
Y••P Y••H)
s Yjj’ jj’j’=1 N j=1 N $ + + $ ≤
∑
∑
is theparameter sum of squares of the complete model reduced
by the H0(1)hypothesis, given
$
M Y Y
N
••
••P ••H 2
= +2
$
$ $
sjj’ =Yjj’−Yj •−Yj’•+M••
The SCA sum of squares is the same as presented above. If there is genetic variability between the parents, it corresponds to the sum of squares attributable to the hy-pothesis of absence of dominance.
The previously described method was applied to a diallel with popcorn maize populations from the breeding program of the Genetic Sector of the Department of Gen-eral Biology of the FedGen-eral University of Viçosa, MG, Brazil. The populations were: Rosa Claro, with red pearl grains; Branco, with white pearl grains; Roxo, with red pearl grains; Amarelo, Beija-Flor and Viçosa, all with yel-low pearl grains. Beija-Flor also has colored and white grains and garlic-type grains. Pollination was carried out in the 95/96 season, and the parents, the selfed parents and the
F1were experimentally assessed in 96/97 at Viçosa, MG.
The expansion volume (EV = popcorn volume/grain weight) of the populations was assessed in a Hot Air Pop-corn Pumper H7340 (1,250 W; 60 Hz) from Proctor Silex, and in the popcorn machine of the National Maize and Sor-ghum Research Center - CNPMS/Embrapa.
Results and Discussion
Expansion volume analysis
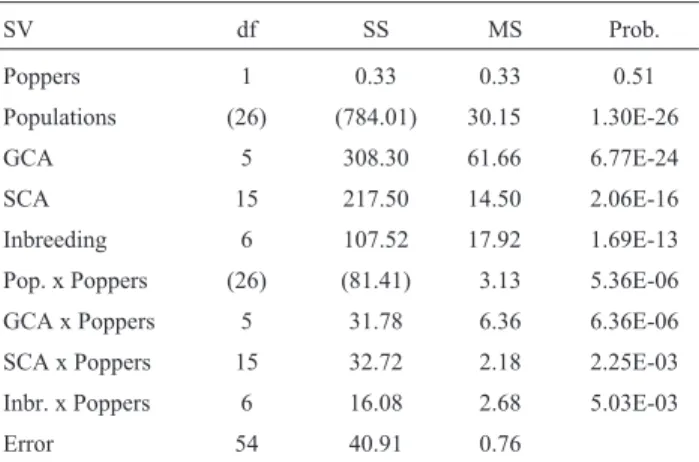
The joint diallel analysis showed that the differences between the GCA effects of two populations and between the SCA effects of the populations or hybrids were not con-stant for the two popcorn machines (Table 1). The differ-ence between the changes in the means of two populations also varied from one to the other. Due to the interaction, a separated diallel analysis was made for each system. They showed differences between the GCA and SCA effects and between the changes in the means due to inbreeding (Table 2).
Based on data obtained with the hot air popcorn ma-chine, Beija-Flor (24.08) and Branco (24.59) populations were found to be superior in terms of frequency of favor-able genes and divergent regarding the mean frequencies of
the parent group (Table 3). The positive sjjestimates
indi-cate that the genes with some degree of dominance acted so as to reduce the expansion volume (Table 4). The popula-tions with the greatest differences in gene frequencies be-tween each other and in relation to the parent group were Rosa Claro and Beija-Flor. They, however, did not produce the best hybrids, possibly due to negative heterosis. The best hybrids were Roxo x Beija-Flor (22.75), Branco x Beija-Flor (21.97), and Beija-Flor x Viçosa (20.24). Roxo and Beija-Flor are populations with small differences in gene frequency, but they are divergent as compared to the parents of the diallel. Branco and Amarelo, and Branco and Viçosa diverged little from each other and from the mean frequencies of the parent group (Table 4).
Table 1- Joint diallel analysis of expansion volume data (mL/g) of six popcorn populations, their hybrids and selfed parents, obtained using a hot air popcorn machine and the CNPMS/Embrapa popcorn machine.
SV df SS MS Prob.
Poppers 1 0.33 0.33 0.51
Populations (26) (784.01) 30.15 1.30E-26
GCA 5 308.30 61.66 6.77E-24
SCA 15 217.50 14.50 2.06E-16
Inbreeding 6 107.52 17.92 1.69E-13 Pop. x Poppers (26) (81.41) 3.13 5.36E-06
GCA x Poppers 5 31.78 6.36 6.36E-06 SCA x Poppers 15 32.72 2.18 2.25E-03 Inbr. x Poppers 6 16.08 2.68 5.03E-03
Error 54 40.91 0.76
Table 2- Diallel analysis of expansion volume (EV, mL/g), yield (kg/ha), plant height (PH, m), ear height (EH, m), proportion of root lodged plants (RL), proportion of stalk lodged plants (SL), prolificacy index (PI), and one hundred grains weight (100GW, g), of six popcorn populations, their hybrids and selfed parents, and estimates of the diallel mean and its standard deviation.
SV df MS
EV1 EV2 Yield PH EH RL SL PI 100GW
Blocks 1 - - 10238640.00 0.002 0.061 0.030 0.028 1x10⁻⁵ 6.85
Populations (26) 18.37** 14.90** 12020756.80** 0.108** 0.025** 0.007* 0.034** 0.101* 9.19ns
GCA 5 35.39** 32.62** 12918488.60** 0.103** 0.032** 0.004ns 0.007** 0.089ns 11.80ns SCA 15 9.77** 6.91** 6332106.13** 0.035ns 0.008ns 0.002ns 0.003ns 0.059ns 3.89ns
Inbreeding 6 11.05** 9.55** 12745139.50** 0.131** 0.019* 0.017** 0.072ns 0.086ns 14.51*
Error 26(543) 0.76 0.76 1801646.00 0.025 0.007 0.003 0.008 0.043 5.71
$
M•• 18.50 18.77 4972.09 1.59 0.74 0.103 0.111 0.96 16.26
$ $
s(M )•• 0.14 0.14 214.19 0.03 0.01 8.9E-03 0.014 0.03 0.38
1
data obtained using the hot air popcorn machine;2data obtained using the CNPMS/Embrapa popcorn machine;3For the EV analyses;**: F < 0.01;
Similar inferences can be made from the analysis of data obtained using the CNMS/Embrapa popcorn machine. Beija-Flor (24.08), Branco (19.63) and Viçosa (23.92) stood out as populations with superior frequencies of the
desirable genes and divergent as compared to the mean fre-quencies in the parents of the diallel (Table 3). The
esti-mated sjjvalues also showed deviations due to dominance,
predominantly negative (Table 4). The populations which
Table 3- Estimates of general combining ability effects of popcorn populations for expansion volume (EV, mL/g), yield (kg/ha), plant height (PH, m), ear height (EH, m), proportion of root lodged plants (RL), proportion of stalk lodged plants (SL) and prolificacy index (PI), and standard deviation estimates of the effects and contrasts.
Population EV1 EV2 Yield EH PH RL SL PI
Rosa Claro -1.73 -1.23 537.24 0.06 0.01 0.009 0.020 0.14 Branco 1.63 0.90 -1604.63 -0.16 -0.08 0.019 0.010 -0.09
Roxo -0.21 -1.72 623.23 0.05 0.04 -0.009 -0.021 0.06
Amarelo -1.78 -1.36 606.91 0.09 0.06 -0.031 -0.025 -0.02 Beija-Flor 2.41 2.29 -1016.59 -0.05 -0.04 0.013 0.030 -0.08 Viçosa -0.32 1.12 853.83 0.003 0.01 -0.001 -0.015 -0.01
$ $s(g )
j 0.21 0.21 322.90 0.04 0.02 1.3E-02 0.021 0.05
$ $s(g - g )$
j j’ 0.32 0.32 500.23 0.06 0.03 2.1E-02 0.033 0.08
1data obtained using the hot air popcorn machine;2data obtained using the CNPMS/Embrapa popcorn machine.
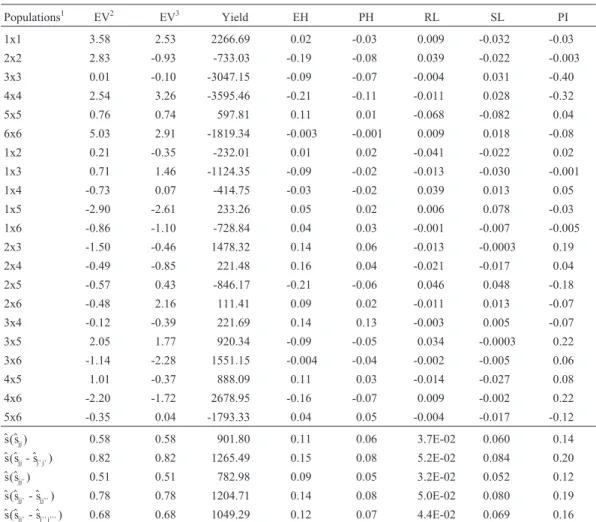
Table 4- Estimates of specific combining ability effects of popcorn populations for expansion volume (EV, mL/g), yield (kg/ha), plant height (PH, m), ear height (EH, m), proportion of root lodged plants (RL), proportion of stalk lodged plants (SL) and prolificacy index (PI), and standard deviation estimates of the effects and contrasts.
Populations1 EV2 EV3 Yield EH PH RL SL PI
1x1 3.58 2.53 2266.69 0.02 -0.03 0.009 -0.032 -0.03
2x2 2.83 -0.93 -733.03 -0.19 -0.08 0.039 -0.022 -0.003 3x3 0.01 -0.10 -3047.15 -0.09 -0.07 -0.004 0.031 -0.40 4x4 2.54 3.26 -3595.46 -0.21 -0.11 -0.011 0.028 -0.32
5x5 0.76 0.74 597.81 0.11 0.01 -0.068 -0.082 0.04
6x6 5.03 2.91 -1819.34 -0.003 -0.001 0.009 0.018 -0.08
1x2 0.21 -0.35 -232.01 0.01 0.02 -0.041 -0.022 0.02
1x3 0.71 1.46 -1124.35 -0.09 -0.02 -0.013 -0.030 -0.001
1x4 -0.73 0.07 -414.75 -0.03 -0.02 0.039 0.013 0.05
1x5 -2.90 -2.61 233.26 0.05 0.02 0.006 0.078 -0.03
1x6 -0.86 -1.10 -728.84 0.04 0.03 -0.001 -0.007 -0.005 2x3 -1.50 -0.46 1478.32 0.14 0.06 -0.013 -0.0003 0.19
2x4 -0.49 -0.85 221.48 0.16 0.04 -0.021 -0.017 0.04
2x5 -0.57 0.43 -846.17 -0.21 -0.06 0.046 0.048 -0.18
2x6 -0.48 2.16 111.41 0.09 0.02 -0.011 0.013 -0.07
3x4 -0.12 -0.39 221.69 0.14 0.13 -0.003 0.005 -0.07
3x5 2.05 1.77 920.34 -0.09 -0.05 0.034 -0.0003 0.22
3x6 -1.14 -2.28 1551.15 -0.004 -0.04 -0.002 -0.005 0.06
4x5 1.01 -0.37 888.09 0.11 0.03 -0.014 -0.027 0.08
4x6 -2.20 -1.72 2678.95 -0.16 -0.07 0.009 -0.002 0.22 5x6 -0.35 0.04 -1793.33 0.04 0.05 -0.004 -0.017 -0.12
$ $s(s )
jj 0.58 0.58 901.80 0.11 0.06 3.7E-02 0.060 0.14
$ $s(s - s )$
jj j’ j’ 0.82 0.82 1265.49 0.15 0.08 5.2E-02 0.084 0.20
$ $s(s )
jj’ 0.51 0.51 782.98 0.09 0.05 3.2E-02 0.052 0.12
$ $s(s - s )$
jj’ jj’’ 0.78 0.78 1204.71 0.14 0.08 5.0E-02 0.080 0.19
$ $s(s - s$ )
jj’ j’’ j’’’ 0.68 0.68 1049.29 0.12 0.07 4.4E-02 0.069 0.16
11 = Rosa Claro, 2 = Branco, 3 = Roxo, 4 = Amarelo, 5 = Beija-Flor and 6 = Viçosa;2data obtained using the hot air popcorn machine;3data obtained using
diverged most both from the parents and between each other were Rosa Claro and Beija-Flor, and Roxo and Viçosa. They did not produce outstanding hybrids either. The best hybrids were Branco x Viçosa (22.94), Branco x Beija-Flor (22.38), and Beija-Flor x Viçosa (22.21). Roxo and Beija-Flor, and Rosa Claro and Roxo differed little in gene frequency, but they were divergent as compared to the mean frequencies in the parents. Rosa Claro and Branco, and Amarelo and Beija-Flor diverged little between each other and with regard to the parent group (Table 4).
The analysis of alterations due to inbreeding in both assessment systems indicated the presence of bi-directional dominance (positive and negative dominance deviations), less genetic variability (gene frequencies closer to 1 or 0) in the Beija-Flor population, and greater sensitivity to in-breeding (gene frequencies closer to 1/2) in the Viçosa pop-ulation, which is a source of desirable dominant genes for increased expansion volume (Table 5). Regarding the hot air popcorn machine, the estimates of the mean of the in-bred lines which can be obtained from the Beija-Flor, Branco and Viçosa populations were, respectively, 24.08, 17.57, and 12.23. The corresponding values for the CNPMS/Embrapa popcorn machine were 23.24, 21.83, and 14.92.
Yield analysis
Variance analysis showed genetic variability between and within populations, and due to dominance gene action (Table 2). The populations found to be superior in terms of frequency of the genes which increase yield and divergent as compared to the parent group were Viçosa (4860.4),
Roxo (3171.4), and Amarelo (2590.5) (Table 3). The sjj
es-timates indicated that the dominant genes act predomi-nantly to increase yield (Table 4). The two most productive hybrids were Amarelo x Viçosa (9111.8) and Roxo x Viçosa (8000.3). They are derived from populations with the greatest differences in gene frequencies from the parent group and between each other, and the superior yield is
cer-tainly due to high heterosis. Beija-Flor (3536.7) and Viçosa, and Rosa Claro and Roxo have small gene fre-quency differences, but are divergent as compared to the mean frequencies of the diallel parents. The populations with the lowest divergence from the mean frequencies of the parent group and between each other were Roxo and Amarelo, and Branco and Amarelo (Table 4). The esti-mates of changes in the population mean due to inbreeding also indicated the presence of positive unidirectional domi-nance (Table 5). Inbreeding depression was observed in all the populations, especially in Rosa Claro and Viçosa. The least sensitive population was Branco, and, compared to the others, the gene frequencies in this population were closer to 1 or to 0.
The means of Beija-Flor x Viçosa and Branco x Viçosa hybrids, which include a population superior in quality and a population superior in quality and yield, were 3016 kg/ha and 4332.7 kg/ha, respectively, indicating good yield potential. These hybrids have equivalent expansion volumes, with means of 20.24 and 19.33 in the hot air pop-corn machine, and 22.21 and 22.94 in the CNPMS/Em-brapa popcorn machine, respectively.
Analyses of plant height, ear height, proportion of root lodged plants, proportion of stalk lodged plants, prolificacy index, and one hundred grains weight
With regard to plant and ear height, variance analysis indicated the presence of genetic variability between popu-lations, significant differences between the GCA effects, nullity of SCA effects, and genetic variability within parent populations (Table 2). Significance tests for changes in the means due to inbreeding can be carried out, once there is
dominance, as indicated by the test of hypothesis H0: di= 0
for all i. The F statistics values were 3.78 (significant at the 1% level of probability) for plant height and 2.56 (signifi-cant at 5%) for ear height. The analysis of the GCA effects estimates showed that Branco (PH = 1.08 and EH = 0.50) and Beija-Flor (PH = 1.60 and EH = 0.67) were sources of
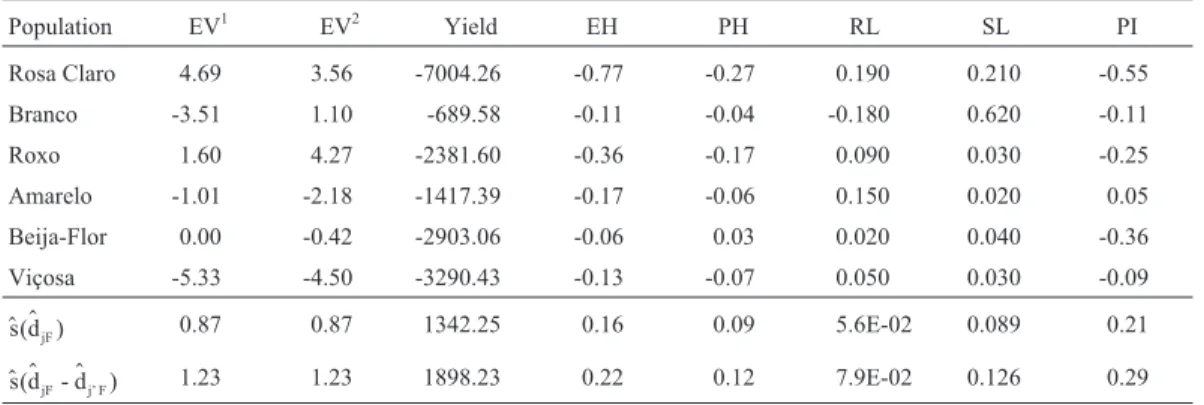
Table 5- Estimates of changes in the genotypic means of popcorn populations for expansion volume (EV, mL/g)1, yield (kg/ha), plant height (PH, m), ear height (EH, m), proportion of root lodged plants (RL), proportion of stalk lodged plants (SL) and prolificacy index (PI), and standard deviation estimates of the effects and contrasts.
Population EV1 EV2 Yield EH PH RL SL PI
Rosa Claro 4.69 3.56 -7004.26 -0.77 -0.27 0.190 0.210 -0.55
Branco -3.51 1.10 -689.58 -0.11 -0.04 -0.180 0.620 -0.11 Roxo 1.60 4.27 -2381.60 -0.36 -0.17 0.090 0.030 -0.25 Amarelo -1.01 -2.18 -1417.39 -0.17 -0.06 0.150 0.020 0.05
Beija-Flor 0.00 -0.42 -2903.06 -0.06 0.03 0.020 0.040 -0.36 Viçosa -5.33 -4.50 -3290.43 -0.13 -0.07 0.050 0.030 -0.09
$ $
s(d )jF 0.87 0.87 1342.25 0.16 0.09 5.6E-02 0.089 0.21
$ $ $
s(d - djF j’ F) 1.23 1.23 1898.23 0.22 0.12 7.9E-02 0.126 0.29
1
genes for short plant height and reduced upper ear insertion height. Genes for tall plants and high upper ear insertion were more frequent in Roxo (PH = 1.61 and EH = 0.75) and Amarelo (PH = 1.56 and EH = 0.75) (Table 3). The esti-mates of changes in the mean due to inbreeding showed positive unidirectional dominance for the two traits (Table 5). Rosa Claro had the highest degree of sensitivity to in-breeding, and Beija-Flor was the least sensitive. Beija-Flor also showed the smallest genetic variability within a popu-lation for the two characteristics.
Regarding the proportions of root lodged and stalk lodged plants, variance analysis indicated that there was ge-netic variability between populations and dominance (F = 2.36 and F = 3.67, significant at the 5% and 1% levels of probability for RL and SL, respectively). The GCA effects were significant for SL, while only significant RL variabil-ity was detected within populations (Table 2). Genes deter-mining stalk lodging resistance were more frequent in the Amarelo population (SL = 0.09) (Table 3). For RL, the esti-mates of changes in the mean due to inbreeding indicated negative unidirectional dominance (Table 5). The most sensitive populations were Rosa Claro and Branco. Beija-Flor and Viçosa had less within-population genetic vari-ability. Generally, the values of the proportions of root lodged and stalk lodged plants were not high in the parents, varying from 0.03 to 0.18 for RL, and from 0.09 to 0.12 for SL.
For the prolificacy index, there is evidence of genetic variability between populations and of dominance effects (F = 2.44, significant at the 1% level of probability), al-though the GCA and SCA effects were nil, as were the changes in the population means due to inbreeding. No evi-dence of variability between and within populations was found for one hundred grains weight (Table 2).
Conclusion
Considering the obtained results, the importance of quality in popcorn populations, the commercial aspect of the grains and the proposal of the program developed by the Genetic Sector of the Federal University of Viçosa, the fol-lowing conclusion was reached: the Beija-Flor and Viçosa
populations should be used in intra- and inter-population (reciprocal recurrent selection) breeding programs and for the production of hybrids.
References
Cruz, CD and Vencovsky R (1989) Comparação de alguns mé-todos de análise dialélica. Rev Bras Genet 12:425-438. Falconer DS and Mackay TFC (1996) Introduction to quantitative
genetics. 4th ed. Longman, New York.
Gardner CO (1967) Simplified methods for estimating constants and computing sums of squares for a diallel cross analysis. Fitotec Latinoam 4:1-12.
Gardner CO and Eberhart SA (1966) Analysis and interpretation of the variety cross diallel and related populations. Biometrics 22:439-452.
Geraldi IO and Miranda Filho JB (1988) Adapted models for the analysis of combining ability of varieties in partial diallel crosses. Rev Bras Genet 11:419-430.
Graybill FA (1976) Theory and Application of the Linear Model. Duxbury Press, North Scituate, Massachusetts.
Griffing B (1956a) A generalized treatment of the use of diallel crosses in quantitative inheritance. Heredity 10:31-50. Griffing B (1956b) Concept of general and specific combining
ability in relation to diallel crossing system. Aust J Biol Sci 9:463-493.
Hayman BI (1954) The theory and analysis of diallel crosses. Ge-netics 39:789-809.
Hayman BI (1958) The theory and analysis of diallel crosses. II. Genetics 43:63-85.
Jinks JL and Hayman BI (1953) The analysis of diallel crosses. Maize Genet Cooperation News Lett 27:48-54.
Miranda Filho JB and Geraldi IO (1984) An adapted model for the analysis of partial diallel crosses. Rev Bras Genet 4:677-688.
Searle SR (1971) Linear Models. John Wiley and Sons, New York.
Viana JMS, Cruz CD and Cardoso AA (1999) Theory and analy-sis of partial diallel crosses. Genet Mol Biol 22:591-599. Viana, JMS (2000a) The parametric restrictions of the Gardner
and Eberhart diallel analysis model: heterosis analysis. Genet Mol Biol 23:869-875.
Viana JMS (2000b) The parametric restrictions of the Griffing diallel analysis model: combining ability analysis. Genet Mol Biol 23:877-881.