CPD
5, 557–593, 2009Effects of ice sheets and precession on
MIS-13 Climate
Q. Z. Yin et al.
Title Page
Abstract Introduction
Conclusions References
Tables Figures
◭ ◮
◭ ◮
Back Close
Full Screen / Esc
Printer-friendly Version
Interactive Discussion Clim. Past Discuss., 5, 557–593, 2009
www.clim-past-discuss.net/5/557/2009/
© Author(s) 2009. This work is distributed under the Creative Commons Attribution 3.0 License.
Climate of the Past Discussions
Climate of the Past Discussionsis the access reviewed discussion forum ofClimate of the Past
Individual and combined e
ff
ects of ice
sheets and precession on MIS-13 climate
Q. Z. Yin, A. Berger, and M. Crucifix
Institut d’Astronomie et de G ´eophysique G. Lemaˆıtre, Universit ´e catholique de Louvain, Chemin du Cyclotron 2, 1348 Louvain-la-Neuve, Belgium
Received: 23 January 2009 – Accepted: 24 January 2009 – Published: 24 February 2009 Correspondence to: Q. Z. Yin ([email protected])
CPD
5, 557–593, 2009Effects of ice sheets and precession on
MIS-13 Climate
Q. Z. Yin et al.
Title Page
Abstract Introduction
Conclusions References
Tables Figures
◭ ◮
◭ ◮
Back Close
Full Screen / Esc
Printer-friendly Version
Interactive Discussion
Abstract
Simulations with an Earth System Model of Intermediate Complexity are made to inves-tigate the role of insolation and the size of ice sheets on the regional and global climate for marine isotope stage (MIS) 13. The astronomical forcing is selected at two dates with opposite precession, one when Northern Hemisphere summer (NHS) occurs at
5
perihelion (at 506 ka BP) and the other when it occurs at aphelion (at 495 ka BP). Ex-periments with five different volumes of the Eurasian and North American ice sheets (ranging from 0 to the Last Glacial Maximum one) are done under these two astronomi-cal conditions. When NHS is at perihelion, the Earth is warmer, the seasonal contrast in Northern (Southern) Hemisphere is larger (smaller) and summer precipitation in
North-10
ern Hemisphere monsoon regions is more abundant than when it is at aphelion. The global cooling due to the ice sheets is mainly related to the ice sheet area, little to their height. The regional cooling and warming anomalies caused by the ice sheets get intensified with increasing ice sheet size. The cooling is different whether the NHS oc-curs at aphelion or at perihelion. Precipitation over different monsoon regions responds
15
differently to the size of the ice sheets. Over North Africa, the ice sheets always reduce precipitation, larger the size less the precipitation. Over East China, when NHS is at perihelion, the ice sheets reinforce the summer precipitation whatever their sizes. But when NHS is at aphelion, there is a threshold in the ice volume beyond which the ice sheets start to reduce the precipitation over East China. This underlies the importance
20
of insolation in shaping the ice sheet impact on the precipitation over the East Asian Summer Monsoon (EASM) region.
1 Introduction
The ice sheets are among the largest topographic features on the Earth. They cre-ate regional anomalies in albedo and radiation balance, which have a strong influence
25
amplify-CPD
5, 557–593, 2009Effects of ice sheets and precession on
MIS-13 Climate
Q. Z. Yin et al.
Title Page
Abstract Introduction
Conclusions References
Tables Figures
◭ ◮
◭ ◮
Back Close
Full Screen / Esc
Printer-friendly Version
Interactive Discussion ing and potentially driving global climate change. Direct and indirect influences of ice
sheets on climate cause changes in oceanic and continental surface temperatures, in oceanic and atmospheric circulations, in the hydrological cycle, in vegetation, and in land surface albedo which, in turn, cause additional feedbacks in the climate system. In addition, modeling experiments have shown that the introduction of ice sheets can
5
change atmospheric circulations around the ice sheets and even further away through planetary waves (Manabe and Broccoli, 1985; Kutzbach and Guetter, 1986; Felzer et al., 1996; Yin et al., 2008).
Many authors have reported such an influence of the ice sheets on precipitation and monsoons. According to Ding et al. (1994) and de Menocal (1995), Asian temperature
10
and hydrology and low-latitude monsoonal climate were responding to precessional and obliquity forcings before the onset of the Northern Hemisphere glaciation∼2.5 Ma ago. However after 2.5 Ma BP, changes in Asian and African climates became largely in phase with changes in the ice sheets or lagged behind, indicating that they were driven largely by them. Marine and terrestrial data suggest also that the growth and decay of
15
the ice sheets influenced the aridity of northern and eastern Africa (deMenocal, 1995) and of Asia (Ding et al., 1994), the East Asian winter monsoon (Ding et al., 1994), and the Asian summer monsoon (Clemens et al., 1996).
However, the relationship between monsoon and ice sheet is not necessarily as clear. On one hand, some proxy records from Asia and Africa indicate that the summer
20
precipitation generally weakens during glacial times (e.g. Liu et al., 2003; Van Campo et al., 1982; Sirocko et al., 1991). Similarly, many modeling experiments have shown that the combined effects of ice sheet, CO2and insolation at the Last Glacial Maximum (LGM) are responsible for largely reduced monsoon precipitation compared to today (e.g. Kutzbach et al., 1998; Braconnot et al., 2000; Kitoh et al., 2001; Yanase and
25
CPD
5, 557–593, 2009Effects of ice sheets and precession on
MIS-13 Climate
Q. Z. Yin et al.
Title Page
Abstract Introduction
Conclusions References
Tables Figures
◭ ◮
◭ ◮
Back Close
Full Screen / Esc
Printer-friendly Version
Interactive Discussion ice sheets are too small to create any kind of significant monsoon response (Felzer et
al., 1998).
More interestingly, conflicting with the traditional notion that ice sheets reduce sum-mer monsoon intensity, strengthened sumsum-mer monsoon events have been recorded during some glacials by different proxy data. Mollusk assemblages in the Chinese
5
Loess Plateau documented a strengthened East Asian summer monsoon during the glacials MIS-10 and -12 (Wu et al., 2007) and also during the stadial MIS-6.5, 175 ka ago (Rousseau and Wu, 1999; Rousseau et al., 2008). During the same MIS-6.5, an unusual sapropel event (S6) occurred in the Eastern Mediterranean Sea (M ´eli `eres et al., 1997) which reflected increasing discharge of the Nile River into the Mediterranean
10
Sea, presumably indicating a strengthened African monsoon. This observation was confirmed by modeling experiments showing that the glacial conditions do not neces-sarily prevent high insolation to generate an increased monsoon activity during this MIS-6.5 (Masson et al., 2000). Consequently the question can be raised of whether the ice sheets have any specific influence at all on the monsoons? Based on marine
15
sediment records, Clemens et al. (1991) argued indeed that precession-forced inso-lation changes are the major driver of monsoon strength, whereas glacial boundary conditions have played only a minor role in determining the timing and strength of the Arabian Sea monsoon.
If strengthened summer monsoon events are able to take place during glacial times,
20
it would be less surprising to have them during cooler interglacials. In China, the terrestrial records indicate that the strongest East Asian summer monsoon (EASM) over the whole Quaternary occurred during MIS-13, an interglacial cooler, at least in Antarctica, and apparently more glaciated than the more recent ones (see a review in Yin and Guo, 2008). The marine records also indicate unusually strong African and
25
CPD
5, 557–593, 2009Effects of ice sheets and precession on
MIS-13 Climate
Q. Z. Yin et al.
Title Page
Abstract Introduction
Conclusions References
Tables Figures
◭ ◮
◭ ◮
Back Close
Full Screen / Esc
Printer-friendly Version
Interactive Discussion through a topographically induced wave train.
All these results tend to show that the response of the monsoons to ice sheets de-pends on their size and location, on the different monsoon regions, and on the com-bined effects of insolation and ice sheets. It is therefore interesting to know whether at MIS-13 the impact on the precipitation over East China of the Eurasian ice sheet used
5
in Yin et al. (2008) holds for other ice volumes and situations. This is why a series of numerical experiments using different ice sheets sizes at different locations were done. These sensitivity tests are requested because, first, we are not sure whether theδ18O values of the deep-sea sediments reflect mainly ice volume changes or if temperature change in the deep ocean is also a significant part of theδ18O signal. Moreover, we
10
do not know whether the ice sheets are located in the Northern Hemisphere (NH) or in the Southern Hemisphere (SH) (Guo et al., 2008), or in both and under which propor-tions. Finally, is there a threshold in the ice volume beyond which the ice sheets start to weaken the summer monsoon, and what is the exact role played by the insolation in the relationship between the ice-sheets and the monsoons. In this paper, we focus
15
mainly on the experiments dealing with the sensitivity to the NH ice sheets volumes and with the importance of the orbital configuration, it means NH summer (NHS) at perihelion (P) or at aphelion (A).
2 Experiment design
The climate model of intermediate complexity, LOVECLIM, is used to investigate the
20
response of the climate to the astronomical, greenhouse gas and ice sheet forcings. This model has the advantage of allowing a large number of simulations to be done over thousands of years. However, the reliability of the results must be tested on the basis of simulations with more sophisticated ocean-atmosphere general circulation models (OAGCMs) (such experiments which confirm our results will be discussed in
compan-25
CPD
5, 557–593, 2009Effects of ice sheets and precession on
MIS-13 Climate
Q. Z. Yin et al.
Title Page
Abstract Introduction
Conclusions References
Tables Figures
◭ ◮
◭ ◮
Back Close
Full Screen / Esc
Printer-friendly Version
Interactive Discussion for 506 ka BP when NH summer occurs at perihelion (a forcing for the interglacial
MIS-13.13) and for 495 ka BP when NH winter occurs at aphelion (a forcing for the stadial MIS-13.12). In both cases, the greenhouse gas concentrations are assumed to be the same, with CO2 equal to 240 ppmv. The ice sheet volumes are estimated from theδ18O of the deep-sea sediments taken from different authors (Imbrie et al., 1984;
5
Bassinot et al., 1994; Tiedemann et al., 1994; Shackleton, 2000; Lisiecki and Raymo, 2005) with the assumption that they are a linear proxy for the total ice volume over the Earth. This hypothesis which put an upper limit to the ice volume reconstruction has to be confirmed from an analysis of the precise role that the temperature at the bottom of the sea might play in theseδ18O records. In the mean time, these δ18O records will
10
be used to reconstruct the ice sheets prevailing around 500 000 years ago (MIS-13), assuming that the relationship between theδ18O excess and the ice volume excess at the LGM remains valid for such a time. The values for the LGM are selected because it is a period for which the ice sheets are best reconstructed. Therefore:
∆ice volume (at timet)=∆ice volume (at LGM)×∆δ18O (at timet)/∆ δ18O (at LGM) (1)
15
where∆refers to the deviation from present-day.
According to the different authors (Imbrie et al., 1984; Bassinot et al., 1994; Tiede-mann et al., 1994; Shackleton, 2000; Lisiecki and Raymo, 2005), ∆δ18O varied be-tween 0.24‰ (Lisiecki and Raymo, 2005) and 1.239‰ (Imbrie et al., 1984) over the whole MIS-13.1 (which includes MIS-13.11 around 482 ka BP and MIS-13.13 around
20
501 ka BP). At the same time, the ratiob:
b= ∆δ18O (at timet)/∆ δ18O (at LGM) (2)
varies from 0.134 (Lisiecki and Raymo, 2005) to 0.318 (Imbrie et al., 1984). The ice volume excess at the LGM is assumed to be 47.2 106km3(Peltier, 1994) but it actually varies around 47 106km3plus or minus a few million km3depending on the
reconstruc-25
CPD
5, 557–593, 2009Effects of ice sheets and precession on
MIS-13 Climate
Q. Z. Yin et al.
Title Page
Abstract Introduction
Conclusions References
Tables Figures
◭ ◮
◭ ◮
Back Close
Full Screen / Esc
Printer-friendly Version
Interactive Discussion means within a factor 2.5. Moreover, the impact on the precipitation over East China of
the uncertainty related to the ice volume excess at the LGM can be illustrated by using the lowest reconstructed ice volume for the Eurasian ice sheet (either by Lambeck et al., 2000 or by Peltier, 2004), the other ice sheets being kept to their Peltier (1994) values. Such an assumption leads to a LGM total ice volume excess of 40 106km3.
5
Combined with the smallest value ofb, this leads to an absolute minimum of the total ice volume excess of 5.3 106km3over the whole MIS-13.1.
About the volume of the individual ice sheets, the ratio between the volumes of North American ice sheet (NA) and of Eurasian ice sheet (EA) is assumed to be constant in time and equal to about 2 (the LGM ice volume for EA being 11.9 106km3and for NA
10
being 24.2 106km3 in Peltier, 1994). The Greenland and Antarctica ice sheets were kept the same as for the present-day in all the simulations (the present-day ice volume is about 2.9 106km3for Greenland ice sheet and 24.7 106km3for Antarctica ice sheet – IPCC, 2007).
The shape of the ice sheets was assumed to be axi-symmetric. For a given maximum
15
thickness,h, and a diameter of the circular basis at the ground,l, the volume of such ice sheet is given by :
V =2πhl2/15 (3)
The thickness of the ice sheet at each grid point can be then calculated assuming that we know the relationship between h and l and the location of the ice sheet center.
20
According to Paterson’s model (1994), h2=aL(L=l/2). Using a 2-parabolic ice sheet leads to:
a=0.3562V2L−5 (4)
and its numerical value, assumed to be a constant, is obtained using the NA ice sheet at the LGM (its volumeV and sizeLare best known and taken here to be 24.2 106km3
25
CPD
5, 557–593, 2009Effects of ice sheets and precession on
MIS-13 Climate
Q. Z. Yin et al.
Title Page
Abstract Introduction
Conclusions References
Tables Figures
◭ ◮
◭ ◮
Back Close
Full Screen / Esc
Printer-friendly Version
Interactive Discussion Finally, the centers of the small ice sheets (Exp. 2, 3, 4 and 7, Table 1) are supposed
to be 90◦W and 69◦N, and 50◦E and 63◦N for Eurasian ice sheet (EA). These locations do not correspond to the LGM ones. They are tentatively related to the position that these ice sheets had during their development leading to the LGM. For the large ice sheets scenario (Exp. 5 and 8), the center of NA is located at its LGM position (84◦W,
5
58◦N), but the EA center is kept the same as in the small volume cases.
To test the influence of the different sizes of the ice sheets on the climate under different astronomical configurations, the astronomical forcing at 506 and 495 ka BP has been selected (Berger, 1978), these dates belonging both to MIS-13.1. Two groups of experiments have been done (Table 1). One is under the astronomical forcing at
10
506 ka BP (NHS is at P) with ice volumes of 1.96, 2.79, 3.63 and 11.9 106km3 for EA, and of 3.48, 5.67, 7.38 and 24.2 106km3 for NA. The first three pairs of values are reconstructed from theδ18O records of respectively Bassinot et al. (1994), Lisiecki and Raymo (2005) and SPECMAP (Imbrie et al., 1984). The largest volumes are from the LGM given by Peltier (1994). The other group is under the astronomical forcing at
15
495 ka BP (NHS is at A), with ice volumes of 3.63 and 11.9 106km3for EA and of 7.38 and 24.2 106km3for NA. Experiments with no EA nor NA (Exp. 1 and 6) are used as references.
3 Climate response to the astronomical forcing
The daily mean insolation integrated over the whole Earth is larger from the spring
20
equinox to the fall equinox (Fig. 1) when NHS occurs at perihelion compared to a sim-ulation when it occurs at aphelion. The maximum anomaly amounts to about 70 Wm−2 and is centered 30◦N at the summer solstice. The reverse is true between the fall equinox and the spring equinox with a maximum negative anomaly of 90 Wm−2 cen-tered at the South Pole.
25
CPD
5, 557–593, 2009Effects of ice sheets and precession on
MIS-13 Climate
Q. Z. Yin et al.
Title Page
Abstract Introduction
Conclusions References
Tables Figures
◭ ◮
◭ ◮
Back Close
Full Screen / Esc
Printer-friendly Version
Interactive Discussion at 495 ka BP and Pre-Industrial time. Globally, at 506 ka BP, the Earth is warmer
than at 495 ka BP (15.9◦C against 15.5◦C) but cooler than during Pre-Industrial time (16.1◦C). The di
fference between 506 and 495 ka BP is only due to the insolation forc-ing, whereas the difference between these cases and Pre-Industrial is due to both the insolation and reduced CO2concentration. The Earth warms more during NH summer
5
at 506 ka BP (July: +0.8◦C above PrI) than during SH summer (January:
−0.1◦C) at 495 ka BP. Similarly, the Earth cools more (January:−1.1◦C) during NH winter at 506 ka BP than during SH winter at 495 ka BP (July:−0.8◦C). It was not necessarily expected that the annual mean temperature at 506 ka BP would have been 0.4◦C higher than at 495 ka BP. It means that the Earth would have been warmer when NHS occurs at P
10
than when the SHS (NHW) occurs at P. All experiments with opposite precessional con-ditions for the last 6 interglacials confirm such a result, implying that the NH response affects more effectively the globally averaged temperature. The Pre-Industrial situation is a good illustration: when NHS occurs at aphelion, the Earth is globally 4.3◦C warmer during July than during January (a time when SHS occurs at perihelion), although the
15
Earth is in July 3.4% further away from the Sun (it means receiving globally 6.8% less energy from the Sun). Even more spectacular, in both data and model results, is that the NH during its local summer is warmer than the SH during its local summer by∼5 to 6◦C, and the NH during its winter is cooler than the SH during its winter by
∼2 to 3◦C, leading to a seasonal contrast twice as large in NH (∼13◦C) than in SH (∼6◦C). This
20
results shows that the NH, in addition to its larger continental areas, is also the seat of more positive feedbacks than the SH. In the SH indeed, Antarctica is a large cold pole, the oceans damp the climatic signals through their heat capacity, and the solar energy is in large part used for increasing the latent heat through evaporation, latent heat which is finally transported and released in the NH through the summer monsoon.
25
On the contrary, the large NH continents with their land cover (vegetation and snow) make NH more sensitive to changes.
temper-CPD
5, 557–593, 2009Effects of ice sheets and precession on
MIS-13 Climate
Q. Z. Yin et al.
Title Page
Abstract Introduction
Conclusions References
Tables Figures
◭ ◮
◭ ◮
Back Close
Full Screen / Esc
Printer-friendly Version
Interactive Discussion ature. This shows maxima reaching 15◦C north of Northern America (at
∼65◦N) and over the Tibetan Plateau, 10◦C over northeastern Asia, 5 to 7◦C along the west coast of North America, over North Africa and the Near East, 4 to 5◦C over most of South America, Australia, central to south Africa, and over the Antarctic ocean. This repre-sents a considerable cooling of the whole Earth in July, when going from the peak of
5
MIS 13 (MIS-13.13) to the stadial MIS-13.12, 11 ka later.
For January, going from 506 to 495 ka BP, the warming over the continents reaches 4◦C in the SH over Australia and South America (the reverse of what happens in July), but barely 2◦C over Eurasia and about 0◦C in North America (Exp. 6
−Exp. 1, the op-posite of Fig. 2b). This increasing seasonal contrast in the SH, as opposed to what
10
happens in the NH, results also directly from the orbital configuration: July (i.e. NHS and SHW) switches from perihelion (at 506 ka BP) to aphelion (at 495 ka BP), at the same time that January switches from aphelion to perihelion. But more surprising is the January cooling all over the Arctic Ocean, with two deep centers located around the Bering Strait and between Greenland and North Scandinavia at 495 ka BP when
15
compared to 506 ka BP. Over the northern North Atlantic, a cooling of more than 8◦C occurs and the large sea-ice cover is responsible for the deep-water formation to move south. This is actually due to the cold NH summer of 495 ka BP which makes ice to persist all through the summer season over the Arctic Ocean allowing it to be present during the next warm winter.
20
CPD
5, 557–593, 2009Effects of ice sheets and precession on
MIS-13 Climate
Q. Z. Yin et al.
Title Page
Abstract Introduction
Conclusions References
Tables Figures
◭ ◮
◭ ◮
Back Close
Full Screen / Esc
Printer-friendly Version
Interactive Discussion
4 July surface temperature response to the ice sheets
4.1 July Surface temperature at 506 ka BP
4.1.1 General cooling pattern due to the ice sheets
When compared to the no EA and no NA experiment (Exp. 1), the small ice sheets (Exp. 4) cool the Earth by 0.4◦C annually, by 0.6◦C in January and by 0.2◦C in July. The
5
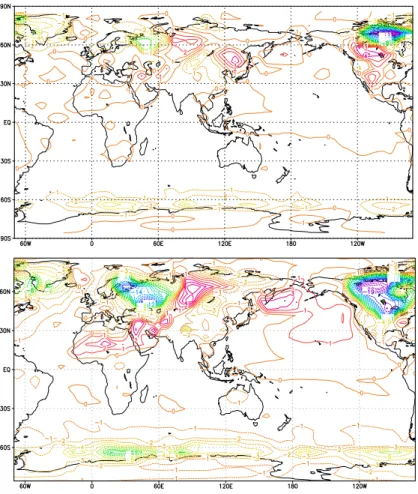
largest impact is over the ice sheets with a cooling of up to 7◦C over the EA ice sheet and 21◦C over the NA ice sheet (Fig. 3a). In addition, there are three regions in the NH which get cooler under the influence of these ice sheets. This cooling amounts to 1–4◦C over Greenland and to 1–2◦C over both the Taymyr Peninsula (at about 75◦N, 100◦E) and the Altai-western Mongolia mountain regions from where it extends up to
10
East China. In the SH, the winter surface of the Antarctic Ocean cools by 1–3◦C. Some regions show summer warming when ice sheets are introduced. This is the case from West Africa to the East of the EA ice sheet , in particular over a region of 20◦in latitude and 20◦in longitude centered at (60◦N, 80◦E), i.e. over the Western Siberian Lowlands. This warming continues to the north of the Pacific Ocean through northeastern Asia
15
where the temperature increases by up to 1–4◦C. A similar warming occurs also over a large region south of the NA ice sheet (discussed later in Sect. 3.1.4).
When the LGM ice sheets are introduced (Exp. 5, Fig. 3b) the pattern of temperature change is similar to that resulting from the small ones (Exp. 4, Fig. 3a), but the ampli-tude is larger. These large ice sheets cool the Earth by 1.1◦C annually, 1.3◦C in January
20
and 1◦C in July. The temperature decreases by up to 18◦C over the EA ice sheet and by up to 21◦C over the NA ice sheet. As compared to the small-ice-sheet case, the temperature over EA decreases considerably (its altitude increases by 700 m). It is not the case over the NA ice sheet although its altitude increases by the same amount, but its center at the LGM is located south of its small-ice-sheet position preventing a
fur-25
Sur-CPD
5, 557–593, 2009Effects of ice sheets and precession on
MIS-13 Climate
Q. Z. Yin et al.
Title Page
Abstract Introduction
Conclusions References
Tables Figures
◭ ◮
◭ ◮
Back Close
Full Screen / Esc
Printer-friendly Version
Interactive Discussion face temperature over the Tibetan Plateau decreases more in the large-ice-sheet case
than in the small-ice-sheet one (it was almost not influenced by the small ice sheets). On the contrary, the belt from Africa to west Siberia low land becomes much warmer. The warming of 3◦C previously centered over northeastern Asia in the small-ice sheet-case is now shifted to the Northwest of the Pacific Ocean. Even more significant is the
5
considerable reduction of the warm area south of the NA ice sheet.
4.1.2 Causes of the general cooling pattern
Our sensitivity experiments for albedo alone and topography alone show that the cool-ing over the whole Earth is mainly attributed to the ice sheet albedo. This is consistent with the result of Felzer et al. (1996) who showed that the high albedo of the ice sheets
10
is sufficient to lower the global mean temperature, and the ice-sheet height has little effect in this case. Over the cooling regions in the high latitudes and over the Tibetan Plateau, snowfall and albedo largely increase when the ice sheets are introduced. The sea-ice fraction increases. The snow depth over land increases significantly over the NA and EA ice sheets, the Taymyr peninsula and the southern Greenland. Consistently
15
with temperature change, the increase in snowfall, snow depth, sea ice and albedo over the cooling regions is larger in the large-ice-sheet case than in the small one. Over the high latitudes, the cooling is therefore due to the changes in the snow field and in the sea ice caused by the introduction of ice sheets. However, the mid-latitude cooling over the Altai, the Baikal and western Mongolia must be due to other mechanisms
be-20
cause the snow field and albedo do not significantly change in July over these regions due to their lower latitudes. In this case, the cooling is simply due to the ascent of air generated over these elevated regions by the introduction of the ice sheets.
4.1.3 Cooling over the ice sheets
The different cooling over the EA and NA ice sheets needs also to be investigated.
25
CPD
5, 557–593, 2009Effects of ice sheets and precession on
MIS-13 Climate
Q. Z. Yin et al.
Title Page
Abstract Introduction
Conclusions References
Tables Figures
◭ ◮
◭ ◮
Back Close
Full Screen / Esc
Printer-friendly Version
Interactive Discussion direct cause for temperature anomalies over the ice sheets arises from changes
re-lated to their size and location. The Stein-Alpert factor separation method (Stein and Alpert, 1993) shows that roughly half of the cooling over the EA ice sheet is due to the albedo effect, the other half to topography. Assuming this holds for the NA ice sheet as well would explain part of the difference between the cooling over the EA and NA
5
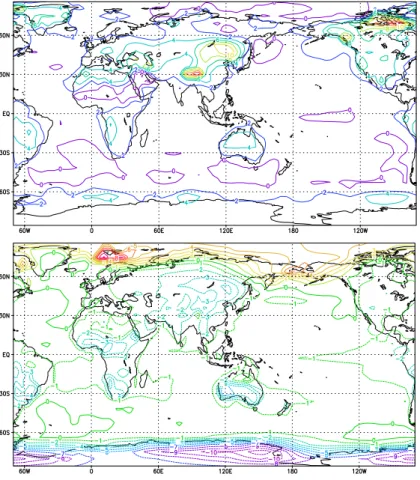
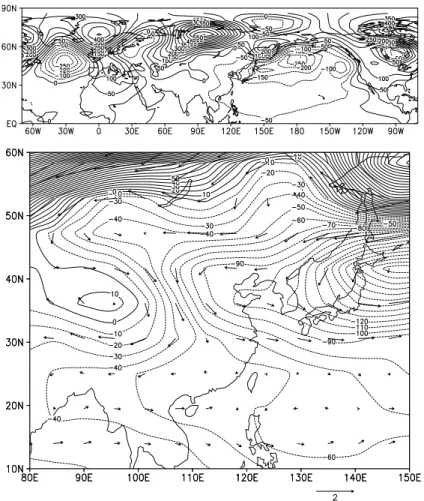
ice sheets. The area of the NA ice sheet being almost 80% larger than the area of the EA ice sheet and its summit 300 m higher would indeed lead to an additional cooling of about 7◦C over its surface. This is less than the simulated 21◦C cooling and general circulation changes might also be involved. In July, the Asian jet develops in the upper troposphere (Fig. 4a). The jet core with zonal winds exceeding 20 m s−1 exits in the
10
mid-latitudes (50◦ to 60◦N) of the Eurasian and North American continents. The Asian jet is strong enough to be a waveguide (Enomoto et al., 2003). The meridian wind distribution (Fig. 4b) implies the existence of stationary waves on the jet, southerlies and northerlies alternating every 2500 km in global average. Over the Eurasian conti-nent, the stationary wave train appears to be initiated near the jet entrance (at about
15
20◦E) and to propagate along the jet. With the small ice sheet of Exp. 4 for example, the jet moves south by a few degrees (Fig. 4c), but intensifies mainly over Europe and slightly over North America, whereas it weakens over the central Siberian Plateau. At the same time, the northerlies over the western and central parts of the NA ice sheet intensify and so does the southerly component of the wind over the whole EA ice sheet
20
(Fig. 4d). This supports the hypothesis that the limited cooling of EA and the strong one over NA is also the result of changes in horizontal advection. This is in line with the omega field at 650 hPa which becomes significantly more negative over the EA ice sheet (convergence) and more positive over the NA (subsidence, divergence).
4.2 Warming due to the ice sheets
25
CPD
5, 557–593, 2009Effects of ice sheets and precession on
MIS-13 Climate
Q. Z. Yin et al.
Title Page
Abstract Introduction
Conclusions References
Tables Figures
◭ ◮
◭ ◮
Back Close
Full Screen / Esc
Printer-friendly Version
Interactive Discussion Guetter, 1986; Rind, 1987), or south of both the NA and EA ice sheets (Manabe and
Broccoli, 1985; Felzer et al., 1996). The mechanisms responsible for the downstream warming are generally attributed to lower (than modern) glacial land albedo south of the NA ice sheet and lower elevations south of the EA ice sheet (Manabe and Broccoli, 1985), and to subsidence of air flowing offof the ice sheets (Rind, 1987). In our
simu-5
lations, the warming east and southeast of EA might result from the subsidence of air flowing offof the ice sheet, because the surface wind over the upstream of the EA ice sheet is westerly and northwesterly, and the air flowing offof the ice sheet will subside as it flows downhill, resulting in winds that warm adiabatically immediately leeward of the ice sheet. However, this does not held to explain the warming over North Africa,
10
the Middle East and northeastern Asia, because these regions are far from the EA ice sheet but correspond to low elevation. The introduction of ice sheets perturbs the atmosphere in a way that advection and air subsidence reduce precipitation, decrease the latent heat, increase the sensible heat and therefore warm the surface. The warm-ing over Africa and Eurasia due to the large ice sheets (Fig. 3b) is greater than due
15
to the small ones, indicating that the warming is also related to the change in the ice sheet height, confirming the result of Felzer et al. (1996).
4.3 July surface temperature at 495 ka BP
Annually at 495 ka BP, the Earth with small ice sheets (Exp. 7) is 0.1◦C cooler than without ice sheets. January cools by 0.6◦C and July by 0.5◦C. The largest impact of
20
the ice sheets on the surface temperature is still over the regions of the ice sheets themselves (Fig. 5a). In July, the cooling due to small ice sheets is up to 12◦C over the EA and 16◦C over the NA ice sheets. This cooling is of the same order of magnitude as the cooling due to the altitude of the ice sheets above the ground (respectively 2.2 and 2.6 km for EA and NA). The cooling over the other regions are the same as in the
25
CPD
5, 557–593, 2009Effects of ice sheets and precession on
MIS-13 Climate
Q. Z. Yin et al.
Title Page
Abstract Introduction
Conclusions References
Tables Figures
◭ ◮
◭ ◮
Back Close
Full Screen / Esc
Printer-friendly Version
Interactive Discussion Taymyr Peninsula is under the influence of westerly to north-westerly winds in January
(not shown here), but in July south-easterly winds prevail with a strong heat advection from the interior of the Asian continent (a seasonal change associated to the East Asian Monsoon). This explains the summer partial melting of the winter snow field, the winter albedo (0.8) being reduced in July to 0.4 at 495 ka BP. When the ice sheets
5
are introduced, the albedo in January remains the same (0.8) as in the no-ice-sheet experiment, but in July it stays quite high (0.7), 0.4 more than in the no-ice-sheet case. This is because the winter snow and ice field persists through summer more in the ice sheet experiment than in the no-ice-sheet one. This in turn is related to the change in the wind pattern over this region with a much weaker meridional component of the
10
wind when the ice sheets are introduced, the strong south-easterly wind at 506 ka BP with small ice sheets having been replaced by a more zonal easterly wind at 495 ka BP. Consistently, the snowfall, snow depth, sea ice and albedo increase over the cooling area more than in the 506 small ice sheet case. Compared to the 506 small-ice-sheet situation (Fig. 3a), the warming area in 495 is enlarged over the North Atlantic, the
15
Tibetan Plateau, eastern Siberia, but largely shrinks over the region south of the NA ice sheet (Fig. 5a).
The large ice sheets at 495 cool the Earth by 1.1◦C annually, 1.1◦C in January and 1.3◦C in July, it means globally half to one degree more than in the small-ice-sheet case. The warming area in all the other experiments discussed above, largely shrinks
20
and most of the Eurasian continent becomes cooler (Fig. 5b). This July cooling over the Eurasian continent due to the EA and NA ice sheets at 495 ka BP (0.3◦C for the small ice sheets and 2.4◦C for the large ones) is larger than the cooling due to the same ice sheets at 506 ka BP (respectively 0.1 and 1.8◦C). This is related to the climate already 4◦C cooler at 495 ka BP than at 506 there which is due to the insolation forcing alone.
25
CPD
5, 557–593, 2009Effects of ice sheets and precession on
MIS-13 Climate
Q. Z. Yin et al.
Title Page
Abstract Introduction
Conclusions References
Tables Figures
◭ ◮
◭ ◮
Back Close
Full Screen / Esc
Printer-friendly Version
Interactive Discussion
5 July precipitation
All the precipitation features discussed in this section are significant at the 95% con-fidence level and over (a measure based on t-test assuming that precipitation is both space and time uncorrelated).
5.1 NHS at perihelion (506 ka BP)
5
When the ice sheets are introduced, the Earth globally gets cooler and drier. The main pattern of precipitation changes are the same in all the three experiments (Exp. 2, 3 and 4), but there are regional differences. Upslope of the EA ice sheet, a drier zone results from anticyclongenesis due to the decrease of vorticity, and downslope of it a wetter zone appears related to cyclogenesis due to the increase of vorticity (Fig. 6a). Around
10
the NA ice sheet, there are also wetter and drier zones, but their pattern is slightly more complicated due to the presence of the Greenland ice sheet immediately east of it. Over central North America, the precipitation is largely reduced. In the high latitudes, there is a succession of centers of positive and negative precipitation anomaly. These are a consequence of the EA and NA ice sheets and are thermodynamically induced
15
by the modification of the albedo, sea ice and snow. In the mid and low latitudes, the most significant features are (1) a drier belt extending from the tropical western Atlantic to the east over North Africa and most of the Middle East, (2) a wetter belt over Inner Asia extending from the south-west to the north-east, (3) a wetter belt over East China oriented south-west to north-east and disappearing over the Pacific, (4) a wetter belt
20
extending from the south of the Bay of Bengal, through the Indonesian islands and to the east over the whole equatorial Pacific, and (5) a wetter zone from west of Mexico to the western Atlantic.
All the regions with precipitation increase (decrease) correspond to air ascent (de-scent). Away of the ice sheets, most of the wetter (drier) regions correspond to a
25
surface temperature decrease (increase) (Fig. 3a).
CPD
5, 557–593, 2009Effects of ice sheets and precession on
MIS-13 Climate
Q. Z. Yin et al.
Title Page
Abstract Introduction
Conclusions References
Tables Figures
◭ ◮
◭ ◮
Back Close
Full Screen / Esc
Printer-friendly Version
Interactive Discussion by 20% relative to the no-ice-sheet case which is significant at more than 99.9%
confi-dence level. This increase is related to a wave train propagating southeastwards start-ing from the EA ice sheet with alternatstart-ing precipitation increase and decrease, and ending up over East China with a reinforcement of precipitation. This wave train is also present in the omega field with alternating ascent and subsidence, ending over East
5
China with a large scale of ascent (not shown here). Our sensitivity experiments using either albedo as the only forcing or topography alone show that this wave train is mainly generated by the EA ice-sheet topography. The phase lock of the wave train over East China is related to the summer low there and to the Tibetan Plateau (Yin et al., 2008). Although the pattern of precipitation change is similar for the three experiments with
10
small NA and EA ice sheets, when the ice volume increases from 5.5 (Exp. 2) to 8.5 (Exp. 3) and finally to 11 106km3 (Exp. 4), precipitation over East China increases by 14, 16 and 20% respectively when compared to the no-ice-sheet experiment 1. At the same time when the NHS is at P, such an increase of the ice volume of the EA and NA ice sheets reduce progressively the July precipitation over North Africa.
15
Are these features holding if the ice sheets reach their maximum size (Exp. 5) like at the LGM? Figure 6b shows the impact on July precipitation of the NA and EA ice sheets when their LGM sizes are introduced with a volume of respectively 24.2 and 11.9 106km3. The pattern of precipitation change is generally consistent with that due to the small ice sheets, but globally the amplitude is much larger. Clearly, there
20
is still a wave train starting from the EA ice sheet and ending up over East China with the reinforcement of precipitation. Here the precipitation increase is less than in Exp. 4 , amounting only about 14% but is of the same order of magnitude as in the smallest ice sheets experiment (Exp. 2). The wave train effect is compensated by the cooling effect of the ice sheets which are sufficiently large to cool the Earth worldwide
25
CPD
5, 557–593, 2009Effects of ice sheets and precession on
MIS-13 Climate
Q. Z. Yin et al.
Title Page
Abstract Introduction
Conclusions References
Tables Figures
◭ ◮
◭ ◮
Back Close
Full Screen / Esc
Printer-friendly Version
Interactive Discussion over the Eurasian continent and over the whole northern Pacific). July precipitation is
largely reduced over North Africa by 24% and this drier belt extends eastwards through the Indian subcontinent, over the South China Sea and around the whole NH tropics. South of it, there is a wetter belt over SH tropics up to 10◦S. The southward shift of the tropical rainfall maximum indicates a southward migration of the ITCZ under the
5
influence of the LGM ice sheets. These results are consistent with those where the ITCZ shifts southwards due to the ice-sheet induced NH dramatic cooling (Chiand et al., 2003, 2005; Broccoli et al., 2006; Braconnot et al., 2007) and with the hypothesis that the ITCZ should move towards the relatively warmer hemisphere in response to a differential cooling (Brocolli et al., 2006).
10
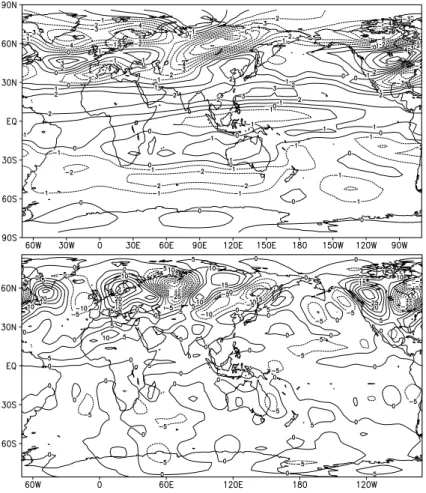
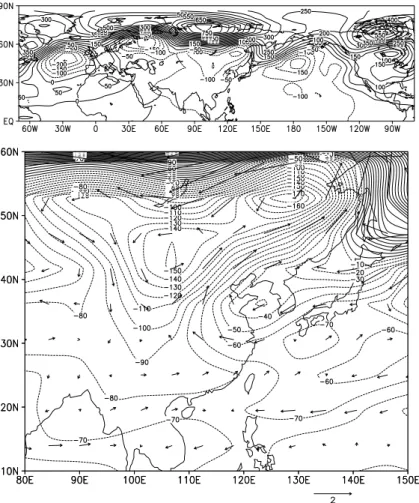
In July, under the insolation and GHG forcings only, the Asian jet develops in the up-per troposphere at about 50 to 60◦N. The jet core with zonal winds exceeding 20 m s−1 exists on the North of the Eurasian continent (Fig. 4a). When the EA and NA ice sheets are introduced, the mean position of the 200-hPa zonal wind is also shifted southwards (Fig. 7a). There is a subsidence anomaly over the NH tropics and a slight ascent over
15
the SH tropical region (Fig. 7b). This is similar to what Chiang and Bitz (2005) found with a shift meridionally away from the hemisphere with an imposed added ice sheet, altering the global Hadley cell circulation with an increase tropical subsidence in the hemisphere with imposed ice and uplift in the other. These migrations of the ITCZ and the jet stream are more pronounced in the large-ice-sheet situation than in the small
20
one.
In summary, ice sheets always reinforce July precipitation over East China when NHS occurs at perihelion, whatever their sizes. The mechanism involves a topograph-ically induced wave train. However, they always reduce precipitation over North Africa through shifting the ITCZ southwards. The precipitation response to ice sheets is much
25
CPD
5, 557–593, 2009Effects of ice sheets and precession on
MIS-13 Climate
Q. Z. Yin et al.
Title Page
Abstract Introduction
Conclusions References
Tables Figures
◭ ◮
◭ ◮
Back Close
Full Screen / Esc
Printer-friendly Version
Interactive Discussion 5.2 NHS at aphelion (495 ka BP)
Figure 8a shows July precipitation change under the influence of small NA and EA ice sheets at 495 ka BP. The pattern of the precipitation change is similar to the 506 ka BP small-ice-sheet case when NHS is at perihelion. The EA ice sheet generates again a wave train which reinforces the precipitation over East China. The percentage increase
5
is the same (20%) but the total amount is only half of the 506 ka BP case because at 495 ka BP NHS at aphelion is less favorable to precipitation over China. The intro-duction of the small ice sheets causes a drier belt extending from North Africa through northern India to the South China Sea, and a slightly wetter condition over South India. When the NA and EA ice sheets reach their LGM volume, July precipitation reduces
10
over a large part of the Earth (Fig. 8b). In high latitudes, the pattern of precipitation change at 495 ka BP is similar to the LGM ice sheet case at 506 ka BP, with large scale alternating precipitation increase and decrease. There are two main differences between 506 and 495 ka BP. First, the ITCZ southwards migration due to the ice sheets is more pronounced when NHS is at perihelion (506) than at aphelion (495). This might
15
be due to the fact that the mean position of ITCZ is more north in the 506 no-ice-sheet experiment than in the 495 one. This is associated to a NH which is 2.2◦C warmer at 506 than at 495 ka BP whereas the SH is only 1.1◦C warmer. This larger warming in the NH is induced by an insolation at 506 larger than at 495 ka BP by 70 Wm−2against 30 Wm−2in the SH. The more northern position of the ITCZ at 506 ka BP makes it more
20
sensitive to the ice sheets forcing, leading to a more pronounced displacement than at 495 ka BP. Second, the wave train which propagates southeastwards from the EA ice sheet across the Asian continent and the North Pacific when NHS is at perihelion (506 ka BP), disappears when the NHS occurs at aphelion (495 ka BP). Precipitation is reduced significantly over all the monsoon regions (Exp. 8), with 13% less over north
25
CPD
5, 557–593, 2009Effects of ice sheets and precession on
MIS-13 Climate
Q. Z. Yin et al.
Title Page
Abstract Introduction
Conclusions References
Tables Figures
◭ ◮
◭ ◮
Back Close
Full Screen / Esc
Printer-friendly Version
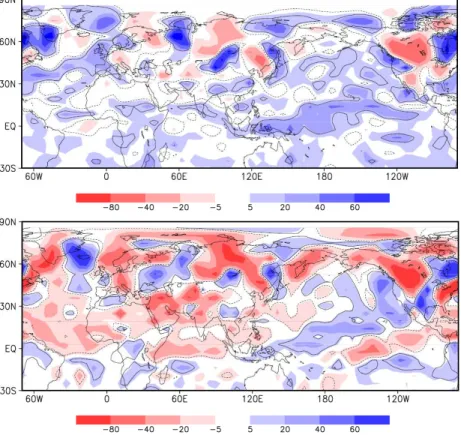
Interactive Discussion responsible for a larger anticyclonic anomaly at 800 hPa over most of the Eurasian
continent (Fig. 9a). Centered over central Siberia, this weakens the thermal low over East Asia. At the same time, the northwestern Pacific High also weakens creating northwesterly wind anomaly over East Asia (Fig. 9b), which definitively weakens the EASM and reduces the precipitation. This situation is markedly different from what
5
happens when NHS is at perihelion (506 ka BP). Then, the LGM ice sheets causes an anticyclonic anomaly only north of about 60◦N (Fig. 10a), but south of 60◦N the thermal low deepens over most of the Eurasian continent. Although the northwestern Pacific High weakens slightly, the land/sea pressure gradient increases. Consistently, there is a southeasterly wind anomaly blowing from the sea to the land over East China
10
which reinforces the EASM (Fig. 10b). The different EASM responses to the same ice sheets under two opposite precessional situations indicates that insolation plays an very important role in shaping the ice sheets impact.
When the NH summer occurs at perihelion, the cooling due to the large ice sheet is partly compensated by the warmer NH due to the larger insolation and therefore is
15
not sufficient to reduce the convection over the continent. Moreover, the topography effect generates a wave train which reinforces the convection and precipitation over East China. When NHS is at aphelion, the cooling effect due to the large ice sheet is sufficient to reduce the (weaker) convection over the continent. When ice sheets are small, the topography effect remains more important than the cooling effect and
there-20
fore generates a wave train which reinforces the precipitation over East China. When ice sheets are large, the cooling effect is stronger than topography effect, preventing the formation of the wave train and reducing the precipitation over East China.
Although almost all the coldest peaks of the glacials correspond to NHS at aphelion (low NH summer insolation) (Imbrie et al., 1984; Bassinot et al., 1994; Tiedemann et
25
CPD
5, 557–593, 2009Effects of ice sheets and precession on
MIS-13 Climate
Q. Z. Yin et al.
Title Page
Abstract Introduction
Conclusions References
Tables Figures
◭ ◮
◭ ◮
Back Close
Full Screen / Esc
Printer-friendly Version
Interactive Discussion it is expected to have strengthened EASM during these specific periods due to not
only the high NH summer insolation but also to the ice sheets themselves. The same conclusion holds for the cooler or more glaciated interglacials such as MIS7, 13, -15 and -17. Moreover, at some glacial peaks corresponding to NHS at aphelion, the precipitation over East China might be reinforced by the ice sheets if their ice volumes
5
are below the threshold. It is significant indeed that a strengthened EASM has been found in the proxy records of China during the glacials MIS-6.5 (Rousseau and Wu, 1999), MIS-10 and 12 (Wu et al., 2007; Rousseau et al., 2008), during the interstadial MIS-3 (Feng et al., 2007), and during the cooler interglacials MIS-13 and 15 (Guo et al., 1998, 2000; Yin and Guo, 2006).
10
6 Conclusions
The Earth system model of intermediate complexity, LOVECLIM, was used to investi-gate the climate response to respectively insolation, the Eurasian and North American ice sheets and their combined effects. Two precessional opposite situations have been used, one at 506 ka BP when northern hemisphere summer (NHS) occurs at perihelion,
15
and the other at 495 ka BP when NHS occurs at aphelion. Experiments with different sizes of the Eurasian and North American ice sheets under these two astronomical conditions lead to the following conclusions:
1. The Earth is warmer when NHS occurs at perihelion rather than at aphelion, indi-cating that the NH plays a leading role in the Earth climate. The seasonal contrast
20
in the NH (SH) is larger when NHS occurs at perihelion (aphelion). The monsoon precipitation is much more abundant in NH summer at 506 ka BP due to its larger insolation than at 495 ka BP.
2. When the Eurasian and North American ice sheets are introduced, the cooling they induce over the whole Earth is mainly attributed to their albedo, and little
25
CPD
5, 557–593, 2009Effects of ice sheets and precession on
MIS-13 Climate
Q. Z. Yin et al.
Title Page
Abstract Introduction
Conclusions References
Tables Figures
◭ ◮
◭ ◮
Back Close
Full Screen / Esc
Printer-friendly Version
Interactive Discussion cooling is mainly due to the increase of snow and sea ice. In mid-latitudes, it is due
to the ascent of air topographically induced by the ice sheets. These ice sheets are not only at the origin of cooling anomalies but also of warming anomalies. Such warming is due to the subsidence of air resulting from either air flowing off the ice sheets, or remote atmospheric perturbations caused by the ice sheets.
5
The amplitude of both types of anomalies gets larger when the size of the ice sheets increases.
3. Over the NH continents, the 495 ka BP cooler climate due to the lower summer insolation amplifies the cooling effect of the ice sheets. At 506 ka BP, the reverse is true, the cooling induced by the ice sheets being partly damped by the warmer
10
climate issued from the larger summer insolation.
4. For the precipitation, the ice sheets make the Earth globally drier, but redistribute wet and dry anomalies regionally. Precipitation over the different monsoon re-gions responds differently to the size of the ice sheets. Over North Africa, pre-cipitation decreases with increasing ice sheet size due to the southward shift of
15
the ITCZ, whatever the astronomical configuration is. Over East China, when the NHS occurs at perihelion, the ice sheets reinforce the summer precipitation due to a wave train topographically induced by the Eurasian ice sheet whatever their sizes are. But when NHS is at aphelion, there is a threshold in the ice volume beyond which the ice sheets start to reduce the EASM. This stresses the very
20
important role played by insolation in shaping the ice sheet impact on the EASM through amplifying or damping the cooling due to the ice sheets. This might partly explain the intensification of the EASM during some glacials or “cool” interglacials documented in the proxy records, a hypothesis which deserves more attention.
Acknowledgements. This work is supported by the European Research Council Advanced
25
CPD
5, 557–593, 2009Effects of ice sheets and precession on
MIS-13 Climate
Q. Z. Yin et al.
Title Page
Abstract Introduction
Conclusions References
Tables Figures
◭ ◮
◭ ◮
Back Close
Full Screen / Esc
Printer-friendly Version
Interactive Discussion
References
Bassinot, F. C., Labeyrie, L. D., Vincent, E., Quidelleur, X., Shackleton, N. J., and Lancelot, Y.: The astronomical theory of climate and the age of the Brunhes-Matuyama magnetic reversal, Earth Planet. Sci. Lett., 126, 91–108, 1994.
Berger, A.: Long-term variations of daily insolation and Quaternary Climatic Changes, J. Atmos.
5
Sci., 35(12), 2362–2367, 1978.
Braconnot, P., Joussaume, S., de Noblet, N., and Ramstein, G.: Mid-Holocene and Last Glacial Maximum African monsoon changes as simulated within the Paleoclimate Modelling Inter-comparison Project, Glob. Plan. Change, 26, 51–66, 2000.
Braconnot, P., Otto-Bliesner, B., Harrison, S., Joussaume, S., Peterchmitt, J.-Y., Abe-Ouchi, A.,
10
Crucifix, M., Driesschaert, E., Fichefet, T., Hewitt, C. D., Kageyama, M., Kitoh, A., Laˆın ¨e, A., Loutre, M.-F., Marti, O., Merkel, U., Ramstein, G., Valdes, P., Weber, S. L., Yu, Y., and Zhao, Y.: Results of PMIP2 coupled simulations of the Mid-Holocene and Last Glacial Maximum Part 1: experiments and large-scale features, Clim. Past, 3, 261–277, 2007,
http://www.clim-past.net/3/261/2007/.
15
Broccoli, A. J., Dahl, K. A., and Stouffer, R. J.: Response of the ITCZ to Northern Hemisphere Cooling, Geophys. Res. Lett., 33, L01702, doi:10.1029/2005GL024546, 2006.
Chiang, J. C. H., and Bitz, C. M.: Influence of high latitude ice cover on the marine Intertropical Convergence Zone, Clim. Dynam., 25(5), 477–496, doi:10.1007/s00382-005-0040-5, 2005. Chiang, J. C. H., Biasutti, M., and Battisti, D. S.: Sensitivity of the Atlantic intertropical
conver-20
gence zone to last glacial maximum boundary conditions, Paleoceanography, 18(4), 1094, doi:10.1029/2003PA000916, 2003.
Clemens, S. C., Murray, D. W., and Prell, W. L.: Nonstationary Phase of the Plio-Pleistocene Asian Monsoon, Science, 274, 943–948, 1996.
Clemens, S., Prell, W., Murray, D., Shimmield, G., and Weedon, G.: Forcing mechanisms of the
25
Indian Ocean monsoon, Nature, 353, 720–725, 1991.
deMenocal, P. B.: Plio-Pleistocene African Climate, Science, 270, 53–59, 1995.
Ding, Z. L., Yu, Z. W., Rutter, N. W., and Liu, T. S.: Towards an orbital time scale for Chinese loess deposits, Quat. Sci. Rev., 13, 39–70, 1994.
Enomoto, T., Hoskin, B., and Matsuda, Y.: The formation mechanism of the Bonin high in
30
August, Q. J. R. Meteorol. Soc., 129, 157–178, 2003.
CPD
5, 557–593, 2009Effects of ice sheets and precession on
MIS-13 Climate
Q. Z. Yin et al.
Title Page
Abstract Introduction
Conclusions References
Tables Figures
◭ ◮
◭ ◮
Back Close
Full Screen / Esc
Printer-friendly Version
Interactive Discussion
on late Quaternary climates: sensitivity experiments with a general circulation model, Q. Sci. Rev., 17, 507–534, 1998.
Felzer, B., Oglesby, R. J., Webb III., T. and Hymand. E.: Sensitivity of a general circulation model to changes in Northern Hemisphere ice sheets, J. Geophys. Res., 101, 19077–19092, 1996.
5
Feng, Z.-D., Tang, L. Y., Ma, Y. Z., Zhai, Z. X., Wu, H. N., Li, F., Zou, S. B., Yang, Q. L., Wang, W.G ., Derbyshire, E., and Liu, K.-B.: Vegetation variations and associated environmental changes during marine isotope stage 3 in the western part of the Chinese Loess Plateau, Palaeogeography, Palaeoclimatology, Palaeoecology, 246, 278–291, 2007.
Guo, Z. T., Berger,A., Yin, Q. Z., and Qin, L.: Strong asymmetry of hemispheric climates during
10
MIS-13 inferred from correlating China loess and Antarctica ice records, Clim. Past Discuss., 4, 1061–1088, 2008,
http://www.clim-past-discuss.net/4/1061/2008/.
Guo, Z. T., Liu, T. S., Fedoroff, N., Wei, L. Y., Ding, Z. L., Wu, N. Q., L ¨u, H. Y., Jiang, W. Y., and An, Z. S.: Climate extremes in Loess of China coupled with the strength of Deep-Water
15
Formation in the North Atlantic, Global Planet. Change, 18, 113–128, 1998.
Guo, Z. T., Biscaye, P., Wei, L. Y., Chen, X. F., Peng, S. Z., and Liu, T. S.: Summer mon-soon variations over the last 1.2 Ma from the weathering of loess-soil sequences in China, Geophys. Res. Lett., 27, 1751–1754, 2000.
Imbrie, J., Hays, J. D., Martinson, D. G., McIntyre, A., Mix, A. C., Morley, J. J., Pisias, N. G.,
20
Prell, W. L., and Shackleton, N. J.: The orbital theory of Pleistocene climate: support from a revised chronology of the marineδ18O record, in: Milankovitch and Climate, Part 1, edited by: Berger, A. L., Imbrie, J., Hays, J., et al., D. Reidel Pub. Co., 269–305, 1984.
IPCC-Group I: Climate Change 2007: the Physical Science Basis, Summary for Policymakers. Contribution of Working Group I to the Fourth Assessment Report of IPCC, IPCC secretariat,
25
C/O WMO, Geneva, February, 2007.
Kitoh, A., Murakami, S., and Koide, H.: A simulation of the Last Glacial Maximum with a coupled atmosphere-ocean GCM, Geophys. Res. Lett., 28, 2221–2224, 2001.
Kutzbach, J. E. and Guetter, P. J.: The influence of changing orbital parameters and surface boundary conditions on climate simulations for the past 18 000 years, J. Atmos. Sci., 43,
30
1726–1759, 1986.
CPD
5, 557–593, 2009Effects of ice sheets and precession on
MIS-13 Climate
Q. Z. Yin et al.
Title Page
Abstract Introduction
Conclusions References
Tables Figures
◭ ◮
◭ ◮
Back Close
Full Screen / Esc
Printer-friendly Version
Interactive Discussion
Lambeck, K., Yokoyama, Y., Johnston, P., and Purcell, A.: Global ice volumes at the last glacial maximum and early lateglacial, Earth Planet. Sci. Lett., 181, 513–527, 2000.
Lisiecki, L. E. and Raymo, M. E.: A Pliocene-Pleistocene stack of 57 globally distributed benthic deltaδ18O records, Paleoceanography, 20(1), PA1003, doi: 10.1029/2004PA001071, 2005. Liu, Z., Trentesaux, A., Clemens, S. C., Colin, C., Wang, P., Huang, B., and Boulay, S.: Clay
5
mineral assemblages in the northern South China Sea: implications for East Asian monsoon evolution over the past 2 million years, Marine Geology, 201,133–146, 2003.
Manabe, S. and Broccoli, A. J.: The influence of continental ice sheets on the climate of an ice age, J. Geophys. Res., 90, 2167–2190, 1985.
Masson, V., Braconnot, P., Jouzel, J., de Noblet, N., Cheddadi, R., and Marchal, O.: Simulation
10
of intense monsoons under glacial conditions, Geophys. Res. Lett., 27. 1747–1750, 2000. Overpeck, J., Anderson, D., Trumbore, S., and Prell, W.: The southwest Indian Monsoon over
the last 18 000 years, Climate Dynam., 12, 213–225, 1996.
Paterson, W. S. B.: The Physics of Glaciers, Pergamon, Tarrytown, NY, 1994.
Peltier, W. R.: Global glacial isostasy and the surface of the ice-age Earth: the ICE-5G (VM2)
15
model and GRACE, Ann. Rev. Earth Planet Sci., 32, 111–149, 2004. Peltier, W. R.: Ice age paleotopography, Science, 265, 195–201, 1994.
Rind, D.: Components of the ice age circulation, J. Geophys. Res., 92, 4241–4281, 1987. Rossignol-Strick, M., Paterne, M., Bassinot, F. C., Emeis, K.-C., and De Lange, G. J.: An
unusual mid-Pleistocene monsoon period over Africa and Asia, Nature, 392, 269–272, 1998.
20
Rousseau, D. D. and Wu, N.: Mollusk record of monsoon variability during the L2-S2 Cycle in the Luochuan loess sequence, China, Quat. Res., 52, 286–292, 1999.
Rousseau, D.-D., Wu, N., Pei, Y., and Li, F.: hree exceptionally strong East-Asian summer monsoon events during glacial conditions in the past 470 kyr, Clim. Past Discuss., 4, 1289– 1317, 2008,
25
http://www.clim-past-discuss.net/4/1289/2008/.
Shackleton, N. J.: The 100 000-year Ice-Age Cycle identified and found to lag temperature, carbon dioxide and orbital eccentricity, Science, 289, 1897–1902, 2000.
Sirocko, F., Sarnthein, M., Lange, H., and Erlenkeuser, H.: Atmospheric summer circulation and coastal upwelling in the Arabian Sea during the Holocene and the last glaciation, Quat.
30
Res., 36, 72–93, 1991.
CPD
5, 557–593, 2009Effects of ice sheets and precession on
MIS-13 Climate
Q. Z. Yin et al.
Title Page
Abstract Introduction
Conclusions References
Tables Figures
◭ ◮
◭ ◮
Back Close
Full Screen / Esc
Printer-friendly Version
Interactive Discussion
Tiedemann, R., Sarntheim, M., and Shackleton, N.J.: Astronomic timescale for the Pliocene Atlanticδ18O and dust flux records of Ocean Drilling Program site 659, Paleoceanography, 9, 619–638, 1994.
Van Campo, E., Duplessy, J. C., and Rossignol-Strick, M.: Climatic conditions deduced from a 150 Kyr oxygen isotope-pollen record from the Arabian Sea, Nature, 296, 56–59, 1982.
5
Wu, N. Q., Chen, X. Y., Rousseau, D. D., Li, F. J., Pei, Y. P., and Wu, B.: Climatic conditions recorded by terrestrial mollusk assemblages in the Chinese Loess Plateau during marine Oxygen Isotope Stages 12-10, Q. Sci. Rev., 26, 1884–1896, 2007.
Yanase, W. and Abe-Ouchi, A.: The LGM surface climate and atmospheric circulation over East Asia and the North Pacific in the PMIP2 coupled model simulations, Clim. Past, 3, 439–451,
10
2007,
http://www.clim-past.net/3/439/2007/.
Yin, Q. Z. and Guo, Z. T.: Mid-Pleistocene vermiculated red soils in southern China as an indication of unusually strengthened East Asian monsoon, Chinese Science Bulletin, 51(2), 213–220, 2006.
15
Yin, Q. Z. and Guo, Z. T.: Strong summer monsoon during the cool MIS-13, Clim. Past, 4, 29–34, 2008,
http://www.clim-past.net/4/29/2008/.
Yin, Q. Z., Berger, A., Driesschaert, E., Goosse, H., Loutre, M. F., and Crucifix, M.: The Eurasian ice sheet reinforces the East Asian summer monsoon during the interglacial
20
CPD
5, 557–593, 2009Effects of ice sheets and precession on
MIS-13 Climate
Q. Z. Yin et al.
Title Page
Abstract Introduction
Conclusions References
Tables Figures
◭ ◮
◭ ◮
Back Close
Full Screen / Esc
Printer-friendly Version
Interactive Discussion
Table 1. Orbital parameters and ice volumes used for the experiments in this paper. The
same greenhouse gases concentrations (CO2=240 ppmv, CH4=510 ppbv and N2O=280 ppbv) are used in all these experiments.
Orbital parameters Exp. NO. Ice volume (10
6
km3) EA NA
506 ka BP: Exp. 1 0 0 eccentricity=0.034046 Exp. 2 1.96 3.48 obliquity=23.377◦ Exp. 3 2.79 5.67
longitude of perihelion=274.05◦ NHS at perihelion Exp. 4 3.63 7.38
Exp. 5 11.9 24.2 495 ka BP: Exp. 6 0 0 eccentricity=0.038638 obliquity=23.903◦ Exp. 7 3.63 7.38
CPD
5, 557–593, 2009Effects of ice sheets and precession on
MIS-13 Climate
Q. Z. Yin et al.
Title Page
Abstract Introduction
Conclusions References
Tables Figures
◭ ◮
◭ ◮
Back Close
Full Screen / Esc
Printer-friendly Version
Interactive Discussion
Fig. 1. Difference in the latitudinal and seasonal insolation (Wm−2) distribution between 506
CPD
5, 557–593, 2009Effects of ice sheets and precession on
MIS-13 Climate
Q. Z. Yin et al.
Title Page
Abstract Introduction
Conclusions References
Tables Figures
◭ ◮
◭ ◮
Back Close
Full Screen / Esc
Printer-friendly Version
Interactive Discussion
Fig. 2.Difference of July(a)and January(b)surface temperature between 506 and 495 ka BP
CPD
5, 557–593, 2009Effects of ice sheets and precession on
MIS-13 Climate
Q. Z. Yin et al.
Title Page
Abstract Introduction
Conclusions References
Tables Figures
◭ ◮
◭ ◮
Back Close
Full Screen / Esc
Printer-friendly Version
Interactive Discussion
Fig. 3.Difference in July surface temperature (◦C) at 506 ka BP between experiments with and
experiments without NA and EA ice sheets. (a) for small ice sheets, Exp. 4 minus Exp. 1;(b)
CPD
5, 557–593, 2009Effects of ice sheets and precession on
MIS-13 Climate
Q. Z. Yin et al.
Title Page
Abstract Introduction
Conclusions References
Tables Figures
◭ ◮
◭ ◮
Back Close
Full Screen / Esc
Printer-friendly Version
Interactive Discussion
Fig. 4. (a)July 200-hPa zonal wind (m/s) for Exp. 1 (506 ka BP without ice sheet),(b)same as
CPD
5, 557–593, 2009Effects of ice sheets and precession on
MIS-13 Climate
Q. Z. Yin et al.
Title Page
Abstract Introduction
Conclusions References
Tables Figures
◭ ◮
◭ ◮
Back Close
Full Screen / Esc
Printer-friendly Version
Interactive Discussion
Fig. 5.Difference in July surface temperature (◦C) at 495 ka BP between experiments with and
experiments without NA and EA ice sheets. (a) for small ice sheets, Exp. 7 minus Exp. 6;(b)
CPD
5, 557–593, 2009Effects of ice sheets and precession on
MIS-13 Climate
Q. Z. Yin et al.
Title Page
Abstract Introduction
Conclusions References
Tables Figures
◭ ◮
◭ ◮
Back Close
Full Screen / Esc
Printer-friendly Version
Interactive Discussion
Fig. 6. July precipitation difference at 506 ka BP between experiments with and experiments
CPD
5, 557–593, 2009Effects of ice sheets and precession on
MIS-13 Climate
Q. Z. Yin et al.
Title Page
Abstract Introduction
Conclusions References
Tables Figures
◭ ◮
◭ ◮
Back Close
Full Screen / Esc
Printer-friendly Version
Interactive Discussion
Fig. 7. (a)Difference in July 200-hPa zonal wind between Exp. 5 and Exp. 1 (Exp. 5 minus
CPD
5, 557–593, 2009Effects of ice sheets and precession on
MIS-13 Climate
Q. Z. Yin et al.
Title Page
Abstract Introduction
Conclusions References
Tables Figures
◭ ◮
◭ ◮
Back Close
Full Screen / Esc
Printer-friendly Version
Interactive Discussion
Fig. 8. July precipitation difference at 495 ka BP between experiments with and experiments
CPD
5, 557–593, 2009Effects of ice sheets and precession on
MIS-13 Climate
Q. Z. Yin et al.
Title Page
Abstract Introduction
Conclusions References
Tables Figures
◭ ◮
◭ ◮
Back Close
Full Screen / Esc
Printer-friendly Version
Interactive Discussion
Fig. 9. (a)Difference in July 800-hPa geopotential (m2s−2) at 495 ka BP between Exp. 8 (with
CPD
5, 557–593, 2009Effects of ice sheets and precession on
MIS-13 Climate
Q. Z. Yin et al.
Title Page
Abstract Introduction
Conclusions References
Tables Figures
◭ ◮
◭ ◮
Back Close
Full Screen / Esc
Printer-friendly Version
Interactive Discussion
Fig. 10. (a)Difference in July 800-hPa geopotential (m2s−2) at 506 ka BP between Exp. 5 (with