UDC 303.024: [331.52+331.56] JEL J 210
M. Balcerowicz-Szkutnik, Doctor of Sciences (Economics), Professor University of Economics in Katowice, Republic of Poland
THE COMPARATIVE ANALYSIS OF THE LABOR MARKET INDICATORS
IN A SELECTED GROUP OF EU COUNTRIES
The paper presents, in a synthetic way, the problems of dynamics of labour market of "ten new member states" that joined EU in 2004, focusing mainly on the level of employment and taking into account the lines of business and age employees. The time range from 2000 to 2011, selected for the purpose of the analysis, includes the years that directly preceded and directly followed the ac-cession to the EU and aims at determining possible changes in parameters that characterise the labour market in selected states.
Keywords: labour market; level of employment; servicisation of labour market.
Introduction. 2004 was the ground-breaking year for economy and position of 10 European countries on the market of Europe. This was because that was the year of their accession to Union community. Usually, together with economic changes, hopes for specific changes in everyday life occur in society. Some of those hopes were related to labour market, particularly to extending the possibilities to find work and improve people's well-being. Oriented changes were to, and could, bring decrease in unemploy-ment and increase in the level of employunemploy-ment. Particularly enormous hopes were rested in possibilities of employment in "old Union" member states. In the present chapter the analysis of major statistical parameters that characterise the situation of the labour market in spatial approach, that is, for selected group of states and time approach, for the years between 2000 and 2011, is performed. Presented results have the quality of initial analyses of the level of employment and unemployment in the group of states that joined the EU in 2004. The analyses were limited to the period of time between 2000 and 2011 to show whether important changes in the sphere of the level of employment and unemployment rate occurred in the years directly pre-ceding 2004 and in the years following the accession to the EU. Establishment of occurrence of specific changes shall allow formulating conclusions concerning the influence of economic changes associated with accession to the EU on the situation on the labour market. The chapter is divided into several parts. The first includes general characteristics of the age structure of individual countries – new EU mem-ber states; the second includes the analyses of the level of
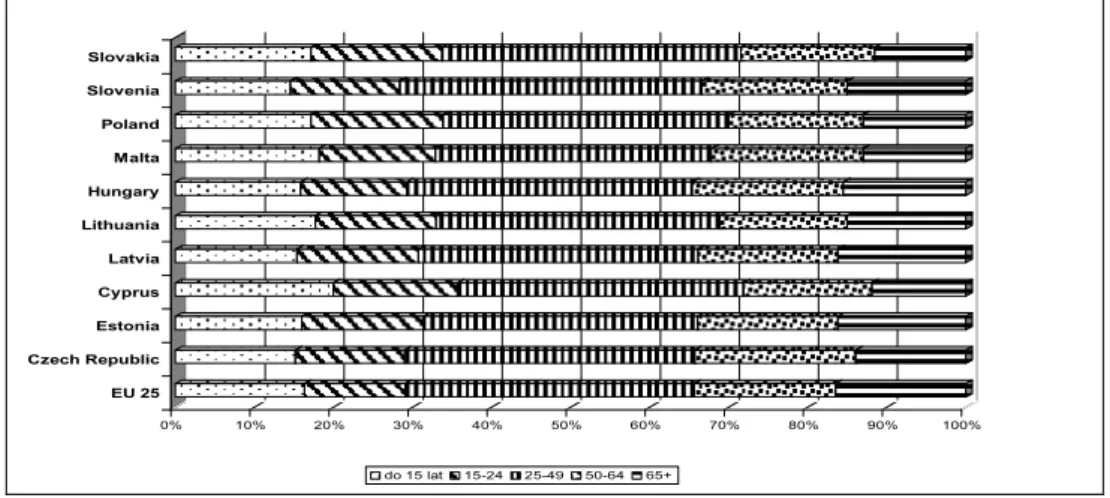
employment that takes into account the division of working people by lines of business. What is more, the changes in the level of employment in the following three age groups of employees are studied: the school-leavers (15 to 24 years of age), people on the highest level of profes-sional activity (24 to 54 years of age) and at pre-retirement age (55 to 64 years of age). The next part of the case study is made of analyses concerning unemployment rate while taking into consideration the employee's age and educa-tion, and separately, the analysis of a particular type of unemployment, that is long-term unemployment is per-formed. Data taken from Eurostat that were appropriately compiled for the needs of the subject matter included in the topic make empirical base for performed analy-ses.Population structure of "new" EU member states. On 1st May 2004 European Union was enlarged by 74 141 654 new people, the citizens of ten states that included: Cyprus, Estonia, Lithuania, Latvia, Poland, the Czech Re-public, Slovenia, Slovakia and Hungary. The number of people in these states was really varied. Polish people made the most numerous group of people (around 51 %) and inhabitants of the small Malta and Cyprus made the least numerous group (around 1 % each). Considering the age structure of populations of these states we can state that, while measuring the rate of people under 24 years of age, the youngest populations were those of Cyprus (35.1 %), Poland and Slovakia (33.2 %) and the oldest were the populations of Slovenia (27.8 %) and the Czech Republic (28.3 %), whereas the rate of young people under 24 years of age in the whole EU was 28.7 %.
0% 10% 20% 30% 40% 50% 60% 70% 80% 90% 100%
EU 25 Czech Republic Estonia Cyprus Latvia Lithuania Hungary Malta Poland Slovenia Slovakia
do 15 lat 15-24 25-49 50-64 65+
Fig. 1. Population age structure of "new" states that joined EU in 2004*
* Source: Own case study on the basis of Eurostat database. Varied age structure is confirmed by age median (tab. 1). Populations of Cyprus and Slovakia were made of people who were not older than 35 years of age. In the case of other states, half of populations reached the age under 39 years of age and with respect to age median only Lithuanians and Slovenians are close to EU level that is to 39.3 years of age. Additionally analysing the level of
popu-lation aging of each of the states as seen in the rate of people at over 65 years of age, we can state that it none of the states it was higher than the EU level, that is than 16.5 %. Therefore, the "new ten states" are the countries of relatively young people, who, from the point of view of la-bour market, make large lala-bour resources.
T a b l e 1. Population age median of selected group of EU states in 2004 (in years)*
EU 25 CZ. EE CY LV LT HU MT PL SI SK
39.3 38.5 38.7 34.8 39.0 37.3 38.8 37.7 36.2 39.4 35.0
* Source: Own case study on the basis of Eurostat database.
Extending the analyses of population structures of gen-der we can state that in each of the states a clear advan-tage of females over males was observed and only in the case of Cyprus, Malta and Slovenia, feminisation coeffi-cient (that is the measure that determines the level of
spe-cific "excess" in the number of females over males) was lower than in EU (105.2) and in the case of other member states it was reaching higher values of even 117.1 (Estonia and Lithuania). This is presented in table 2.
T a b l e 2. Feminisation coefficient for selected group of EU states in 2004*
EU 25 CZ. EE CY LV LT HU MT PL SI SK
105.2 105.3 117.1 103.3 117.1 114.2 110.6 101.9 106.6 104.4 106.0
* Source: Own case study on the basis of Eurostat database.
Level of employment and its social impor-tance.According to Eurostat data [1] the number of people working in EU states was 203 253.7 thousand people in 2004, out of which 29 285.9 thousand (that is 14.41 %) was made of citizens of the new states that joined the EU. There-fore EU structures grew by a large number of new employ-ees. In 2011 the potential of working people increased in comparison with 2004 by 3.89 % and amounted to 211 157.3 thousand people and for the "ten new EU member states" this increase was more dynamic because it in-creased by as much as 8.35 % (to the level of 31 729.8 thousand people). The level of changes in resources of working people in selected group of countries was differenti-ated and in part of them a decrease was observed. For ex-ample, in Estonia by 0.55 % in Lithuania and Hungary by around 3.9 % and 2.4 % in Latvia by about 14.4 %. On the other hand, in others the increase in the number of working people was observed. This was reported in Cyprus (11.3 %), Malta (13.8 %) and finally in Poland (16.8 %). This differen-tiation can be reasonably explained by emigration to earn a living and by entering the labour market by the generation of young people who were, for example in the case of Poland, the generation born in the 80s of the 20th century, that is in the period of the so-called second post-war birth rate boom.
Employment rate measured as the percentage of work-ing people in total number of people in a particular age group is one of the simplest and at the same time most expressive, as well as easy to interpret, measure of profes-sional activity of people. In international analyses, the total employment rate is defined for the age group at 15 to 64 years of age. In the group of the "ten states" the dynamics of this rate was significantly.
It is observed that from 2004, that is, since the year of accession of a group of new member states to the Euro-pean Union, the level of employment was successively growing for all analysed states until 2008. In 2008 in major-ity of states a rapid decrease in employment level is ob-served. The situation is certainly the reflection of the world financial crisis, when problems in world economy structures directly influenced the labour market and brought, as a consequence, its real crash. It was particularly noticeable in the case of such countries as Estonia, Lithuania, and Latvia, that is, the states of the former Soviet Union, but also in Slovakia and Hungary.
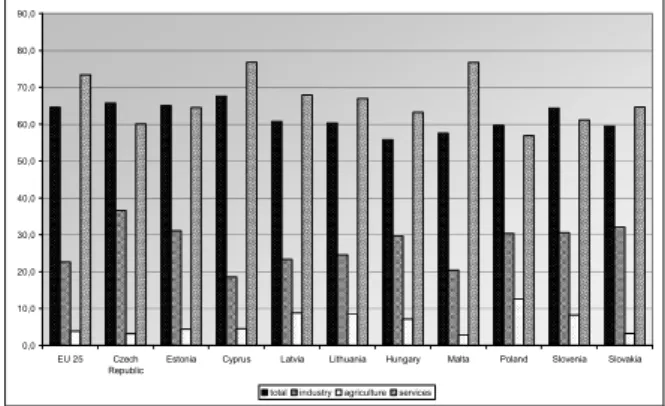
The change in the structure of the labour market with re-spect to employment sectors has been a serious problem for the last two decades. Frequent changes in proportion of the number of people employed in industry and service sector have been observed. Employment in agriculture in each of the states and in the whole EU is scant, or even marginal, because only in Poland it is over 10 %. The figures beneath (fig. 2, fig. 3 and fig.4) present in a simplified form the struc-ture of employment in three economy sectors – industry, services and agriculture in selected years. For detailed analyses the years of 2004, 2008 and 2011 were selected. These were the years of EU structures enlargement by 10 new member states, the year of the world financial crisis and the last year for which complete statistical data collected in Eurostat database was available. Apart from employment rates in three particular sectors, the values of total employ-ment rate for each of the states were also presented for the purpose of comparative analyses.
0,0 10,0 20,0 30,0 40,0 50,0 60,0 70,0 80,0
EU 25 Czech Republic
Estonia Cyprus Latvia Lithuania Hungary Malta Poland Slovenia Slovakia
total industry agriculture services
Fig. 2. Structure of employment by sectors in selected group of EU states in 2004*
0,0 10,0 20,0 30,0 40,0 50,0 60,0 70,0 80,0
EU 25 Czech Republic
Estonia Cyprus Latvia Lithuania Hungary Malta Poland Slovenia Slovakia
total industry agriculture services
Fig. 3. Structure of employment by sectors in selected group of EU states in 2008* *Source: Own case study on the basis of Eurostat database (access on 15th March 2013).
0,0 10,0 20,0 30,0 40,0 50,0 60,0 70,0 80,0 90,0
EU 25 Czech Republic
Estonia Cyprus Latvia Lithuania Hungary Malta Poland Slovenia Slovakia
total industry agriculture services
Fig. 4. Structure of employment by sectors in selected group of EU states in 2011* *Source: Own case study on the basis of Eurostat database (access on 15th March 2013).
Careful analysis of the figures above confirms the obser-vation formulated before and concerning the marginal share of agricultural sector in national labour markets. Still in 2004, beside Poland the level of employment in agriculture was higher than 10 % in Slovenia, Latvia, and Lithuania, but by 2008 and then by 2011 employment in agriculture was higher than 10 % only in Poland. It is seriously alarming that market labour structures are so significantly distorted and agricultural production is dominated by services. This is re-lated to servicisation of labour market, national economy and even everyday life that has been observed for some time. In simple explanation, servicisation means the increase in pro-portion of services in the structure of the studied phenome-non. Servicisation of national economy – in macroeco-nomic approach means increase in employment in the third sector, that is in services. On the other hand, servicisation
of consumption in households represents a percentage growth in expenditures on services in the structure of household expenditures. We have been facing this phe-nomenon recently all over the world because higher and higher rate of expenditures in household budgets is con-sumed by services, such as for example consumption in catering places, hiring baby-sitters, ordering catering for meetings and hiring people to clean the house.
On the scale of national economy of each of the "ten states", the process of servicisation has been developing for the last years at various paces and proceeded with various intensity. Corresponding relationships between employment rates in services and in industry are respec-tively presented in figures beneath. Fig. 5 is the image of changes in proportion in employment in services and in-dustry for each of the states.
1,000 1,500 2,000 2,500 3,000 3,500 4,000 4,500
2000 2001 2002 2003 2004 2005 2006 2007 2008 2009 2010 2011 E U 25 Czech Rep.c Estonia Cyprus Latvia Lithuania Hungary Malta Poland Slovenia Slovakia
Fig. 5 Dynamics of changes in the rate of employment in services and industry for selected states in the years from 2000 to 2011*
* Source: Own case study on the basis of Eurostat database (access on 15th March 2013).
Differentiation in the labour market in the sphere of the level of employment is observed not only in the view of economy sectors but also in demographic view that is while taking the employee's gender and age into consideration.
rea-son for such a decision is larger professional mobility and availability of men than women. Family and maternity du-ties, that women are responsible for, are another argument presented in discussions on preferences of employers as for the gender of employees, which decreases their attrac-tiveness on labour market. In "regional" discussions, that include considerations made for various countries, cultural burdens and religious beliefs play an important role, al-though the latters are less and less significant nowadays. However, the problem of inequality of employment due to the employee's gender is still open.
The values of appropriate columns of the diagram clearly show the scale of differences between the levels of employment in individual countries. The values of particular rates are additionally presented in tab. 3, in which the last column includes the quantity values that define differences in the level of employment of males and females (the ex-cess of employment rate for men and women in %).
The values presented in the last column of the table show that in Malta male employment is over twice higher than of females (female employment is 32.7 % and is lower by 42.4 % than male employment), in the Czech Republic it is higher by 16.3 % and in Cyprus by 21.1 %. In other countries it is lower than EU level that reaches the level of 15.2 %.
Analysing employment rates in a different way (fig. 11) we can state that in EU in 2004 there were 127 males em-ployed for every 100 emem-ployed women and this level was higher only in the Czech Republic (129), in Cyprus (136) and in Malta (226). On the other hand, the most proportional
level of employment, almost not "discriminating" women on the labour market was observed in Lithuania (112), Latvia (113) and in Estonia (111) and also in Slovenia (116).
Analysing the level of employment, we ought to pay atten-tion to one of the measures preferred in "Europe 2020 strat-egy" that was announced by European Commission [2] that is, the employment rate in the age group between 20 and 64 years of age. For all studied states the value of measure-ment compliant with Union standards included in aforemen-tioned project is higher than the value of generally adopted rate determined for the group of 15 to 64 years of age
According to the assumptions of "Europe 2020 strat-egy", in the sphere of employment, that is the major goal of the strategy, in 2020, 75 % of the total population between 20 and 64 years of age should have work. These are common goals that are going to be accomplished through a series of activities undertaken both on the level of member states as well as on the level of EU. At present none of the EU countries, nor the whole community of the states reach this level. In 2004, out of the group of analysed states, only Lithuania, Latvia, Estonia, Cyprus, Czech Republic and Slovenia exceeded the EU level. In 2011, the mean level of employment rate of the population from 20 to 64 years of age grew by 1.3 %; however, it was slightly higher only in the case of Cyprus, Estonia and the Czech Republic. There are still a few percentage points in some states, and sev-eral more percentage points missing in some others (Po-land, Malta, Hungary) to reach the "magic" level of 75. This is most clearly seen in table 3.
T a b l e 3. Employment rate in the years 2004, 2008 and 2011 by age groups for selected EU states
2004 2008 2011
GEO/AGE
15-64 20-64 15-64 20-64 15-64 20-64
EU 25 63.4 67.7 66.1 70.6 64.6 69.0
Czech Rep. 64.2 70.1 66.6 72.4 65.7 70.9
Estonia 63.0 70.6 69.8 77.0 65.1 70.4
Cyprus 68.9 74.9 70.9 76.5 67.6 73.4
Latvia 62.3 69.3 68.6 75.8 60.8 66.3
Lithuania 61.2 69.0 64.3 72.0 60.3 67.0
Hungary 56.8 62.1 56.7 61.9 55.8 60.7
Malta 54.0 57.9 55.3 59.1 57.6 61.5
Poland 51.7 57.3 59.2 65.0 59.7 64.8
Slovenia 65.3 70.4 68.6 73.0 64.4 68.4
Slovakia 57.0 63.7 62.3 68.8 59.5 65.1
*Source: Own case study on the basis of Eurostat database (available on 2nd April 2013).
As it has already been mentioned above, in the project Europe 2020, particular goals 1 are strictly related to each other, and mutually complement each other. In the sphere of employ-ment, attention ought to be drawn to such relationships as:
x improvement of the situation in the sphere of educa-tion, which should reduce unemployment and poverty,
x larger focus on research and development as well as innovations in economy, together with more effective use of resources should increase competitiveness of EU and shall contribute to creation of new working places,
x investment in cleaner technologies shall facilitate the struggle with climate changes and at the same time it shall create new possibilities for development of enter-prises and employees.
These goals show what general European Union situation in 2020 should be with respect to the most important parame-ters. They are arranged in such a way that each member state might control their progress in their implementation.
The ideas of the aforementioned strategy of develop-ment define the assumptions concerning the level of em-ployment for a wide age range of employees. However, it is obvious that the rates that describe the level of
1 Within the project "Europe 2020 Strategy" five major goals in the
sphere of employment, research and development, climate changing and sustained energy use, education and fighting the poverty and also social exclusion are being implemented.
ment are responsive to age of employees and depending on the age group they take various values. Therefore, the analysis of employment rates for various age groups of employees is going to be performed to complement the conducted studies. A simplified division includes three age groups: 15 to 24 years of age, 25 to 54 years of age, and 55 to 64 years of age. They are a group of school-leavers, professionally mobile employees2 and people at the end of their professional career.
In fig. 6 – 7 employment rates by major age groups are presented for the years 2004 and 2011. It can be seen that the highest value is taken by the rate for the age group between 25 – 54 years of age and apart from Malta, in each of the states it is the value that is not smaller than 68 % (in 2004), 74 % (in 2008) and 73 % (in 2013). On the other hand school-leavers, that is people at 15 – 24 years of age, had the largest problems with employment. This is observed in the value of employment coefficient for this age group3] which is not higher than 37 % (in 2004), 38 %
2 Appropriate age of occupationally mobile employees is between
25 to 44 years of age, but due to extension of life expectancy in more and more publications we can find the age between 25 to 54 years of age to be the age of life and occupational mobility.
3 The rate values for this age group can be most distorted and,
(in 2008) and 31 % (in 2011). These are the values of the rate for all the states apart from Malta. In the case of Malta the rates take the values definitely different from the EU
level and probably this is the result of economic and cul-tural specificity of this tiny island country.
0,0 10,0 20,0 30,0 40,0 50,0 60,0 70,0 80,0 90,0
EU 25 Czech Republic
Estonia Cyprus Latvia Lithuania Hungary Malta Poland Slovenia Slovakia 15-24 25-54 55-64
Fig. 6. Employment rate by age in 2004 for selected EU member states*
*Source: Own case study on the basis of Eurostat database (access on 2nd April 2013).
In the third of selected age group of employees the level of employment is definitely lower than in the middle group, but higher than in the group of school-leavers. It is a group of employees that constitutes the so-called "55+ generation" that is, people who are most exposed to effects of economic changes, burdened with lesions because of their age and the least prone to possible retraining that results from econ-omy restructuring. Special programs activating them and
counteracting their occupational marginalisation are created for this group of prospective employees. Unemployment resulting from the assumptions of changing economy, lack of opportunities and sometimes the lack of motivation to accept resulting challenges is most experienced by the group of the oldest employees. Comprehensive solutions suggested by governmental institutions not always find understanding among the people they are aimed at.
0,0 10,0 20,0 30,0 40,0 50,0 60,0 70,0 80,0 90,0
EU 25 Czech Republic
Estonia Cyprus Latvia Lithuania Hungary Malta Poland Slovenia Slovakia 15-24 25-54 55-64
Fig. 7. Employment rate by age in 2011 for selected EU states*
*Source: Own case study on the basis of Eurostat database (access on 2nd April 2013).
In each of the three distinguished age groups the changes in the level of employment are also observed in the analysed period.
For the youngest employees (15 to 24 years of age) the lowest values of the rate were observed in the case of Hungary and Lithuania. This can be the result of a high solarisation coefficient which means that young people devote more time to study and they do not to work.
In each of the age groups a decrease in employment rate is observed in 2011 when compared with 2004 and 2008. It is a specific echo of financial crisis of 2008 to 2009 when economies of particular countries were reducing em-ployment for the purpose of restructuring and saving.
The analysis of fig. 18 lets us state that in case of some countries, including Poland, we can notice the results of observing the assumptions of the Lisbon strategy of 2000 that set the requirement of increasing the employment rate in the age group of over 50 years of age on the level of 50 %. Although this level was not reached, a definite grow-ing tendency of its value was observed.
in each of the "ten states" (except for Estonia). In Poland quite a stable level with slight growing tendency was main-tained (by 0.15 %). The most dynamic changes and the strongest mean pace of growth in the level of employment are observed in the case of employees who are at most advanced age (55 – 64 years of age). As it has been men-tioned before, this is probably the result of observing the principles of Lisbon Strategy of 2000 in the sphere of ex-tension of occupational activation of the 50+ age group.
The states in which progress in employment of people over 55 years of age was most apparent included Slovakia and Hungary.
Conclusions. As analysis shows, problems of lack of employment stability are characteristic for every EU coun-try, especially those "new" ones. To strength European economic system, social insurance system and to improve conditions of public finances, European Committee is tak-ing efforts to improve general condition of European econ-omy. Within the *Europe 2020 *program one of main goals is to improve general level of employment up to 75 % in age group 20-64. There is group of actions which are about to lead to this goal. One of them is so called flexicurity of labour market, which characteristics is to improve social security. Another one is to take care about well skilled em-ployees which will improve level of productivity, competi-tiveness and economic growth. Next directions are to
cre-ate new, better labour places and better labour conditions. To improve level of employment it is important to create policy which will use main new labour places and promote entrepreneurship and self-employment.
EU states are able to achieve those goals and improve general level of employment, (especially women and elder citizens) if some vigorous actions are taken. Important fact is, that responsibility will be held by particular member states, because they have many essential instruments, not only political, but also social ones.
References
1. Population on 1 January by age and sex [Dostemp] // Eurostat [plakat]. – E-mail. dane. – Dostemp: http://appsso.eurostat.ec.europa.eu/nui/ show.do?dataset=demo_pjan&lang=en.
2. Europe 2020 strategy [Elyektronichny zasub] // European Commis-sion [plakat]. – E-mail. dane. – Dostemp: http://ec.europa.eu/europe2020/ europe-2020-in-your-country/index_pl.htm.
3. Diahnoza spolɟchna 2009: varunki i yakoshchch zhycha polyakuv" [Elyektronichny zasub] // Varshava: Rada monitorynhu Spolechnoho, Vɭshcha Shkola Finansuv i Zazhondzhanya v Varshavye [plakat]. – E-mail.. dane. – Dostemp: www.diagnoza.com/pliki/raporty/diagnoza_raport_2009.pdf.
4. Rynki Rynki pratsy novykh pan'stv shlonkovskikh UE [Elyektronichny zasub] // rynekpracy.pl [plakat]. – E-mail. dane. – Dostemp: http://www.rynekpracy.pl/raporty_1.php/wpis.38.
5. Eurostat. Statistics. Browse/ Search [Dostemp] // European Com-mission: [teren]. – Dostemp: http://epp.eurostat.ec.europa.eu/portal/page/ portal/statistics/search_database.
ɇ ɚ ɞɿ ɣ ɲɥ ɚ ɞ ɨ ɪ ɟ ɞ ɚɤ ɰ ɿ ʀ 1 5 . 1 0 . 1 3
Ɇ. Ȼɚɥɶɰɟɪɨɜɿɱ-ɒɤɭɬɧɿɤ, ɞ-ɪɟɤɨɧ. ɧɚɭɤ, ɩɪɨɮ.
ȿɤɨɧɨɦɿɱɧɢɣɭɧɿɜɟɪɫɢɬɟɬɦ. Ʉɚɬɨɜɿɰɟ, Ɋɟɫɩɭɛɥɿɤɚɉɨɥɶɳɚ
ɉɈɊȱȼɇəɅɖɇɂɃȺɇȺɅȱɁɉɈɄȺɁɇɂɄȱȼɊɂɇɄɍɉɊȺɐȱȼȽɊɍɉȱɇɈȼɂɏɑɅȿɇȱȼȯɋ
ɍɫɬɚɬɬɿɩɪɨɚɧɚɥɿɡɨɜɚɧɨɞɢɧɚɦɿɤɭɩɨɤɚɡɧɢɤɿɜɡɚɣɧɹɬɨɫɬɿɭɪɨɡɪɿɡɿɝɚɥɭɡɟɜɨʀɬɚɜɿɤɨɜɨʀɫɬɪɭɤɬɭɪɢɡɚɣɧɹɬɨɝɨɧɚɫɟɥɟɧɧɹ "10 ɧɨɜɢɯ
ɤɪɚʀɧ-ɱɥɟɧɿɜ"ȯɜɪɨɩɟɣɫɶɤɨɝɨɋɨɸɡɭ, ɹɤɿɭɜɿɣɲɥɢɞɨɫɤɥɚɞɭȯɋɭ 2004 ɪɨɰɿ, Ⱦɥɹɩɪɨɜɟɞɟɧɧɹɚɧɚɥɿɡɭɨɛɪɚɧɨɱɚɫɨɜɢɣɪɹɞ 2000-2011 ɪɪ., ɹɤɢɣ
ɨɯɨɩɥɸɽɩɟɪɿɨɞɢɞɨɬɚɩɿɫɥɹɜɫɬɭɩɭɰɢɯɤɪɚʀɧɞɨȯɋ, ɳɨɞɚɥɨɡɦɨɝɭɜɢɡɧɚɱɢɬɢɡɦɿɧɢɭɩɨɤɚɡɧɢɤɚɯɡɚɣɧɹɬɨɫɬɿ, ɹɤɿɯɚɪɚɤɬɟɪɢɡɭɸɬɶ
ɫɬɚɧɬɚɬɟɧɞɟɧɰɿʀɪɨɡɜɢɬɤɭɪɢɧɤɭɩɪɚɰɿɜɢɳɟɡɚɡɧɚɱɟɧɢɯɤɪɚʀɧɡɚɰɟɣɩɟɪɿɨɞ.
Ʉɥɸɱɨɜɿɫɥɨɜɚ: ɪɢɧɨɤɩɪɚɰɿ; ɪɿɜɟɧɶɛɟɡɪɨɛɿɬɬɹ; ɫɟɪɜɿɫɿɡɚɰɿɹɪɢɧɤɚɩɪɚɰɿ.
Ɇ. Ȼɚɥɶɰɟɪɨɜɢɱ-ɒɤɭɬɧɢɤ, ɞ-ɪɷɤɨɧ. ɧɚɭɤ, ɩɪɨɮ.
ɗɤɨɧɨɦɢɱɟɫɤɢɣɭɧɢɜɟɪɫɢɬɟɬɝ. Ʉɚɬɨɜɢɰɟ, Ɋɟɫɩɭɛɥɢɤɚɉɨɥɶɲɚ
ɋɊȺȼɇɂɌȿɅɖɇɕɃȺɇȺɅɂɁɉɈɄȺɁȺɌȿɅȿɃɊɕɇɄȺɌɊɍȾȺȼȽɊɍɉɉȿɇɈȼɕɏɑɅȿɇɈȼȿɋ
ȼɫɬɚɬɶɟɩɪɨɚɧɚɥɢɡɢɪɨɜɚɧɚɞɢɧɚɦɢɤɚɩɨɤɚɡɚɬɟɥɟɣɡɚɧɹɬɨɫɬɢɜɪɚɡɪɟɡɟɨɬɪɚɫɥɟɜɨɣɢɜɨɡɪɚɫɬɧɨɣɫɬɪɭɤɬɭɪɵɡɚɧɹɬɨɝɨɧɚɫɟɥɟ
-ɧɢɹ "10 ɧɨɜɵɯɝɨɫɭɞɚɪɫɬɜ-ɱɥɟɧɨɜ" ȿɜɪɨɩɟɣɫɤɨɝɨɋɨɸɡɚ, ɤɨɬɨɪɵɟɜɨɲɥɢɜɫɨɫɬɚɜȿɋɜ 2004 ɝɨɞɭ. Ⱦɥɹɩɪɨɜɟɞɟɧɢɹɚɧɚɥɢɡɚɜɵɛɪɚɧɜɪɟ
-ɦɟɧɧɨɣɪɹɞ 2000-2011 ɝɝ., ɤɨɬɨɪɵɣɨɯɜɚɬɵɜɚɟɬɩɟɪɢɨɞɵɞɨɢɩɨɫɥɟɜɫɬɭɩɥɟɧɢɹɷɬɢɯɫɬɪɚɧɜȿɋ, ɱɬɨɩɨɡɜɨɥɢɥɨɩɪɨɫɥɟɞɢɬɶɢɡɦɟɧɟ
-ɧɢɹɜɩɨɤɚɡɚɬɟɥɹɯɡɚɧɹɬɨɫɬɢ, ɤɨɬɨɪɵɟɯɚɪɚɤɬɟɪɢɡɭɸɬɫɨɫɬɨɹɧɢɟɢɬɟɧɞɟɧɰɢɢɪɚɡɜɢɬɢɹɪɵɧɤɚɬɪɭɞɚɜɵɲɟɭɩɨɦɹɧɭɬɵɯɫɬɪɚɧɡɚ
ɢɫɫɥɟɞɭɟɦɵɣɩɟɪɢɨɞ.
Ʉɥɸɱɟɜɵɟɫɥɨɜɚ: ɪɵɧɨɤɬɪɭɞɚ; ɭɪɨɜɟɧɶɛɟɡɪɚɛɨɬɢɰɵ; ɫɟɪɜɢɫɢɡɚɰɢɹɪɵɧɤɚɬɪɭɞɚ.
UDC 338.45:339.138 JEL M310
N. Butenko, PhD in Economics, Associate Professor, L. Paschuk, PhD in Economics, Assistant of Professor Taras Shevchenko National University of Kyiv, Kyiv
SYNERGIC EFFECTS OF THE PARTNERSHIP NETWORKS FORMATION
AT THE INDUSTRIAL MARKET
In article the partnership network essence is defined, the major perspectives and specifics of synergic effect appearance within partnership networks at industrial market is analyzed.
Keywords: synergic effects; partnership networks; industrial market; partnership marketing.
Problem definition. Active search of the competive-ness sources in the modern conditions of the globalization of the economy stipulates enforcement of the attention to the opportunities of the development to the additional val-ues to the customer with resulting competitive advantages at the basis of partnership relations development with the major partners – suppliers, distributors, customers and others. Each of the partners contributes to the development of competitive advantages at the market. Partnership rela-tions are one of the key elements of maintenance of the
sustainability of the economic subjects of the industrial or business-to-business market. Moreover, in the current situation one of the major competitive advantages is readi-ness to collaborate and constant search of the most effec-tive partners' relations, which would enable the organiza-tion to gain, retain and strengthen its competitive advan-tages. Taking into account mentioned above formation of the partners' connections which represent the basis of business relations is one of the elements of the strategy of the enterprise and forms the basis for successful