300
Limited-area short-range ensemble predictions targeted for heavy
rain in Europe
Kai Sattler and Henrik Feddersen
Danish Meteorological Institute, Lyngbyvej 100, DK-2100 Copenhagen Ø, Denmark
Email for orresponding author address: [email protected]
Abstract
Inherent uncertainties in short-range quantitative precipitation forecasts (QPF) from the high-resolution, limited-area numerical weather prediction model DMI-HIRLAM (LAM) are addressed using two different approaches to creating a small ensemble of LAM simulations, with focus on prediction of extreme rainfall events over European river basins. The first ensemble type is designed to represent uncertainty in the atmospheric state of the initial condition and at the lateral LAM boundaries. The global ensemble prediction system (EPS) from ECMWF serves as host model to the LAM and provides the state perturbations, from which a small set of significant members is selected. The significance is estimated on the basis of accumulated precipitation over a target area of interest, which contains the river basin(s) under consideration. The selected members provide the initial and boundary data for the ensemble integration in the LAM. A second ensemble approach tries to address a portion of the model-inherent uncertainty responsible for errors in the forecasted precipitation field by utilising different parameterisation schemes for condensation and convection in the LAM. Three periods around historical heavy rain events that caused or contributed to disastrous river flooding in Europe are used to study the performance of the LAM ensemble designs. The three cases exhibit different dynamic and synoptic characteristics and provide an indication of the ensemble qualities in different weather situations. Precipitation analyses from the Deutsche Wetterdienst (DWD) are used as the verifying reference and a comparison of daily rainfall amounts is referred to the respective river basins of the historical cases.
Keywords: ensemble numerical weather prediction, heavy rain, rainfall uncertainties
Introduction
There are several reasons why ensemble techniques are commonly used in numerical weather prediction (NWP) to address uncertainty in weather forecasting. The most important one is the well known circumstance that the atmospheric behaviour appears to be chaotic because of its sensitive dependence on the state prescription (Thompson, 1957; Lorenz, 1963). Another fact is that it is impossible to determine the state of the atmosphere, ocean and land-surface precisely and completely at a certain point in time. These circumstances render uncertainty tracking by use of a simple error tracking impossible, and the unavoidable uncertainties in the initial state can be expected to amplify rather fast. An additional source of uncertainty occurs due
to the approximate description of the atmosphere in the NWP model as well as numerical simulation errors.
301 more conservative atmospheric parameters like mean sea
level pressure, geopotential height or even upper level temperature.
A specific target pursued by the LAM ensembles has been the probabilistic assessment of significant rain events, which can lead to severe damage (Du et al., 1997; Bright and Mullen, 2002; Frogner and Iversen, 2002). This target is also pursued in the current work. The study investigates the use of high-resolution LAM ensemble designs, which try to capture the statistically rare events of strong precipitation despite a small ensemble size. The model used in the investigations is the HIgh Resolution Limited-Area Model (HIRLAM) in the version used at the Danish Meteorological Institute (DMI), DMI-HIRLAM. Two different approaches are investigated. They try to address uncertainty emerging in the initial condition, at the lateral boundary and from the model.
The paper is structured as follows. The following section gives a description of the ensemble approaches and outlines the configuration of the DMI-HIRLAM model for the ensemble integrations. The next section describes the historical cases and results from the ensemble hindcasts, and the final section summarises conclusions.
Ensembles and model
Precipitation is one of those atmospheric parameters which is related to the prognostic variables, both through dynamic as well as thermodynamic processes, and there is virtually no atmospheric equation which does not exhibit an impact on precipitation. Thus, all sources of uncertainty in the NWP model can be expected to contribute to some extent to the uncertainty in a precipitation forecast.
The uncertainty in the initial atmospheric condition (IC) is considered to play a major role. However, none of the commonly utilised methods for IC perturbation is utilised directly in the current approach, because a LAM not only needs a state description at its initial point but also frequent additional state descriptions at its lateral boundaries. To address both consistently, the concept of a perturbed host model is employed. ECMWFs operational global EPS has been chosen as host model for this purpose. The ensemble size is, however, too large to apply a high-resolution LAM like HIRLAM on each member of the ensemble. Therefore, a selection of members is undertaken, sampling those members which are believed to be most significant for the prediction. The basic idea of selecting members from a global EPS goes back to Molteni et al. (2001). A different selection procedure is, however, employed in the current work. It is related to the tubing method (Atger, 1999), but the aim of the present selection method is not so much a
classification of the ensemble members as an attempt to capture extreme events with a small ensemble. The selection is performed in a parameter space spanned by the 5-day accumulated grid-point precipitation on a geographical target grid covering the area of interest. This area contains the river basin(s) under consideration plus a small surrounding area. The number of grid points in the area determines the dimension Dp of the parameter space, and Eucledian distance between two rainfall fields Ra and Rb, with grid point rainfall ra,iand rb,i respectively, is used as a similarity measure:
(1)
The first member of the selection ensemble (SE), denoted S1, is identified by the smallest distance to the ensemble mean R. The second selected member S2 is identified by the largest distance to the ensemble mean. All following members are then selected in order to maximise the SE dispersion:
(2)
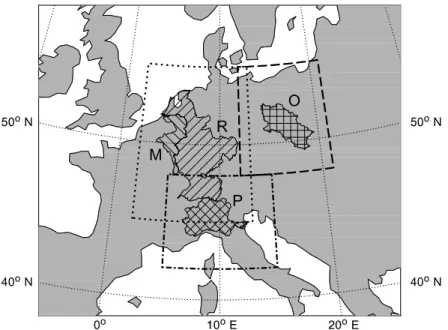
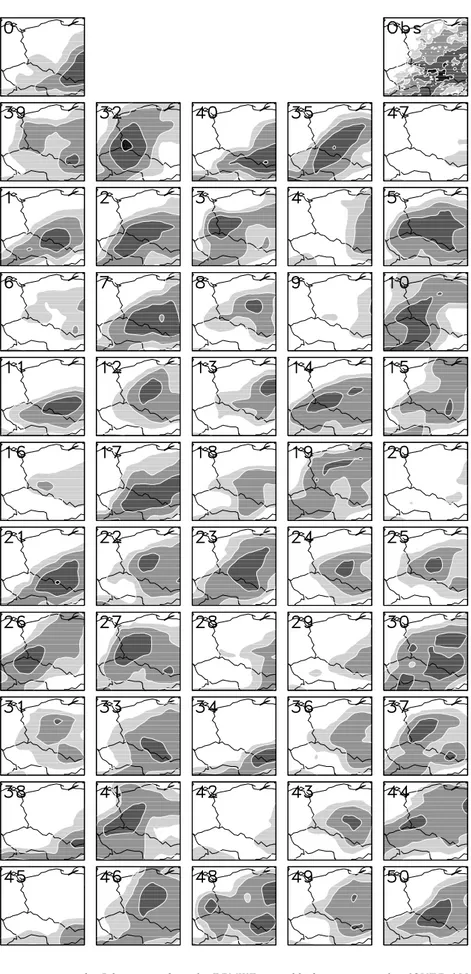
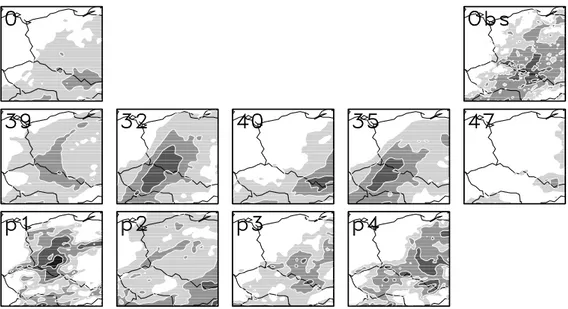
where S denotes the mean from the respective SE. Finally, the control forecast is always added, because it is based on the best guess analysis. The size L of the SE had been chosen to L=5, resulting in a 5+1 ensemble, i.e. five selected members plus the control. The target areas used in the selections for the ensembles were different in the three historical cases that were studied. They are outlined in Fig. 1. As an example, the selection from the ECMWF ensemble forecasts from 4 July 1997 is shown in Fig. 2. It is based on the target area for the Odra catchment (Oin Fig. 1). The five selection members S1S5 are shown in the first row of pictures. They resemble the possible extremes well, from the very small precipitation amounts of member 47 to the extremes of member 32. The ensemble member selection shown seems to be a good approximate representation of the 50 members with respect to the precipitation.
The uncertainties in the precipitation predictions that arise from the model formulation and discretisation have been addressed by a multi-scheme approach (Houtekamer et al., 1996; Stensrud et al., 2000; Bright and Mullen, 2002). Here, the parameterisations for condensation and convective processes have been altered between the ensemble members, resulting in a parameterisation ensemble (PE). This does not cover all possible model errors related to precipitation, but the parameterisations mentioned above are regarded as major contributors to the model related errors in precipitation forecasts.
The first scheme that was used treats stratiform
2 , , 1
) (
) ,
( ai bi
D
i b
a R r r
R d
p
¦
) . (R1R
d S
¦
L
Si L
L d R S
disp
2 i 1
302
Fig. 1. Target areas of the ensemble member selections for the HIRLAM SE of the three heavy rainfall events. The river basins covered are the Po basin (P) with the target area outlined as dash-dots, the basins of river Rhine (R) and Meuse (M) in the dotted target area and the Odra basin (O) in the dashed target area.
0o
✁
1✂
0o
✁
E✄
2☎
0o
✁
E✄
40o
✁
N 5✆
0o
✁
N✝
40o
✁
N 5✆
0o
✁
N✝
P M
R
O
condensation by a first order adjustment of temperature and humidity (Kållberg, 1989) and parameterises stratiform precipitation evaporation proportional to the saturation deficit (Kessler, 1969). The second scheme was developed by Kuo et al. (1974) and Anthes (1977) and parameterises convection in addition to the stratiform condensation. Convection may occur within conditionally unstable layers on the basis of resolved moisture convergence (Kållberg, 1989). Evaporation is determined similarly as in the stratiform case. The third scheme treats stratiform and convective condensation regimes and includes a parameterisation of micro-physical processes (Sundqvist et al., 1989). The criterion for distinguishing the two regimes is based on the buoyancy state of surface air after being lifted to the lifting condensation level. The ice phase is introduced as a prognostic variable in this scheme (Sundqvist, 1993), and the representation of cirrus clouds and anvils is included. Källén (1996) described the implementation of the scheme into HIRLAM. The fourth scheme is a mass-flux type scheme for convection and condensation (Tiedtke, 1989, 1993). It distinguishes between shallow, medium and deep convection, and a description for cumulus downdrafts is included. Micro- physical processes are treated similarly as in the third scheme. The fifth scheme is the STRACO scheme (Soft TRAnsition COndensation), and it parameterises moist processes and includes stratiform regimes as well as convection of variable depth and height, and also in several levels (Sass et al., 1997; Undén et al., 2002). The treatment of convection is similar
to the second scheme, but with a modified moisture convergence closure, which also considers the influence of the surface evaporation flux as well as convective transport of cloud condensate. Stratiform regimes are parameterised by considering an equilibrium in a first order adjustment of the cloud condensate, which is associated with changes in temperature and humidity due to other processes.A specific feature of the scheme is the inclusion of a relaxed transition between stratiform and convective regimes and vice versa, which also includes a dependency on model grid resolution.The STRACO scheme is the current standard parameterisation scheme in DMI-HIRLAM, and it was used also in the integrations of the SE members.
The size of the PE resulted in 4+1 members. The host model data were taken from the control run of the ECMWF-EPS. Thus, the member using the STRACO scheme is identical to the control run from the SE. The combination ensemble (CE), combining simply the members from the SE and the PE, was investigated, too.
304
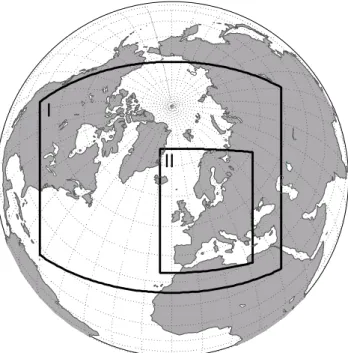
HIRLAM model is represented on a 0.1°-grid with the same vertical structure as the 0.3°-model. It receives data from the 0.3°-model with a 1-hour frequency.
Model simulations for three events
The model simulations over the periods of the three historical heavy rain events were performed on a daily basis. A forecast was started at 12 UTC each day within the respective period of each event (see below) and performed over a forecast range of 72 hours. The three periods investigated were from historical events that occurred in three different regions in
Europe and that are characterised by different meteorological circumstances around the rainfall events.
The first event was the Piemonte flood from November 1994 (Buzzi et al., 1995). The flood was mainly caused by a single major rainfall event between 5 and 6 November 1994 (Fig. 4, left panel). It was connected to a small depression developing over the Balearic Islands from a baroclinically unstable trough positioned over western Europe. The depression crossed the Alps from the south, resulting in an enhancement of precipitation to extreme values by orographic forcing south of the Alpine chain. The period, for which DMI-HIRLAM ensemble integrations were performed, comprises the days between 1994-11-25 and 1994-11-03.
The second case occurred in January 1995 and affected the rivers Rhine and Meuse (Meijgaard and Jilderda, 1995; Fink et al., 1995). It was different from the first case in two respects. Firstly, hydrological causes like snow melt were linked to the flooding. Secondly, the spatial and temporal extensions of the rainfall events were larger than in the first case (Fig. 4, centre panel). The period for which the ensemble integrations were performed comprises 1995-01-20 to 1995-01-30. During this period, a chain of depressions with fronts embedded within a westerly flow regime persistently transported humidity from the north Atlantic over Europe. The single rainfall events that occurred were not extreme but significant: they became harmful not as single events but in their sum.
The third historical case happened at the beginning of July 1997 and affected the Odra river (Keil et al., 1999). It is characterised by few rainfall events of extreme type (Fig. 4, right panel). The meteorological situation over the central to eastern European area was dominated by a quasi-stationary depression. It was connected to a dynamically induced ascent that released significant amounts of precipitation for several days over the area of southern Fig. 3. Regions covered by the two DMI-HIRLAM nested models.
The outer model domain (I) is covered by a 0.3°-grid, while the inner domain (II) is covered by a 0.1°-grid. The inner model covers all important river catchments of Europe.
Fig. 4. Distributions of rainfall (in mm) from the DWD rainfall analysis of the three heavy rain events. Left: 24 hour accumulated precipitation over Northern Italy between 5 and 6 November 1994, 6 UTC (first event). Middle: 10 day accumulated precipitation over Belgium/Luxemburg/ France/Germany between 21 and 30 January 1995, 6 UTC (second event). Right: 3 day accumulated precipitation over Poland/Chzech Rep. between 5 and 8 July 1997, 6 UTC (third event).
I
II
50
50
50
50
50
50
50
50 50 50
50
50
50 50
50
50
50
50
50
5050 50
50N
5E 10E
acc. 1995012106 to 1995013006 (240h)
50
50 50
50
50
50
50 50 50
50
50 50
50
50 50
50
50
50
50 50
45N
5E 10E 15E
acc. 1994110506 to 1994110606 (24h)
50N
15E 20E
acc. 1997070506 to 1997070806 (72h)
50 50
50
50 50
50 50
50
50
50
50 50
50
50 50
50
50 50 50 50
50 50 50 5050
50
50 50 50 50
50
5050 50 50
50 50
Poland, south-east Germany and the Czech Republic.
Convective episodes occurred in addition to the large scale rainfall, and orography played an important role in the rainfall distribution by intensifying precipitation over the mountains. The period covered by the DMI-HIRLAM ensemble integrations comprises 1997-06-26 to 1997-07-08.
Results
The ensemble predictions for the three periods mentioned above were evaluated against precipitation analyses from the DWD. These were performed on the grid of the Lokal-Modell LM (Doms and Schättler, 1999), and they are based on rain gauge observations from the synoptic meteorological network as well as from the denser network of climatological stations that report daily precipitation amounts. In the case of the Piemonte flooding of November 1994, DWD included additional rainfall data from the Mesoscale Alpine Project MAP (MAP, 2002) in the analyses.
To illustrate the two DMI-HIRLAM ensembles, Fig. 5 shows the 3-day accumulated rainfall fields for the simulations started at 4 July 1997, 12 UTC. This is the same date as shown in the example in Fig. 2. In this forecast the control exhibited rather weak precipitation activity compared to the observation (top left and top right panel of Fig. 5). The SE members (panels in the middle of Fig. 5) reflect the rainfall fields from the selected host model ensemble members and include fine scale structure in the
distribution of preciptation. They represent to a certain extent the prescribed alternatives of the large scale dynamics from the host model ensemble. The significant spread in rainfall amounts from the host model ensemble is retained in the SE (compare members 32 and 47 in Fig. 5). The members of the PE are shown in the bottom row of Fig. 5. They exhibit significant spread, even though the members are driven by the same initial and boundary conditions. This reflects uncertainty in simulating the small scale convective episodes in this case.
The area chosen for a verification comprises the region 41°N58°N latitude and 5°W19°E longitude. However, the verifying DWD analyses exist on a grid with 0.0625° in grid size, whereas the DMI-HIRLAM has 0.1° mesh size. To avoid interpolation errors, the rainfall analyses were aggregated on 5 × 5 grid boxes and the forecasts were aggregated on 3 × 3 corresponding grid boxes, resulting in a verification based on a grid with approximately 30 × 30 km2 per grid box.
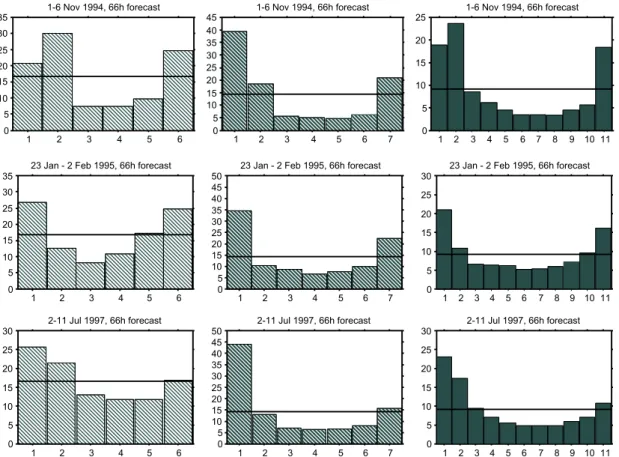
In a first verification, ranked histograms (Talagrand histograms, Strauss and Lanzinger, 1996; Hamill and Colucci, 1997) were determined to investigate the ensemble spread. These are built upon classifying the verifying data within the ranked members of the ensemble. There are n+ 1 intervals for an n-member ensemble. The ranked histogram becomes flat if the ensemble distribution is equal to the distribution of the verifying data. This flatness is a necessary, but not a sufficient, condition for the equality of the distributions. The ranked histograms are given in Fig. 6 for
the different ensembles covering the forecast range 42 66 hours. They show that both the SE and the PE exhibit too little dispersion, not capturing the observed distribution optimally. The PE tends to represent the small precipitation amounts better, i.e. a flatter histogram at the low ranks, than does the SE. This indicates a tendency of the STRACO scheme to over-predict small rainfall intensities in the Piemonte case, a weakness that has recently been addressed (Sass et al., 2002). The characteristics of the distribution do not change when combining the ensembles (Fig. 6, panels to the right). The ranked histograms for the forecast range 1842 hours (not shown) do not differ significantly from those shown for the 4266 h range.
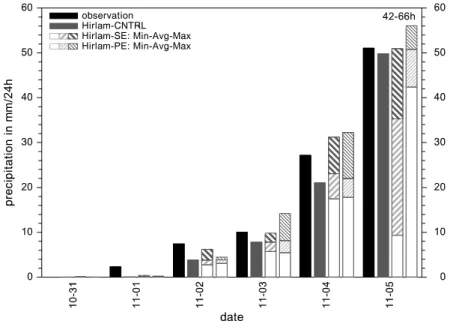
The historical DMI-HIRLAM ensemble forecasts for the three flood events have been evaluated also on the level of the river catchments affected. Area-averaged precipitation amounts were determined for this purpose over the respective river basins from the DWD precipitation analyses, and compared to the respective averages from the model predictions. They are shown in Fig. 7 for daily accumulated rainfall over the Po river basin during the days up to the heavy rain event of the Piemonte flood in November 1994.
The forecasts shown from the SE and the PE and their control forecast refer to the 4266 h range. The hatched areas in the columns, which depict the SE and PE ensemble forecasts, indicate the values from the ensemble member predicting the smallest rainfall (the beginning of the light grey hatched columns), the ensemble mean (transition between light grey and dark grey hatched columns), and the ensemble member predicting the largest rainfall (the end of the dark grey hatched columns). The control forecasts, which are based on the unperturbed analysis and boundaries, and which are integrated using the STRACO parameterisation, predicted almost the observed precipitation amounts in the case of the Piemonte 1994 rainfall event (Fig. 7, grey columns). Only at day 11-04, does the prediction lie about 6 mm below the observed value. Both ensemble designs, however, enhance the prediction for this day, including the observed amount within the ensemble range between minimum and maximum member prediction. As the event is characterised by a strong orographic forcing that determined a clear trigger to vertical motion and condensation, the different parameterisation schemes of the PE behaved similarly, leading to the PE dispersion remaining relatively small at
Fig. 6. Ranked histograms of the 24h precipitation in the forecast range 4266h, for the two ensemble designs PE (left panels) and SE (centre panels), as well as for their combination CE (right panels). The panels in the rows refer to the different historical heavy rain cases that were investigated. The horizontal lines depict the ideal distribution respectively.
0 5 10 15 20 25 30 35
1 2 3 4 5 6
1-6 Nov 1994, 66h forecast
0 5 10 15 20 25 30 35 40 45
1 2 3 4 5 6 7
1-6 Nov 1994, 66h forecast
0 5 10 15 20 25
1 2 3 4 5 6 7 8 9 10 11
1-6 Nov 1994, 66h forecast
0 5 10 15 20 25 30 35
1 2 3 4 5 6
23 Jan - 2 Feb 1995, 66h forecast
0 5 10 15 20 25 30 35 40 45 50
1 2 3 4 5 6 7
23 Jan - 2 Feb 1995, 66h forecast
0 5 10 15 20 25 30
1 2 3 4 5 6 7 8 9 10 11
23 Jan - 2 Feb 1995, 66h forecast
0 5 10 15 20 25 30
1 2 3 4 5 6
2-11 Jul 1997, 66h forecast
0 5 10 15 20 25 30 35 40 45 50
1 2 3 4 5 6 7
2-11 Jul 1997, 66h forecast
0 5 10 15 20 25 30
1 2 3 4 5 6 7 8 9 10 11
day 11-05. On the other hand, the SE, which is based on
perturbed initial and boundary conditions, exhibits a wide range in the rainfall forecast for day 11-05. This indicates the diversity of the dynamic development (e.g. the depth and position of the low) resulting from different estimates of the atmospheric state. Despite the dispersion in the SE, there are three SE members predicting rainfall amounts very close to the observed, namely the control and two of the selected perturbed members (not shown).
During the period of the second historical rainfall event investigated, the control forecast often underpredicted the observed precipitation amounts over the Meuse river basin (Fig. 8, grey columns). This is a result of both underestimation of the rain volume, the rain area and misplacement of the rainfall locations. For most of the days shown in Fig. 8, the PE indicates improvement with respect to the control in the prediction of the precipitation events. These were connected to frontal dynamics, that is Fig. 7. Daily precipitation amounts averaged over the Po river basin for the first days of November 1994. The columns show the DWD rainfall analyses of observations (black) and the 4266 hour forecasts from the ensemble control (grey), as well as the ensembles SE (coarse hatches) and PE (fine hatches).
42-66h 1 ✁ 0 ✂ -3 ✄ 1 ✁ 11 -0 ✂ 1 1 ✁ 1 ✁ -0 ✂ 2 ☎ 11 -0 ✂ 3 ✄ 11 -0 ✂ 4 1 ✁ 1 ✁ -0 ✂ 5 ✆ d✝ a✞ t✟ e✠ 0✡ 10✡ 20 ✡ 3☛ 0✡ 4☞ 0✡ 5✌ 0✡ 60✡ p✍ re ✎ c ✏ ip ✍ it ✑ a ✒ t ✑ io ✓ n in m m / ✔ 24 h 0✡ 10✡ 20 ✡ 3 ☛ 0 ✡ 4☞ 0✡ 5✌ 0✡ 60✡ o✕ b✖ s✗ e✘ r✙ v✚ a✛ t✜ i✢ o✕ n✣ H ✤ i ✢ r✙ l ✥ a✛ m✦ -C ✧ N ★ T ✩ R ✪ L ✫ Hirla✛ m-S ✬
E: Min-Avg✭
-Ma✛
x Hirla✛
m-PE: Min-Avg✭
-Ma✛
x
Fig. 8. Daily precipitation amounts averaged over the Meuse river basin at the end of January 1995. The columns show the DWD rainfall analyses of observations (black) and the 4266 hour forecasts from the ensemble control (grey), as well as the ensembles SE (coarse hatches) and PE(fine hatches).
42-66h 0 ✁ 1-2 2 0 ✁ 1-2 3 ✂ 0 ✁ 1 ✄ -2 ☎ 4 ✆ 0 ✁ 1 ✄ -2 ☎ 5 ✝ 0 ✁ 1 ✄ -2 ☎ 6 ✞ 0 ✁ 1-2 7 0 ✁ 1-2 8 ✟ 0 ✁ 1 ✄ -2 ☎ 9 ✠ 0✁ 1 ✄ -3 ✂ 0✁ 0 ✁ 1-3 ✂ 1 0 ✁ 2 ☎ -0 ✁ 1 ✄ d✡ a☛ t☞ e✌ 0✍ 5✎ 1✏ 0✍ 1✏ 5✎ 20✍ 25✎ 3✑ 0✍ p✒ re ✓ c ✔ ip ✒ it ✕ a ✖ t ✕ io ✗ n in m m / ✘ 24 h 0✍ 5✎ 1✏ 0✍ 1✏ 5✎ 20✍ 25✎ 3✑ 0✍ o✙ b ✚ s✛ e✜ rva✢ t ✣ io✙ n Hirla✢ m-C✤ NTRL H✥ i✦ r✧ l★ a✢ m✩ -S✪ E✫ :✬ M✭ i✦ n✮ -A✯ v✰ g✱ -M✭ a✢ x✲ Hirla✢
m-PE: Min-Avg✱ -Ma✢
Fig. 9. Temporal development of precipitation averaged over the Meuse river basin between 2023 January 1995, 12 UTC. The curves show the observed rainfall (red) as well as the control forecasts from the ECMWF-EPS (dark blue) and the HIRLAM ensembles (black). The vertical bars depict the range of the ensemble member predictions between the extreme members from the ECMWF-EPS (light blue), the PE (grey) and the SE (green).
0 10 20 30 40 50
01-21 01-22 01-23
0 10 20 30 40 50
date
precipitation in mm
1995-01 Meuse river basin
ECMWF-EPS: MIN-MAX HIRLAM-PE: MIN-MAX
HIRLAM-SE: MIN-MAX
HIRLAM, CNTRL
ECMWF-EPS, CNTRL
Observation
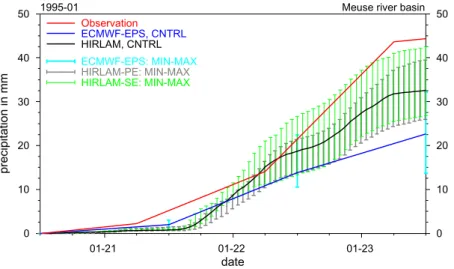
represented in HIRLAM partly by resolved dynamics and partly through taking their effect into account via sub-grid parameterisation. The role of the SE is therefore important, too, because it tries to capture the variations in the resolved dynamics. At day 01-22 it is thus the SE that indicates the observed rainfall best. Regarding the SE and the PE as one combined ensemble may be an advantage in general.
The prediction columns for day 01-22 in Fig. 8 refer to the model integrations started 20 January at 12 UTC. The rainfall development over the Meuse river basin for these integrations is shown in Fig. 9. It shows that the HIRLAM control forecast (black) predicts larger rainfall amounts than the control of the ECMWF-EPS (dark blue), but the accumulated amount of the HIRLAM control after the three
days shown in the figure is still significantly below the observed amount (red). The most extreme member predictions from the ECMWF-EPS(light blue vertical bars) range from about 13 mm to 32 mm after the three days, just reaching the values which the HIRLAM control predicted. The SE (green vertical bars) reaches towards higher values than the range for the PE (grey vertical bars), reflecting the circumstances for day 01-22 mentioned above.
In the 3-day predictions started one day later, namely on 21 January 1995, the ensembles compare differently (Fig. 10). The ECMWF-EPS (blue) underpredicts the development of the rainfall amounts. The HIRLAM control forecast (black) performs very well, and the PE includes the observed amounts within its ensemble member range
Fig. 10. Temporal development of precipitation averaged over the Meuse river basin between 2124 January 1995, 12 UTC. Curves and bars as in Fig. 9.
0 10 20 30 40 50
01-22 01-23 01-24
0 10 20 30 40 50
date
precipitation in mm
1995-01 Meuse river basin
ECMWF-EPS: MIN-MAX HIRLAM-PE: MIN-MAX
HIRLAM-SE: MIN-MAX
HIRLAM, CNTRL
ECMWF-EPS, CNTRL
Fig. 11. Daily precipitation amounts averaged over the Odra river basin at the beginning of July 1997. The columns show the DWD rainfall analyses of observations (black) and the 4266 hour forecasts from the ensemble control (grey), as well as the ensembles SE (coarse hatches) and PE (fine hatches).
42-66h 0 ✁ 7-0 ✁ 1 0 ✁ 7-0 ✁ 2 0✁ 7 ✂ -0 ✁ 3✄ 0 ✁ 7 ✂ -0 ✁ 4 ☎ 0 ✁ 7 ✂ -0 ✁ 5 ✆ 0 ✁ 7-0 ✁ 6 ✝ 0 ✁ 7 ✂ -0 ✁ 7 ✂ 0 ✁ 7-0 ✁ 8 ✞ 0 ✁ 7-0 ✁ 9 ✟ 0 ✁ 7-1 0 ✁ 0✁ 7 ✂ -1 ✠ 1 ✠ d✡ a☛ t☞ e✌ 0✍ 1✎ 0✍ 20✍ 3✏ 0✍ 40✍ 5✑ 0✍ p✒ re ✓ c ✔ ip ✒ it ✕ a ✖ t ✕ io ✗ n in m m / ✘ 24 h 0✍ 1✎ 0✍ 20✍ 3✏ 0✍ 40✍ 5✑ 0✍ o✙ b✚ s✛ e✜ rva✢ t✣ io✙ n Hirla✢ m-C✤ NTRL H✥ i✦ r✧ l★ a✢ m✩ -S✪ E✫ :✬ M✭ i✦ n✮ -A✯ v✰ g✱ -M✭ a✢ x✲ Hirla✢
m-PE: Min-Avg✱ -Ma✢
x (grey vertical bars in Fig. 10). The SE members (green
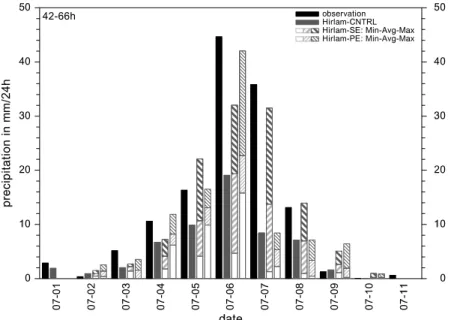
vertical bars), on the other hand, all tend to less rainfall. The daily precipitation amounts over the Odra river basin during the period of the third historical heavy rain event investigated are shown in Fig. 11. As in the respective figures above, the 4266 h forecast range is compared to the precipitation analysis from the DWD. The control forecasts performed rather poorly during the integration period, whereas the DMI-HIRLAM ensembles most often improve the prediction. This case is characterised by large-scale dynamic developments that are resolved in DMI-HIRLAM, as well as by embedded convective processes that are mostly represented in the model through the sub-grid scale parameterisation scheme. Therefore, both ensemble designs generally play an important role in the forecasts. At day 07-06 the PE gives the best rainfall estimates, and at day 07-07 it is only the SE that can give any indication of the continued rainfall activity.
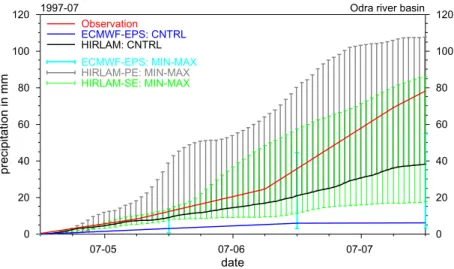
The circumstances just described are also reflected in the graphs of Figs. 12 and 13, which show the rainfall development over the 3-day forecast period of the ensemble predictions started at 4 July 1997 and 5 July 1997, 12 UTC respectively. The HIRLAM control forecast (black) did not perform well, as already mentioned, even though it is still an enhancement with respect to the ECMWF-EPS control (dark blue). In the forecasts started at 4 July 1997 (Fig. 12) the ensemble member range of the SE (green) includes the observation (red) and exhibits an enhancement to the ECMWF-EPS range (light blue). The graph for the SE indicates a tendency towards the earlier start of the rain event
in at least one of the predictions. The range in the PE is even larger (grey vertical bars), and the minimum lies at a higher value. The predictions started one day later (Fig. 13) show a different situation, where the SE is superior to the PE. The PE range does not develop further after 07-07 6 UTC, and nor does the control. As the initial state and the boundary states for the PE and the control are the same, this indicates that the uncertainty in the initial state and at the lateral boundaries played the most important role in this case, the SE therefore being more appropriate. Combining the two ensembles would take advantage of both situations in a first approximation. However, the bad influence from the PE at day 07-07 would be significant.
Conclusions
The two different ensemble designs SE and PE described above were tested on three periods of about 10 days duration around historical heavy rain events that caused or contributed to disastrous river flooding in Europe. An evaluation was performed against precipitation analyses from the DWD and focus was put on the rainfall over the affected river basin, respectively, providing an indication of the hydrological impact of the rainfall predictions. The ensemble sizes were 5+1 and 4+1, respectively, with the control integrations of the two ensemble designs being identical.
310
In the case where large-scale dynamic processes and orographic forcing are dominant, the development of condensation and convection is rather well defined, leaving the behaviour of the different parameterisation schemes for these processes very similar. The PE thus tends to exhibit less spread than the SE, the latter accounting for the possibilities of deviations in the synoptic development. In the second case, where cyclones of modest depth pass over flat or slightly hilly terrain during the winter, forcing from the surface is weak, and both the large-scale flow and the frontal dynamics affect the development of condensation and rainfall. This means that there are processes involved which are addressed by either of the ensemble designs SE or PE. This is also the case for the summer event, where the heavy rainfall was caused by large scale ascent in a quasi-stationary depression and dynamically triggered convection.
Fig. 13. Temporal development of precipitation averaged over the Meuse river basin between 58 July 1997, 12 UTC. Curves and bars as in Fig. 9.
Fig. 12. Temporal development of precipitation averaged over the Odra river basin between 47 July 1997, 12 UTC. Curves and bars as in Fig. 9.
0 20 40 60 80 100 120
07-05 07-06 07-07
0 20 40 60 80 100 120
date
precipitation in mm
1997-07 Odra river basin
ECMWF-EPS: MIN-MAX HIRLAM-PE: MIN-MAX
HIRLAM-SE: MIN-MAX
HIRLAM: CNTRL
ECMWF-EPS: CNTRL
Observation
0 20 40 60 80 100 120
07-06 07-07 07-08
0 20 40 60 80 100 120
date
precipitation in mm
1997-07 Odra river basin
ECMWF-EPS: MIN-MAX HIRLAM-PE: MIN-MAX
HIRLAM-SE: MIN-MAX
HIRLAM: CNTRL
ECMWF-EPS: CNTRL
Observation
Combining the two ensemble designs seems, therefore, often to be advantageous. As, however, an ensemble may still fail to capture the real rainfall development, the combination can sometimes exhibit a degraded performance.
311 that such an ensemble design can be superior to a pure
multi-scheme approach or an ensemble based purely on initial condition perturbation.
Application of the ensemble designs for hydrological purposes such as flood warning or even flood forecasting would typically involve ensemble integrations with a hydrological model. As long as the rainfall forecasts are biased, this will also become apparent in the water level forecasts. A correction of the rainfall field bias is therefore regarded as essential. Future improvements in the NWP model will certainly reduce this error, but it cannot be expected to disappear. An appropriate treatment of the rainfall fields on the basis of model-related statistics should therefore be envisaged in the future.
Acknowledgments
This work was funded by the European Community within the scope of the project An European Flood Forecasting System (EFFS) under contract No. EVG1-CT-1999-00011. The hydrological institutes that were involved in this project provided the river catchment data. The authors are also grateful to Dr. Roberto Buizza (ECMWF), who kindly supplied the model level data from the ECMWF-EPS, and to the Deutsche Wetterdienst (DWD), who provided the precipitation analysis data. Acknowledgement is also made for the use of ECMWFs computing and archive facilities in this research.
References
Anthes, R.A., 1977. A cumulus parameterization scheme utilizing a one-dimensional cloud model. Mon. Weather Rev., 105, 270
286.
Atger, F., 1999. Tubing: an alternative to clustering for the classification of ensemble forecasts. Wea. and Forecasting, 14,
741757.
Bright, D.R. and Mullen, S.L., 2002. Short-Range Ensemble Forecasts of Precipitation during the Southwest Monsoon. Wea. and Forecasting, 17, 10801100.
Buzzi, A., Cacciamani, C., Paccagnella, T., Patruno, P. and Tartaglione, N, 1995. Preliminary meteorological analysis of the Piedmont flood of November 1994. MAP Newsletter, 2, 26. Doms, G. and Schättler, U., 1999. The non-hydrostatic
limited-area model LM (Lokal-Modell) of DWD. Part I: Scientific documentation. Available from Deutscher Wetterdienst, Geschäftsbereich Forschung und Entwicklung, Postfach 100465, 63004 Offenbach, Germany.
Du, J., Mullen, S.L. and Sanders, F., 1997. Short-range ensemble forecasting of quantitative precipitation. Mon. Weather Rev.,
125, 24272459.
Fink, A., Ulbrich, U. and Engel, H., 1995. Aspects of the January 1995 flood in Germany. Weather, 51, 3439.
Frogner, I.-L. and Iversen, T., 2002. High-resolution limited-area ensemble predictions based on low-resolution targeted singular vectors. Quart. J. Roy. Meteorol. Soc., 128, 13211341.
Hamill, T.M. and Colucci, S.J., 1997. Evaluation of Eta-RSM short-range ensemble forecasts. Mon. Weather Rev., 125, 1312
1327.
Houtekamer, P.L. and Derome, J., 1994. Prediction experiments with two-member ensembles. Mon. Weather Rev., 122, 2179
2191.
Houtekamer, P.L., Lefaivre, L., Derome, J., Ritchie, H. and Mitchell, H.L., 1996. A system simulation approach to ensemble prediction. Mon. Weather Rev., 124, 12251242.
Källén, E. (Ed.), 1996. HIRLAM Documentation Manual system 2.5. Available from the Swedish Meteorological and Hydrological Institute (SMHI) Norrköping, Sweden.
Keil, C., Volkert, H. and Majewski, D., 1999. The Oder flood in July 1997: Transport routes of precipitable water diagnosed with an operational forecast model. Geophys. Res. Lett., 26, 235238.
Kessler, E., 1969. On the distribution and continuity of water substance in atmospheric circulations. Meteorol. Monogr. 32, 84pp.
Kuo, H.L., 1974. Further studies of the parameterization of the influence of cumulus convection on large-scale flow. J. Atmos. Sci., 31, 12321240.
Kållberg, P., 1989: HIRLAM Forecast Model Level 1 Documentation Manual. 77pp. Available from the Swedish Meteorological and Hydrological Institute (SMHI) Norrköping, Sweden.
Lorenz, E., 1963. Deterministic nonperiodic flow. J. Atmos. Sci.,
42, 433471.
MAP, 2002. The MAP Data Centre. MeteoSwiss, Krähbühlstr. 58, CH-8044 Zürich.
Marsigli, C., Montani, A.,Nerozzi, F., Paccagnella, T., Tibaldi, S. and Molteni, F., 2001. A strategy for high-resolution ensemble prediction. II: Limited-area experiments in four Alpine flood events. Quart. J. Roy. Meteorol. Soc., 127, 20952115.
Meijgaard, E. van and Jilderda, R., 1995. The Meuse flood in January 1995. Weather, 51, 3945.
Molteni, F., Buizza, R., Palmer, T.N. and Petroliagis, T., 1996. The ECMWF ensemble prediction system: methodology and validation. Quart. J. Roy. Meteorol. Soc., 122, 73119.
Molteni, F., Buizza, R.,Marsigli, C., Montani, A., Nerozzi, F. and Paccagnella, T., 2001. A strategy for high-resolution ensemble prediction. I: Definition of representative members and global-model experiments. Quart. J. Roy. Meteorol. Soc., 127, 2069
2094.
Sass, B.H., 1997. Reduction of numerical noise connected to the parameterization of cloud and condensation processes in the HIRLAM model. HIRLAM Newsletter, 29, 3745. Available from the Swedish Meteorological and Hydrological Institute (SMHI) Norrköping, Sweden.
Sass, B.H., Nielsen, N.W., Jørgensen, J.U., Amstrup, B., Kmit, M. and Mogensen, K.S., 2002. The operational DMI-HIRLAM system 2002-version. DMI Tech. Rep., 02-05. Available from the Danish Meteorological Institute (DMI) Copenhagen, Denmark.
Stensrud, D.J., Brooks, H.E., Du, J., Tracton, S. and Rogers, E., 1999: Using ensembles for short-range forecasting. Mon. Weather Rev., 127, 433446.
Stensrud, D.J., Bao, J.-W. and Warner, T.T., 2000. Using initial condition and model physics perturbations in short-range ensembles. Mon. Weather Rev., 128, 20772107.
Strauss, B. and Lanzinger, A., 1996. Validation of the ECMWF ensemble prediction system. Proc. ECMWF seminar on predictability, II, 4-8 September 1995, 157166.
312
Sundqvist, H., 1993. Inclusion of Ice Phase of Hydrometeors in Cloud Parameterization for Mesoscale and Large Scale Models. Beitr. Phys. Atmos., 66, 137147.
Thompson, P.D., 1957. Uncertainty of initial state as a factor in the predictability of large scale atmospheric flow patterns. Tellus,
4, 275295.
Tiedtke, M., 1989. A Comprehensive Mass Flux Scheme for Cumulus Parameterization in Large-Scale Models. Mon. Weather Rev., 117, 17791800.
Tiedtke, M., 1993. Representation of Clouds in Large-Scale Models. Mon. Weather Rev., 121, 30403061.
Toth, Z. and Kalnay, E., 1993. Ensemble forecasting at NMC: the generation of perturbations. Bull. Amer. Meteorol. Soc., 74,
23172330.