A. Fernàndez-Canteli et alii, Frattura ed Integrità Strutturale, 30 (2014) 327-339; DOI: 10.3221/IGF-ESIS.30.40
327 Focussed on: Fracture and Structural Integrity related Issues
A probabilistic interpretation of the Miner number for fatigue life
prediction
A. Fernández-Canteli, S. Blasón
University of Oviedo
[email protected] , [email protected]
J.A.F.O. Correia, A.M.P. de Jesus
University of Trás-os-Montes e Alto Douro, Vila Real, Portugal UCVE-IDMEC-LAETA/School of Sciences and Technology [email protected], [email protected]
ABSTRACT. The Miner number M, used as a tool for lifetime prediction of mechanical and structural
components in most of the standards related to fatigue design, is generally accepted as representing a damage stage resulting from a linear progression of damage accumulation. Nonetheless, the fatigue and damage approach proposed by Castillo and Fernández-Canteli, permits us to reject this conventional cliché by relating M to the normalized variable V, which represents percentile curves in the S-N field unequivocally associated to probability of failure. This approach, allowing a probabilistic interpretation of the Miner rule, can be applied to fatigue design of mechanical and structural components subjected to variable amplitude loading. The results of an extensive test program on concrete specimens under compressive constant and load spectra, carried out elsewhere, are used. A parallel calculation of the normalized variable V and the Miner number M is performed throughout the damage progression due to loading allowing probabilities of failure to be assigned to any value of the current Miner number. It is found that significant probabilities of failure, say P=0.05, are attained for even low values of M, thus evidencing the necessity of a new definition of the safety coefficient of structural or machine components when the Miner rule is considered. The experimental and analytical probability distributions of the resulting Miner numbers are compared and discussed, the latter still providing a non-conservative prediction in spite of the enhancement. A possible correction is analyzed.
KEYWORDS. Cumulative damage; Miner number; Statistical interpretation.
INTRODUCTION
A. Fernàndez-Canteli et alii, Frattura ed Integrità Strutturale, 30 (2014) 327-339; DOI: 10.3221/IGF-ESIS.30.40
328
ranges becomes unity. After this formulation, this rule is repeatedly tested for different materials under multi-step and variable amplitude loading programs. Though its applicability has been often questioned, it has been practically adopted by all standards related to structural and mechanical fatigue design.
While Birnbaum and Saunders [1] tried to find a relation of the probabilistic distribution of the Miner number to the crack growth, Van Leeuwen and Siemes [2, 3] conducted series of tests on plain concrete and interpreted directly the scatter of the Miner number M by obtaining theoretical expressions for the mean and standard deviation values of M from the Wöhler curve. These formulae, initially derived for the simple case of constant amplitude cycling were then extended to the case of general loading. They showed that the Miner number M at failure is a stochastic variable with an approximate log-normal distribution and emphasized the importance of the study of the scatter of the Wöhler curve for constant amplitude cycling. Based on Holmen’s investigation on concrete [4], Fernández-Canteli [5] justified a generalization of the Van Leeuwen and Siemes work by considering a probabilistic S-N field providing a statistical distribution of the Miner number although based on a log-normal distribution. Some theoretical advances were performed in [6] and [7].
From this, it follows that the Miner number can be used to ascertain the probability of failure, as a more suitable design criterion, rather than as a measure of a problematic and abstract “degree of damage”. It can then be taken as a basis for a consistent life prediction in fatigue design, in accordance with the consideration of fatigue failure as limit state.
RESULTS FROM HOLMEN
n this Section, the fatigue results for concrete specimens under compression provided in the study of Holmen [4] are introduced and eventually adapted in order to proceed to the probabilistic interpretation of the Miner Number.
Figure 1: S-N field fitted with the Mc Call model [7] for the normalized fatigue results for concrete under compression from Holmen [4].
S-N fatigue results for constant stress level
Fig. 1, shows the S-N field resulting from the fatigue data obtained in Holmen’s fatigue experimental program, according to Tab. 1, using the procedure proposed by Mc Call [8]. The tests were carried out for constant stress range S=Smax -Smin=(max-min)/R and constant minimum stress level (Smin=minR=0.05), where max and min are, respectively, the maximum and minimum stress applied during the test and R is the fracture stress of the concrete This model, based on fitting a regression hyperbola linking the respective percentiles values resulting from the cumulative distribution functions
A. Fernàndez-Canteli et alii, Frattura ed Integrità Strutturale, 30 (2014) 327-339; DOI: 10.3221/IGF-ESIS.30.40
329
(cdf) at any of the intervening stress ranges seems to be applicable only when a large number of results are at disposal, as this is the case, with an extensive amount of data. Nevertheless, it does not fulfil “a priori” the requested physical and statistical requirements for a model to be valid, in particular, the compatibility between the cumulative distribution functions of the number of cycles given stress range F[N;Δσ] and of the stress range given number of cycles E[Δσ;N]. As an alternative, the S-N resulting under consideration of the Weibull (or Gumbel) probabilistic model proposed by Castillo and Fernández-Canteli is shown in Fig. 2. The parameters estimated using the latter model allows us to define the normalized variable V=(log N-B)(log -C) as a Weibull (or Gumbel) distribution for minima, thus facilitating the relation of the V values to the probability of failure.
Figure 2: S-N field fitted with the Weibull model of Castillo-Canteli [6] for the normalized fatigue results for concrete under compression from Holmen [4].
S Number of cycles to failure
0.95 257; 74; 105; 120; 206; 83; 123; 109; 37; 76; 143; 85; 203; 72; 217
0.90 356; 201; 295; 252; 680; 509; 540; 311; 257; 457; 216; 226; 451; 1129; 342
0.825 1246; 2590; 5560; 4820; 2410; 2400; 4110; 3590; 3330; 1460; 1258; 5598; 3847; 1492; 2903
0.75 16190; 27940; 67340; 1860; 12600; 6710; 26260; 50090; 15570; 9930; 20300; 48420; 24900; 36350; 17280
0.675 3294820; 1459140; 1329780; 1241760; 339830; 896330; 280320; 102950; 658960; 1399830; Run-Out; 485620; 366900; 1250200; 11784100 (Run-Out); Run-Out
Table 1: Results of the fatigue tests under constant stress range loading for Smin=0.05. From Holmen [4].
Load collective and basic loading block used
A. Fernàndez-Canteli et alii, Frattura ed Integrità Strutturale, 30 (2014) 327-339; DOI: 10.3221/IGF-ESIS.30.40
330
was derived from a loading collective, consisting in 30 steps of the maximum normalized stress Smax= max/ R . After truncation at level 18 and omission of stress ranges below level 9, which implies to discard the lower stress levels, presumablywithout causing damage, the definitive stress collective in Fig. 3b, considered as representative of the effective stress being supported by the concrete in the real off-shore structure, was applied to the specimens in a pseudo-random sequence.
a)
b)
Figure 3: Holmen’s load collectives from [4]: a) Original load histogram consisting in 30 stress steps and b) Loading model 3 with truncation of higher stress amplitudes and omission of lower stress amplitudes applied in the fatigue variable testing.
A. Fernàndez-Canteli et alii, Frattura ed Integrità Strutturale, 30 (2014) 327-339; DOI: 10.3221/IGF-ESIS.30.40
331
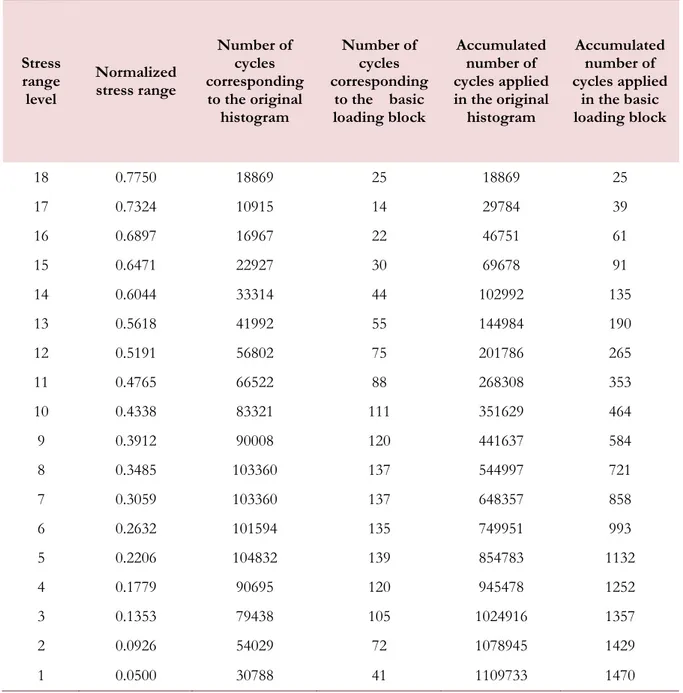
by arranging the stress range sequence intervening in the basic stress block in a random manner. After direct conversion of the load to stress for the cylindrical specimens used in the test, the stress ranges corresponding to the 18 levels considered in the load collective, the number of cycles in the original block and those in the basic stress block are exposed in Tab. 2. The number of total cycles to failure for the tests performed under variable loading according to Holmen and the corresponding number of replications of the basic stress blocks necessary to achieve failure are displayed in Tab. 3.
Stress range level
Normalized stress range
Number of cycles corresponding to the original
histogram
Number of cycles corresponding
to the basic loading block
Accumulated number of cycles applied in the original
histogram
Accumulated number of cycles applied
in the basic loading block
18 0.7750 18869 25 18869 25
17 0.7324 10915 14 29784 39
16 0.6897 16967 22 46751 61
15 0.6471 22927 30 69678 91
14 0.6044 33314 44 102992 135
13 0.5618 41992 55 144984 190
12 0.5191 56802 75 201786 265
11 0.4765 66522 88 268308 353
10 0.4338 83321 111 351629 464
9 0.3912 90008 120 441637 584
8 0.3485 103360 137 544997 721
7 0.3059 103360 137 648357 858
6 0.2632 101594 135 749951 993
5 0.2206 104832 139 854783 1132
4 0.1779 90695 120 945478 1252
3 0.1353 79438 105 1024916 1357
2 0.0926 54029 72 1078945 1429
1 0.0500 30788 41 1109733 1470
A. Fernàndez-Canteli et alii, Frattura ed Integrità Strutturale, 30 (2014) 327-339; DOI: 10.3221/IGF-ESIS.30.40
332
Test
ref. Smax Nf Miner
Number of basic load blocks
1 0.775 294670 0.6 201
2 0.775 291911 0.58 199
3 0.775 687112 1.38 468
4 0.775 76328 0.15 52
5 0.775 143992 0.29 98
6 0.775 548075 1.12 373
7 0.775 809727 1.64 551
8 0.8 49698 0.22 34
9 0.8 64508 0.3 44
10 0.825 25537 0.25 18
11 0.825 55710 0.53 38
12 0.825 92798 0.93 64
13 0.825 102330 1.04 70
14 0.836 31890 0.5 22
15 0.836 31971 0.51 22
16 0.836 20388 0.22 14
17 0.836 83638 1.11 57
18 0.775 41038 0.18 71
19 0.775 189486 0.86 325
20 0.775 213384 0.83 366
21 0.775 161450 0.58 277
22 0.775 28714 0.13 50
23 0.775 43345 0.19 75
24 0.775 72929 0.34 125
25 0.775 32715 0.14 57
26 0.8 28717 0.3 50
27 0.8 39697 0.41 68
28 0.825 33856 0.75 58
29 0.825 9615 0.2 17
Test
ref. Smax Nf Miner
Number of basic load blocks
30 0.825 4416 0.08 8
31 0.825 30583 0.68 53
32 0.836 8724 0.25 15
33 0.836 34492 1.04 60
34 0.836 20299 0.61 35
35 0.836 47683 1.47 82
36 0.836 27093 0.78 47
37 0.836 12300 0.41 22
38 0.743 34490 0.07 60
39 0.743 178077 0.35 305
40 0.743 79856 0.16 137
41 0.743 153162 0.3 263
42 0.743 75187 0.15 129
43 0.743 85593 0.17 147
44 0.743 96517 0.19 166
45 0.743 192318 0.38 330
46 0.756 120790 0.41 207
47 0.756 22476 0.08 39
48 0.779 49445 0.4 85
49 0.779 15298 0.14 27
50 0.779 66704 0.55 115
51 0.779 38960 0.31 67
52 0.79 55944 0.64 96
53 0.79 106438 1.29 183
54 0.79 58068 0.69 100
55 0.79 40810 0.48 70
56 0.79 51615 0.6 89
57 0.79 21427 0.25 37
A. Fernàndez-Canteli et alii, Frattura ed Integrità Strutturale, 30 (2014) 327-339; DOI: 10.3221/IGF-ESIS.30.40 333 EXPERIMENTAL MINER NUMBER MINER NUMBER
(BASIC STRESS
BLOCK BASED)
0.08 0.118 0.07 0.074 0.08 0.083 0.14 0.137 0.13 0.143 0.15 0.149 0.14 0.164 0.20 0.250 0.22 0.280 0.25 0.264 0.25 0.301 0.15 0.159 0.22 0.232 0.16 0.168 0.18 0.204 0.17 0.181 0.19 0.215 0.25 0.252 0.19 0.204 0.08 0.118 EXPERIMENTAL MINER NUMBER MINER NUMBER
(BASIC STRESS
BLOCK BASED)
0.30 0.300 0.29 0.281 0.30 0.341 0.50 0.441 0.51 0.441 0.41 0.441 0.31 0.341 0.30 0.323 0.34 0.359 0.35 0.375 0.41 0.464 0.40 0.433 0.53 0.558 0.38 0.406 0.48 0.477 0.41 0.438 0.61 0.701 0.58 0.571 0.60 0.607 0.30 0.300 EXPERIMENTAL MINER NUMBER MINER NUMBER
(BASIC STRESS
BLOCK BASED)
0.60 0.577 0.55 0.586 0.64 0.655 0.68 0.779 0.69 0.682 0.75 0.852 0.78 0.942 0.93 0.940 0.58 0.795 1.04 1.028 1.11 1.142 0.86 0.932 1.04 1.202 0.83 1.050 1.12 1.070 1.29 1.248 1.38 1.342 1.47 1.643 1.64 1.581 0.60 0.577
Table 4: Comparison between the Miner numbers estimated using the basic stress block approach proposed in this work and those directly overtaken from Holmen (shown in increasing order).
THE PROBABILISTIC S-N FIELD
or the damage assessment of the variable loading test results when the Miner approach is applied, the fatigue Weibull regression model proposed by Castillo and Fernández-Canteli the derivation of which is extensively justified in [6]. The consideration of the compatibility condition between the lifetime and stress range distributions, see Fig. 4, besides other physical and statistical considerations, leads to a functional equation, the solution of which provides the following S-N field:
;
1 exp
log
log
;
log
log
,
N B C N B C N
F (1)
where B and C are, respectively, a limit or threshold number of cycles and fatigue limit for N→ ∞ and β, λ and δ are, respectively, the Weibull shape, location and scale parameters. The percentile curves are hyperbolas sharing the asymptotes log N =B and log =C (see Fig. 4), with the zero percentile curve representing the minimum possible required number of cycles to achieve failure for different values of log .
The model parameters can be determined with the free software program ProFatigue [9] in a two-step procedure: first B and C, then the Weibull parameters β, λ and δ using well-established methods described in the literature. As soon as the five parameters are estimated, the whole S-N field is analytically defined enabling a probabilistic prediction of the fatigue failure under constant amplitude loading to be achieved, see Fig. 5.
From Eq. (1) it is apparent that the probability of failure for an element subject to a stress range during N cycles depends only on the product V=( log N−B )(log −C). This illustrates that, as soon as B and C are known, V becomes a
A. Fernàndez-Canteli et alii, Frattura ed Integrità Strutturale, 30 (2014) 327-339; DOI: 10.3221/IGF-ESIS.30.40
334
normalizing variable of the data results permitting the whole experimental data set to be pooled in a single Weibull distribution with the same shape parameter β as they would pertain to a single sample. This statistical normalization proves to be a suitable and powerful procedure increasing the reliability of the parameter estimation, allowing the whole S-N field to be described by a unique Weibull distribution function.
Figure 4: S-N field according to [6] illustrating the compatibility condition.
This means that any V value is associated to a percentile curves but also to a damage stage that may be unequivocally related to a probability of failure. In this way, an extension of lifetime prediction under varying load is achieved by identifying damage with the V value, and the V value with the probability of failure represented by its cumulative distribution function.
Now, the approach proposed consists in deriving the cdf for the Miner number, as resulting from the S-N field found and the stress history applied. With this aim, simultaneous calculation of the normalized variable V and the corresponding Miner number M at any stage of the loading history makes it possible to relate any Miner number along the damage process to a probability of failure, i.e. mapping of the Miner number into a cumulative distribution function [7].
100 102 104 106 108 1010 0.55
0.6 0.65 0.7 0.75 0.8 0.85 0.9
0.95 Threshold lifetime Endurance limit Pf = 0% P
f = 5%
Pf = 50% P
f = 95%
Failure data Run-outs
Transformed run-outs
ESTIMATED PARAMETERS
B C β δ λ
0 -0.59 3.86 1.39 1.56
A. Fernàndez-Canteli et alii, Frattura ed Integrità Strutturale, 30 (2014) 327-339; DOI: 10.3221/IGF-ESIS.30.40
335
CALCULATION OF THE MINER NUMBER AND ITS PROBABILISTIC ANALYSIS ACCORDING TO THE APPROACH
PROPOSED
n this Section, the Miner numbers obtained in the experimental program of Holmen [4] are estimated for the concrete specimens subject to pseudo-random load using the load collective described in the precedent Section as being representative of the real load to which the concrete specimen is subjected during each test. In fact, three different test series, see Tab. 4, were performed with small differences among the stress collectives applied, the influence of which is disregarded. Thereafter, these Miner number results are related to the normalized variable V and, subsequently, to probability of failure. Finally, this theoretical Miner number distribution will be compared with that obtained directly from the experimental results.
Since the total number of cycles, but not the real pseudo-random loading sequence, applied during Holmen’s varying loading tests [4] is provided, only an estimation of the real loading history can be achieved as the number of replications of the basic stress block necessary to accomplish the total number of cycles. As a result, the value of the Miner number obtained for the different tests using the substitutive basic stress block appraisal differs from that given by Holmen, see Tab. 4, which displays the Miner numbers as directly overtaken from Holmen and those estimated by equating the total number of cycles resulting for repeated application of the basic stress block. A median error of about 10% is observed, which seems to be acceptable for this study as the calculated Miner numbers represents an underestimation of the real ones. A practical coincidence between both Miner number families may be enforced by adequately determination of the number of replications, with a possible fraction of the last replication, irrespective of the total number of cycles considered, i.e. alternative to the values contained in Tab. 3.
Once the Miner number resulting for any of the real experimental tests is found as a result of the application of the prescribed number of replications of the basic stress blocks, we proceed to establish the probability of failure associated with them. First, the S-N field is evaluated from the constant stress range tests using the ProFatigue code, see Fig. 5. This provides the model parameters and accordingly, the cdf of the normalizing variable V=(log N-B) (log -C) thus relating V values to probability of failure, see Fig. 6.
1.5 2 2.5 3 3.5 4 0
0.1 0.2 0.3 0.4 0.5 0.6 0.7 0.8 0.9 1
V = (ln N - B) (ln - C)
Pf
[ ]
%Smax [-] 0.68 0.75 0.82 0.9 0.95
Data without run-outs Run-outs
Figure 6: Experimental Weibull cumulative distribution functions for the normalized variable V obtained from the fatigue results under constant stress range tests of Holmen [4] using the probabilistic fatigue model of Castillo and Fernández-Canteli [6].
For each test, an experimental Miner number Mi has been obtained from the particular stress history “i” applied during the test consisting in a number of replications of the basic stress block according to Tab. 3. The same stress history provides the corresponding value of the normalized variable Vi for such a test, the probability of failure related to which is given by the cdf of the normalized variable V. In this way, the same probability of failure obtained for the Vi value is assigned to the corresponding value of the experimental Miner number Mi. Thus, an unequivocally correspondence
A. Fernàndez-Canteli et alii, Frattura ed Integrità Strutturale, 30 (2014) 327-339; DOI: 10.3221/IGF-ESIS.30.40
336
between the experimental V values and those of the Miner number M is established, allowing the cdf predicted for the experimental Miner results to be established by simple mapping of the Miner numbers obtained for the experimental test failures into probabilities of failure, see Fig. 7. Accordingly, an approach for probabilistic lifetime prediction is established by means of the normalized variable V that improves the reliability provided by the conventional Miner rule.
0 0.2 0.4 0.6 0.8 1 0 0.2 0.4 0.6 0.8 1
Probability of failure
P ro b a b il it y o f f a il ur e
2.2 2.4 2.6 2.8 3 3.2 3.4
0 0.2 0.4 0.6 0.8 1
V [normalized variable]
P ro b a b il it y o f f a il ur e
2.2 2.4 2.6 2.8 3 3.2 3.4
0
0.5
1
1.5
V [normalized variable]
Mine r num ber 0 0.2 0.4 0.6 0.8 1 0 0.5 1 1.5
Probability of failure
Mine
r num
ber
Figure 7: From the experimental Weibull cumulative distribution function for the normalized variable V (upper-right) and the established relation between V and M (down-right), the experimental cdf of the Miner number (down-left) is found for the fatigue of Holmen [5].
Now, the cumulative distribution function for the Miner number sample obtained from the results of the experimental program with varying stress range tests of Holmen is determined by applying any plotting point position rule. The Miner number values are ranged in increasing order and the corresponding probabilities of failure calculated. The resulting cdf is compared with that predicted from the normalized variable V distribution, as shown in Fig. 8.
0 0.5 1 1.5 2 2.5 3 3.5 4 0 0.1 0.2 0.3 0.4 0.5 0.6 0.7 0.8 0.9 1 Miner number P ro b a b il ty o f f a il u re
Fitting acording to Weibull: p=0.5 & Scale factor=1 Experimental data p=0.5
0 0.5 1 1.5 2
0 0.1 0.2 0.3 0.4 0.5 0.6 0.7 0.8 0.9 1 Miner number P robabi lt y of f a il ur e
Fitting acording to Weibull: p=0.5 & Scale factor=2.364 Experimental data p=0.5
A. Fernàndez-Canteli et alii, Frattura ed Integrità Strutturale, 30 (2014) 327-339; DOI: 10.3221/IGF-ESIS.30.40
337 Figure 8:a) Cumulative distribution functions for the Miner number fitted, respectively, from the experimental results and from the approach proposed based on the normalized variable V assuming a Weibull distribution and b) correspondence among those distributions when a scale correction is applied to the experimental results.
The precedent procedure is summarized as follows:
a) From Holmen’s results, the experimental probabilistic S-N field is evaluated, in this case, using the ProFatigue program based on the Weibull model proposed by Castillo and Fernández-Canteli [6].
b) The load collective is defined from standards or other regulations related to the particular type of the structure considered.
c) A histogram is derived from the stress collective in a sufficient number of stress steps to guarantee accurateness in the calculations. In this case, the results provided by Holmen [4] are considered. Possible truncation and omission of some levels of the histogram are undertaken in order to approximate the histogram to the practical load distribution.
d) Since the real load sequence applied to the specimens is unknown, though the peak distribution applied during the test is defined, an approximation is assumed by considering a proportional reduction of the original load collective. In this case, a basic loading block is defined as 1/750 times of the original load histogram.
e) The Miner number obtained for any of the real tests is calculated. Herewith, the factual pseudo-random load history applied by Holmen’s tests is not exactly known but can be approximated by means of the basic stress block derived from the load collective. A comparison is made between the Miner number calculated using repetitions of until the total number of cycles corresponds to that given by Holmen and the Miner number provided by Holmen. Differences aro und 10% are found these being considered acceptable.
f) For any test, the necessary repetitions of the basic stress block are evaluated as those giving the same total number of cycles to failure found by Holmen.
g) For any test, the normalized variable V= (log N-B) (log -C) is calculated for the test stress history up to failure owning to the particular Miner number obtained for that test by replications of the basic stress block.
h) Since the cdf for V is defined according to the probabilistic fatigue model, and the correspondence between V and the Miner number M is established, it is possible to derive the cdf for the Miner number values, that is, it is possible to relate any value of the Miner number to the corresponding probability of failure. The immediate relation of the Miner number and probability is established.
i) The cdf of the experimental Miner number is calculated and compared with the theoretical one. A simple correction of the scale parameter lead to good agreement for fatigue lifetime prediction.
DISCUSSION OF THE RESULTS
ig. 6 displays the cumulative distribution function corresponding to the experimental Miner numbers obtained from the test program of Holmen and the predicted cdf of the Miner number derived from the normalized variable V, which on its turn is calculated from the initial S-N field for constant stress range tests of Holmen. Since V belongs to a three parameter Weibull distribution family according to the probabilistic model of Castillo and Fernández-Canteli it is expected that the Miner number also belongs also to a three parameter Weibull family, as stated in [9], The location parameter of the M distribution λ(M), i.e. the threshold M value below which the probability of failure is zero, is defined as that value of M associated with the location parameter for V, λ(V). Account given of the small value of λ(M), nullity of λ(M)=0 can be accepted, which implies the Miner number being described by a two-parameter Weibull distribution. Under this assumption, the parameter estimates of both M distributions, i.e. the experimental and the theoretical ones, are, respectively, β=1.436, δ=0.568 for the experimental Miner number and β=1.515, δ=1.341 for the predicted one, i.e., for the theoretical one, confirming a reasonable coincidence between the shape parameters in both distributions but also with the shape parameter found for the S-N field. This allows us to assume “a priori” the value of the location parameter as known in the parameter estimation for the Miner number. On the contrary, a significant difference arises between both Miner scale parameters that, unfortunately stays on the unsafe side pointing out the necessity of introducing a correction if a safe lifetime prediction is intended. A scale parameter ratio δmod / δorig =2.364 is
found, which can be used supposed an arbitrary correction for the moment being, see Fig. 7. In such a case, a practical coincidence is achieved between both probability distributions, experimental and analytical. It follows that the consequence of applying the Miner rule, which evidently cannot be accepted as a scientific law to reproduce faithfully the damage process, may be corrected by assuming a size effect that requires extrapolation of the theoretical distribution, as
A. Fernàndez-Canteli et alii, Frattura ed Integrità Strutturale, 30 (2014) 327-339; DOI: 10.3221/IGF-ESIS.30.40
338
derived from the normalized variable, to a longer scale. The value of this correction must be checked for different materials and different load spectra so that further investigation is needed. Anyway, the modification of the scale parameter, being simple though not yet fully understood, opens a new way for predicting lifetime under pseudo-random varying loading. Assuming a Gumbel instead a Weibull distribution does not affect very much the calculations but obviates the question of the lower threshold value due to the existence of the Gumbel function practically from the first cycle. Other advantages, as reduction of the number of parameters and avoiding to accept nil probability of failure in legal cases, are also explained in [10].
MINER AS ALLEGED LINEAR CUMULATIVE DAMAGE HYPOTHESIS
he Miner number is generally accepted as representing a stage of damage resulting from a “linear” progression of damage accumulation. Nonetheless, the probabilistic conception of the S-N field permits us to reject this conventional cliché as being a gratuitous and wrong assertion. In fact, we have shown above how M can be related to probability of failure, as a measure of damage progression, by means of the normalized variable V considered in the fatigue approach proposed by Castillo and Fernández-Canteli [6] and the same can be achieved using as an alternative, in principle in better consonance to the real logarithmic scale characterizing lifetime problems, to the conventional the so called logarithmic Miner, denoted LM defined as:
LM= ∑ log ni / log Ni (2)
which according to a parallel interpretation as that applied in the case of the conventional Miner number would be labelled as “logarithmic cumulative damage hypothesis” and, expectantly, lead to a fully different lifetime prediction. After applying the same load spectra as in the Miner number case, totally different LM values are observed to those for conventional M, as expected. Notwithstanding, the same probabilities of failure are found for the reciprocal M and LM values in both cases. This proves that the probability of failure, as a measure of damage, happens to be independent of the model adopted (conventional or logarithmic Miner rule) if an adequate mapping of the measure of cumulative damage is adopted into the probability of failure is established, thus proving by extension, the inconsistency of the conventional belief, which denotes “linear” the damage progression for the conventional Miner number.
CONCLUSIONS
he main conclusions derived from the present work are:
- A probabilistic definition of the S-N field is necessary for the adequate probabilistic evaluation of the Miner number.
- A statistical interpretation of the Miner is possible, without practically maintaining the simplicity of its calculation in the conventional approach allowing an increase of reliability in the lifetime prediction of structural and mechanical components.
- The Miner number statistical distribution happens to be Weibull, as stated in former literature of the authors, whereas the prediction for the Miner number in a probabilistic way needs to be modified by introducing a scale correction.
- The statement that the Miner rule responds to a “linear cumulative damage hypothesis” is gratuitous and wrong. - Other fatigue programs under variable loading with other materials should be considered in order to confirm the
properties of the Miner distribution as exposed here.
REFERENCES
[1] Birnbaum, Z.W., Saunders, S.C., A probabilistic interpretation of Miner’s rule, SIAM J. of Applied Mathematics, 16 (3) (1968) 637-652.
[2] Van Leeuwen J., Siemes, A.J.M.., Miner’s rule with respect to plain concrete, Heron, Delft, 24(1) (1979).
[3] Van Leeuwen J., Siemes, A.J.M.., Fatigue of concrete, Report No B 76-443/04.2.6013, Tables, TNO-IBBC, Delft, (1977).
T
A. Fernàndez-Canteli et alii, Frattura ed Integrità Strutturale, 30 (2014) 327-339; DOI: 10.3221/IGF-ESIS.30.40
339
[4] Holmen, J.O., Fatigue of concrete by constant and variable amplitude loading, Institutt for Betongkonstruksjoner, Norges Tekniske Høgskole, Universitet i Trondheim (1979).
[5] Fernández-Canteli, A., Statistical interpretation of the Miner-number using an index of probability of total damage, Fatigue of Steel and Concrete Structures, IABSE, Zürich, (1982).
[6] Castillo , E., Fernández-Canteli, A., A unified statistical methodology for modeling fatigue damage, Springer, (2009). [7] Castillo, E., Fernández-Canteli, A., Statistical models for damage accumulation, Encyclopedia of Statistical Sciences,
John Wiley & Sons, Balakrishnan (Editor), Chapter 5, (2011) 1-30.
[8] Mc Call, J.T., Probability of failure of plain concrete, ACI Journal, 55 (1958) 233-244.
[9] ProFatigue. Software program for assessment of fatigue results, University of Oviedo. 2013. (Free download at dcif.uniovi.es/profatigue/ProFatigue_pkg.exe. User’s Guide: dcif.uniovi.es/profatigue/ProFatigue-UserGuide-2013.pdf).
![Figure 1: S-N field fitted with the Mc Call model [7] for the normalized fatigue results for concrete under compression from Holmen [4]](https://thumb-eu.123doks.com/thumbv2/123dok_br/18315724.349238/2.892.162.722.565.935/figure-fitted-normalized-fatigue-results-concrete-compression-holmen.webp)
![Figure 2: S-N field fitted with the Weibull model of Castillo-Canteli [6] for the normalized fatigue results for concrete under compression from Holmen [4]](https://thumb-eu.123doks.com/thumbv2/123dok_br/18315724.349238/3.892.175.715.306.679/figure-weibull-castillo-canteli-normalized-fatigue-concrete-compression.webp)
![Figure 3: Holmen’s load collectives from [4]: a) Original load histogram consisting in 30 stress steps and b) Loading model 3 with truncation of higher stress amplitudes and omission of lower stress amplitudes applied in the fatigue variable testing](https://thumb-eu.123doks.com/thumbv2/123dok_br/18315724.349238/4.892.129.764.252.956/collectives-original-histogram-consisting-truncation-amplitudes-omission-amplitudes.webp)

![Figure 5: Weibull S-N field with estimated parameters derived from Holmen’s constant stress range concrete tests using the probabilistic fatigue model from [6]](https://thumb-eu.123doks.com/thumbv2/123dok_br/18315724.349238/8.892.73.799.768.1069/figure-weibull-estimated-parameters-constant-concrete-probabilistic-fatigue.webp)
![Figure 6: Experimental Weibull cumulative distribution functions for the normalized variable V obtained from the fatigue results under constant stress range tests of Holmen [4] using the probabilistic fatigue model of Castillo and Fernández-Canteli [6]](https://thumb-eu.123doks.com/thumbv2/123dok_br/18315724.349238/9.892.245.642.672.973/experimental-cumulative-distribution-functions-normalized-probabilistic-castillo-fernández.webp)

