V. A. Ferraresi
Universidade Federal de Uberlândia Campus Santa Mônica 38400-902 Uberlândia, MG. Brazil [email protected]K. M. Figueiredo
Universidade de São Paulo – USP Escola de Engenharia de São Carlos Av. Trabalhador Sancarlense, 400, Centro 13560-970 São Carlos, SP. BrazilT. Hiap Ong
Universidade Federal de Uberlândia Campus Santa Mônica 38400-902 Uberlândia, MG. BrazilMetal Transfer in the Aluminum Gas
Metal Arc Welding
Among the aluminum welding processes, the GMAW (Gas Metal Arc Welding) process can be easily made automatic, has high productivity and great versatility regarding the type and thickness of material used in welding. The possibility of changing the transfer mode to adapt to different thickness, joint types, among other aspects, is another important and attractive feature. However, little is known about the transfer modes in aluminum GMAW process. For this reason, in this study an analysis of the metal transfer modes in the aluminum welding was made, and the objective was to generate maps that could identify the metal transfer modes and their regions in relation to the shielding gas and the wire diameter. The experimental procedure was the execution of weld on aluminum plate in a flat position with a constant voltage power source. The methodology used was laser Shadowgraphy combined with a high-speed movie camera. Therefore, it was possible to design the maps in which four metal transfer modes and their respective transition zones were determined. The maps also permit determination of the transition current zone between the globular and the spray mode, and modeling of the melting rate.
Keywords: Aluminum, GMAW process, metal transfer, transition current, melting rate
Introduction
Among the aluminum welding processes, the automated GMAW process has high productivity and great versatility regarding the material type and thickness in welding. However, this process exhibits a few difficulties, such as: higher sensibility to welding parameters variation demanding a rigorous regulation of these parameters in order to obtain an excellent quality of the weld bead (AWS, 1991).1
The mode that the droplet is transferred from the wire to the melting pool (known as metal transfer modes) is important in the GMAW process, since it determines the process stability and consequently the quality of the weld fillet (Norrish & Richardson, 1988). In a simple way, the current literature acknowledges three basic forms of metal transfer: short circuit, globular, and spray (AWS, 1991).
The short circuit metal transfer occurs in low voltage values and moderate welding current, and it is characterized by periodic contact of the drop with the melting pool, causing important instability in the welding voltage and current; this may present intense formation of spatters.
The globular metal transfer occurs with intermediary values of current and elevated welding voltage. During welding, the melting metal globule at the tip of the wire grows as time passes, until it detaches under the effect of gravity. This causes a deposition of large drops, much larger than the wire diameter, in the melting pool, occurring spatters.
The spray transfer mode occurs with high voltage and current, above a stripe named transition current (current stripe between globular and spray mode). The drops are small, close to the wire diameter size, which are thrown in high frequency into the melting pool. This mode presents good process stability, and a good aspect of the weld bead with very few spatters ((Norrish & Richardson, 1988 and AWS, 1991).
The knowledge of the transition current zone between the globular and spray mode has great importance in the GMAW process, because it determines the working conditions of the process. The globular mode has limited applications, since it can
Paper accepted July, 2003. Technical Editor: Alisson Rocha Machado.
cause lack of fusion, insufficient penetration, excessive reinforcement, and high amount of spatter in the weld bead (Norrish & Richardson, 1988). On the other hand, the spray mode generates excellent quality and high deposition rate at the weld bead, but it needs high welding energy (high current), and its application is indicated for thick plates. Another relevant factor in the knowledge of the transition current zone is its utilization in pulsed arc transfer, also known as controlled transfer (AWS, 1991).
An important factor in welding is the relation between the wire consumption (melting rate) and the welding current because, with the desired wire consumption together with the joint geometry, the necessary amount of steps to fill the joint can be calculated. Thus, predicting the work current and, consequently, the wire feed speed, will help the source adjustment. Experimentally, the principal factors that influence the wire consumption are the generated heat in the wire, through the Joule effect, and its wire-arc connection (cathodic region) (Quites & Dutra, 1979). Lesnewich (1958) proposes the equation below for the melting rate (MR).
2
I . l. I .
MR=α +β (1).
In which
l
is the wire length,I
is the current, and the constantα characterizes the reactions that occur in the wire-arc connection in function of the shielding gas type, wire type, and current polarity. As for the constant β, it is related to wire voltage drop, representing the Joule effect and is, therefore, influenced by the wire characteristics, i.e., by the diameter, length, and material. The α and
β constants are determined experimentally.
The aim of this paper is to map the metal transfer modes in aluminum GMAW welding, varying the shielding gas type and the wire diameter. Furthermore, the globular/spray transition current range and the α and β constants of the consumption equation were determined to verify the influence of the welding parameters (shielding gas and wire diameter) on consumption and transition current.
Experimental Procedure
the current) were carried out. The 15 l/min gas flux, the 15 mm contact tip to work distance, and the 100 torch slope in the forehand technique were maintained constant.
The test specimens were made from aluminum plate of AA 5052 (Al-Mg alloy) and ¼” (6.35 mm) thick. AWS ER-4043 (Al-Si alloy) wires with 1.0 mm and 1.2 mm diameter were used as filler metal. For the 1.0 mm diameter wire, tests were made using pure argon (Ar) gas and a mixture of argon (Ar) with 25% of helium (He), and for the 1.2 mm wire, only pure argon gas was used.
A laser Shadowgraphy combined with a high speed movie camera (2000 frames/s) system was utilized to determine the diameter, frequency, and the transfer mode of the drops (Figueiredo & Ferraresi, 2000). During welding, current and voltage acquisition was also carried out.
Results And Discussions
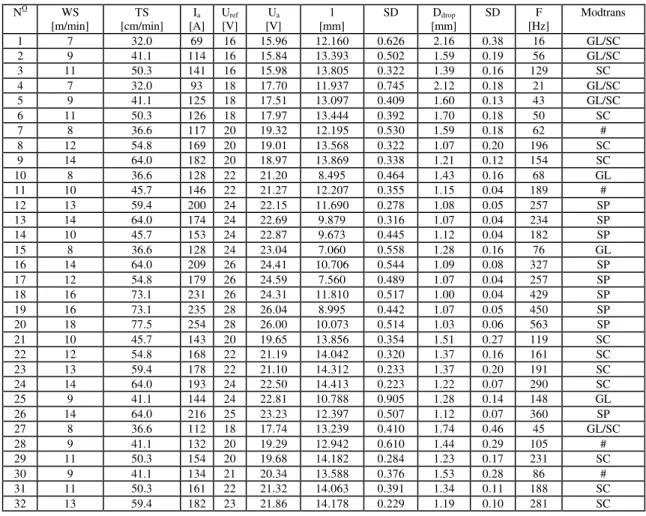
The experiments accomplished and their results are presented in Tables 1, 2, and 3, where: NO is experiment number; WS is wire feed speed; TS is travel speed; Ia is average current; Uref is reference
voltage; Ua is average voltage; l is wire length; SD is standard
deviation; Ddrop is average drop diameter; F is droplet deposition
frequency; Modtrans is metal transfer mode; SC is short circuit; GL is globular; SP is spray; GL/SC is globular/short circuit; and # indicates that in this test transfers, with combined modes, occurred in a random mode, i.e, they were not stable and there was an interchanging random combination among the transfer modes.
Through analysis of the images and the voltage and current values acquired during the welding, it was possible to detect 4 (four) metal transfer modes, also indicated in the tables: Short Circuit
(SC), Globular (GL), Spray (SP), and Globular/Short Circuit (GL/SC).
In the short circuit transfer mode, a high instability of the metal transfer was verified, and most of the time, a drop repulsion before the final transfer, was observed, causing high oscillations in the welding current and voltage. Figure 1 shows a photo sequence of this transfer mode showing the drop repulsion at the moment of transfer. The time lapse between frames is 0.5ms (for example, the time lapse between SC080 and SC090 is 5ms).
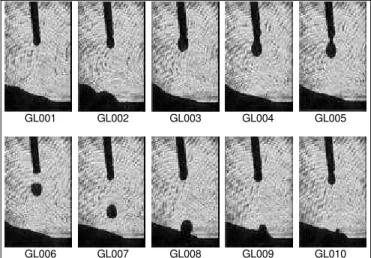
According to literature (Norrish & Richardson, 1988; AWS, 1991), in the globular transfer mode, the drop diameter is larger than the wire diameter. Because a minimum size of the drop is not specified to determine the transition between the globular and spray mode, and based on the observation of the metal transfer recorded, it was accepted that the globular mode occurs with drops having average diameter 15% above the wire diameter. Therefore, the drops with average diameter smaller than this values were considered as spray transfer mode. In spray transfer mode, drops with average diameter smaller than the wire diameter were not obtained. Figure 2 shows the sequence of photos of globular transfer and Figure 3 that of spray transfer.
Scotti et. al. (1999) explained that in globular/short circuit transfer mode, the drop has globular formation, and that it ends its transfer with short circuit. This behavior was also observed in the present study. After an exaggerated growth of the drop, which causes its contact with the melting pool and, thus, it transfers to the weld pool. Figure 4 shows a sequence of photos with this transfer mode.
Table 1. Results of the tests with argon gas and 1.0 mm diameter wire.
NO WS
[m/min]
TS [cm/min]
Ia
[A] Uref
[V] Ua
[V]
l [mm]
SD Ddrop
[mm]
SD F
[Hz]
Modtrans
1 7 32.0 69 16 15.96 12.160 0.626 2.16 0.38 16 GL/SC
2 9 41.1 114 16 15.84 13.393 0.502 1.59 0.19 56 GL/SC
3 11 50.3 141 16 15.98 13.805 0.322 1.39 0.16 129 SC
4 7 32.0 93 18 17.70 11.937 0.745 2.12 0.18 21 GL/SC
5 9 41.1 125 18 17.51 13.097 0.409 1.60 0.13 43 GL/SC
6 11 50.3 126 18 17.97 13.444 0.392 1.70 0.18 50 SC
7 8 36.6 117 20 19.32 12.195 0.530 1.59 0.18 62 #
8 12 54.8 169 20 19.01 13.568 0.322 1.07 0.20 196 SC
9 14 64.0 182 20 18.97 13.869 0.338 1.21 0.12 154 SC
10 8 36.6 128 22 21.20 8.495 0.464 1.43 0.16 68 GL
11 10 45.7 146 22 21.27 12.207 0.355 1.15 0.04 189 #
12 13 59.4 200 24 22.15 11.690 0.278 1.08 0.05 257 SP
13 14 64.0 174 24 22.69 9.879 0.316 1.07 0.04 234 SP
14 10 45.7 153 24 22.87 9.673 0.445 1.12 0.04 182 SP
15 8 36.6 128 24 23.04 7.060 0.558 1.28 0.16 76 GL
16 14 64.0 209 26 24.41 10.706 0.544 1.09 0.08 327 SP
17 12 54.8 179 26 24.59 7.560 0.489 1.07 0.04 257 SP
18 16 73.1 231 26 24.31 11.810 0.517 1.00 0.04 429 SP
19 16 73.1 235 28 26.04 8.995 0.442 1.07 0.05 450 SP
20 18 77.5 254 28 26.00 10.073 0.514 1.03 0.06 563 SP
21 10 45.7 143 20 19.65 13.856 0.354 1.51 0.27 119 SC
22 12 54.8 168 22 21.19 14.042 0.320 1.37 0.16 161 SC
23 13 59.4 178 22 21.10 14.312 0.233 1.37 0.20 191 SC
24 14 64.0 193 24 22.50 14.413 0.223 1.22 0.07 290 SC
25 9 41.1 144 24 22.81 10.788 0.905 1.28 0.14 148 GL
26 14 64.0 216 25 23.23 12.397 0.507 1.12 0.07 360 SP
27 8 36.6 112 18 17.74 13.239 0.410 1.74 0.46 45 GL/SC
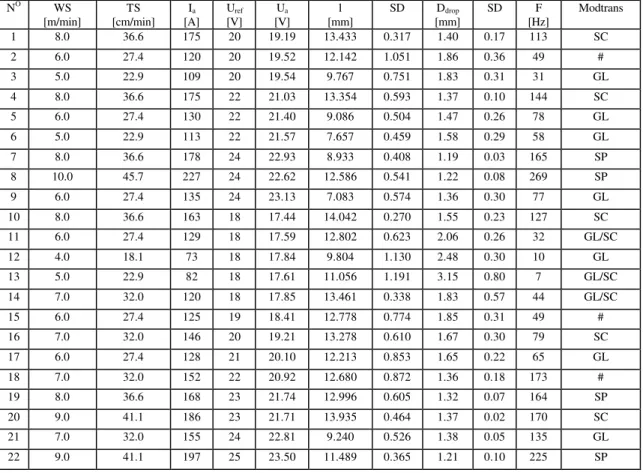
Table 2. Results of the tests with mixture Ar + 25% He and 1.0 mm diameter wire.
NO WS
[m/min]
TS [cm/min]
Ia
[A] Uref
[V] Ua
[V]
l [mm]
SD Ddrop
[mm]
SD F
[Hz]
Modtrans
1 12.0 54.8 137 20 19.51 13.777 0.274 1.23 0.26 228 SC
2 8.0 36.6 112 20 19.38 10.091 1.996 1.78 0.39 35 GL
3 10.0 45.7 141 22 21.30 12.630 0.687 1.27 0.16 250 #
4 8.0 36.6 93 22 21.43 9.430 1.149 1.75 0.19 35 GL
5 7.0 32.0 92 22 21.32 10.776 0.983 1.63 0.21 60 GL
6 12.0 54.8 164 24 22.90 11.471 0.553 1.10 0.03 237 SP
7 10.0 45.7 144 26 24.94 9.051 0.682 1.24 0.12 128 GL
8 12.0 54.8 166 26 24.84 8.852 0.589 1.20 0.17 196 #
9 14.0 64.0 182 26 24.66 10.094 0.874 1.02 0.06 346 SP
10 16.0 73.1 187 26 24.58 10.528 0.725 1.09 0.04 243 SP
11 16.0 73.1 208 28 26.35 9.839 0.894 1.03 0.06 400 SP
12 14.0 64.0 197 28 26.45 8.964 0.924 1.04 0.05 321 SP
13 18.0 77.5 221 28 26.28 9.650 0.562 0.99 0.07 409 SP
14 12.0 54.8 156 28 26.64 5.388 0.562 1.18 0.04 200 GL
15 6.0 27.4 58 20 19.85 11.382 1.190 2.91 0.44 8 GL/SC
16 12.0 54.8 147 22 21.19 13.149 0.453 1.28 0.06 130 #
17 14.0 64.0 174 24 22.77 11.883 0.544 1.08 0.03 225 SP
18 10.0 45.7 134 24 23.01 11.970 0.797 1.18 0.04 145 GL
Table 3. Results of the tests with argon gas and 1.2 mm diameter wire.
NO WS
[m/min]
TS [cm/min]
Ia
[A] Uref
[V] Ua
[V]
l [mm]
SD Ddrop
[mm]
SD F
[Hz]
Modtrans
1 8.0 36.6 175 20 19.19 13.433 0.317 1.40 0.17 113 SC
2 6.0 27.4 120 20 19.52 12.142 1.051 1.86 0.36 49 #
3 5.0 22.9 109 20 19.54 9.767 0.751 1.83 0.31 31 GL
4 8.0 36.6 175 22 21.03 13.354 0.593 1.37 0.10 144 SC
5 6.0 27.4 130 22 21.40 9.086 0.504 1.47 0.26 78 GL
6 5.0 22.9 113 22 21.57 7.657 0.459 1.58 0.29 58 GL
7 8.0 36.6 178 24 22.93 8.933 0.408 1.19 0.03 165 SP
8 10.0 45.7 227 24 22.62 12.586 0.541 1.22 0.08 269 SP
9 6.0 27.4 135 24 23.13 7.083 0.574 1.36 0.30 77 GL
10 8.0 36.6 163 18 17.44 14.042 0.270 1.55 0.23 127 SC
11 6.0 27.4 129 18 17.59 12.802 0.623 2.06 0.26 32 GL/SC
12 4.0 18.1 73 18 17.84 9.804 1.130 2.48 0.30 10 GL
13 5.0 22.9 82 18 17.61 11.056 1.191 3.15 0.80 7 GL/SC
14 7.0 32.0 120 18 17.85 13.461 0.338 1.83 0.57 44 GL/SC
15 6.0 27.4 125 19 18.41 12.778 0.774 1.85 0.31 49 #
16 7.0 32.0 146 20 19.21 13.278 0.610 1.67 0.30 79 SC
17 6.0 27.4 128 21 20.10 12.213 0.853 1.65 0.22 65 GL
18 7.0 32.0 152 22 20.92 12.680 0.872 1.36 0.18 173 #
19 8.0 36.6 168 23 21.74 12.996 0.605 1.32 0.07 164 SP
20 9.0 41.1 186 23 21.71 13.935 0.464 1.37 0.02 170 SC
21 7.0 32.0 155 24 22.81 9.240 0.526 1.38 0.05 135 GL
SC080 SC090 SC100 SC105 SC110 SC115
SC120 SC125 SC130 SC135 SC140 SC145
Figure 1. Figure of a short circuit transfer (test 3 of Table 1).
GL001 GL002 GL003 GL004 GL005
GL006 GL007 GL008 GL009 GL010
Figure 2. Photo sequence of a transfer in the globular mode (test 10 of Table 1).
SP001 SP002 SP003 SP004
SP005 SP006 SP007 SP008
Figure 3. Photo sequence of a spray transfer (test 19 of Table 1).
GLCC001 GLCC002 GLCC003 GLCC004 GLCC005 GLCC006
GLCC007 GLCC008 GLCC009 GLCC010 GLCC011
Figure 4. Photo sequence of transfer in the globular/short circuit mode (test 1 of Table 1).
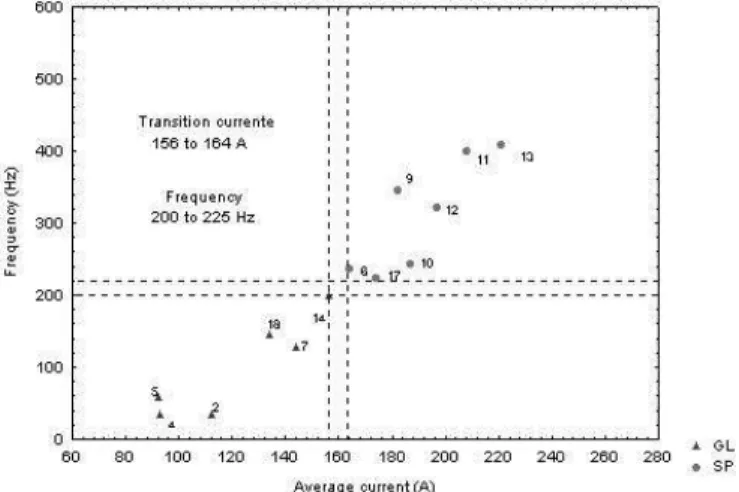
Figures 5, 6, and 7 show the graphs of metal transfer frequency and welding average current for the tests of Tables 1, 2, and 3 which presented both globular and spray modes. For the tests with pure Ar and 1.0 mm diameter wire, the transition current was between 144 and 153 A (Figure 5). With the mixture Ar + 25% He and 1.0 mm diameter wire, this current was between 156 and 164 A (Figure 6), showing an increase compared to pure Ar. This increase is, probably, related to the change in thermal conductivity and the ionization potential of the shielding gas. For the tests with 1.2 mm wire and pure Ar, the transition current was between 155 and 168 A (Figure 7); showing that there was a growth of the current, compared to the tests with 1.0 mm wire. The increase in the transition zone current can be explained by the need of a higher current density, so that the arc may reach the necessary temperature for the occurrence of wire melting.
It is important to observe in Figures 5, 6, and 7 that it is not possible to note an abrupt increase in the frequency of the transition zone current between globular to spray mode, as is sometimes suggested in current literature (AWS, 1991). The transition zone current can be determined using the frequency increase with the welding current. This same observation was verified in the Scotti et. al. (1999) studies with stainless steel.
Figure 6. Average welding current against metal transfer frequency, for welding with gas mixture (Ar + 25% He) and 1.0 mm wire.
Figure 7. Average welding current against metal transfer frequency, for welding with pure Ar and 1.2 mm wire.
Figures 8, 9, and 10 show maps of the reference voltage and wire feed speed used in the tests. The regions II and I are areas in which it was impossible to accomplish tests due to burning of the contact tip and the instability of the welding process, respectively. Based on the experimental points, the limits between the regions of different modes were outlined for better visualization.
Comparing Figure 8 with Figure 9, which show the change from pure Ar to Ar + 25% He, a displacement of the globular transfer mode zone can be verified, to higher wire feed speeds as well as welding average voltage. In the spray mode it was observed only a displacement of the region to higher wire feed speed without modifying the welding average voltage. These differences between the results are probably related to the fact that the ionization potential and thermal conductivity are higher in the mixture Ar + 25% He.
Comparing Figure 8 with Figure 10 which shows a change from 1.0 mm diameter to 1.2 mm diameter in the wire, a sensible increase in the globular transfer mode zone can be verified, that is to say, it reaches a higher wire feed speed zone (welding current) within the transfer map. In the other transfer modes, the changes of the regions were not very significant.
SC GL SP GL e SP GL/SC GL e GL-SC
Wire feed speed (m/min)
Reference voltage (V)
14 16 18 20 22 24 26 28 30
6 8 10 12 14 16 18 20
1 2 3
4 5 6
7 8 9
10 11 12 13 14 15 16 17 18 19 20 21 22 23 24 25 26 27 28 29 30 31 32 SP SC GL GL/SC I II
Figure 8. Map of the reference voltage and wire feed speed using 1.0 mm wire and pure Ar.
SC GL SP
GL e SC GL e SP GL/SC GL; SC e SP
Wire feed speed (m/min)
Reference voltage (V)
19 21 23 25 27 29
4 6 8 10 12 14 16 18 20
1 16 8 15 3 2 4 5 18 7 14 6 9 10 11 12 13 17 SC GL SP
GL e SC GL e SP
GL/SC
GL, SC e SP
I
II
Figure 9. Map of the reference voltage and wire feed speed using 1.0 mm wire and gas mixture (Ar + 25% He).
SC GL SP GL e SP GL/SC GL e GL-SC
Wire feed speed (m/min)
Reference voltage (V)
17 18 19 20 21 22 23 24 25 26
3 4 5 6 7 8 9 10 11
3 5 6 9 12 17 21 11 13 14 2 15 1 4 10 16 20 7 8 19 22 18 SC GL SP
GL e SP
GL/SC
I
II
GL e GL-SC
Figure 10. Map of the reference voltage and wire feed speed using 1.2 mm wire and pure Ar.
To predict the wire feed speed and, consequently, the wire consumption, the melting rate equation (Equation 1) was used. The
α and β constants were determined using the data presented in Tables 1, 2, and 3, and a statistical program (nonlinear regression – Quasi-Newton estimation method). The values related to α and β are presented in Table 4.
intuition or theory when one or more of the regression coefficients seems to have the “wrong” sign. Reasons for this can be: the small range of the regressions, no inclusion of an important factor in the model and the presence of multicollinearity. Due to this observation, the β value equal zero was adopted for the case of negative value.
Table 4. Values of the αα and ββ constants.
Gas type Wire diameter
[mm] [kg.hα-1.A-1] [kg.m-1β.h-1.A-2]
Ar 1.0 3.46x10⁻² 4.27x10⁻⁴
Ar + 25%He 1.0 3.68x10⁻² 1.56x10⁻³
Ar 1.2 3.61x10⁻² -8.79x10⁻⁴
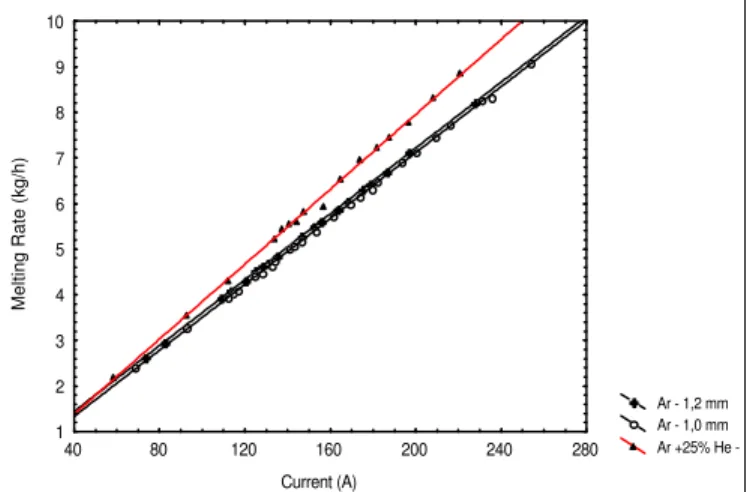
Figure 11 shows the melting rate in kg/h with the welding current. It can be observed that the test consumption with the mixture Ar + 25% He is highest, whereas with pure argon, the melting rate is practically constant for both 1.0 mm wire and 1.2 mm wire. Such fact can be explained by the higher ionization potential of the mixture Ar + 25% He, thus generating a hotter arc and higher temperatures. In the case of Ar gas the 1.2 mm wire, should theoretically present a smaller melting rate than the 1.0 mm wire for given current values, due to a smaller current density (higher diameter). However this was not significant in the results of this study.
Ar - 1,2 mm Ar - 1,0 mm Ar +25% He - 1,0 mm
Current (A)
Melting Rate (kg/h)
1 2 3 4 5 6 7 8 9 10
40 80 120 160 200 240 280
Figure 11. Graph of the melting rate against current.
Conclusions
Four major metal transfer modes were found in GMAW aluminum welding. They are: short circuit, globular, spray, and globular/short circuit.
In the spray transfer mode it was not possible to obtain drops with average diameter smaller than the wire diameter, for the test conditions analyzed in this study.
Regarding the change of the shielding gas from pure argon to argon with 25% of helium, the following changes can be observed: the globular transfer zone increased with the wire feed speed (welding current), and with the welding average voltage. In the spray mode, only a shift of the region to higher wire feed speed (welding current) occurred without increase in the welding average voltage. Another factor observed was the elevation in the globular/spray transition current and frequency.
Increasing the wire diameter from 1.0 mm to 1.2 mm, an enlargement in the region of the globular transfer mode occurred. Other factors also observed were an increase of the globular/spray transition current, and a decrease in the transition frequency.
The melting rate increases significantly when changing from Ar to Ar + 25%He. The effect of wire diameter on the melting rate is less significant.
Acknowledgments
The authors would like to acknowledge the FAPEMIG and PADCT III – CEMAT for their financial support, and White Martins for supplying the gases.
References
AWS, 1991, Welding Handbook, Welding Processes, American Welding Society, vol. 2, 8. Ed., USA.
Figueiredo, K.M. & Ferraresi, V.A., 2000, “Influência do tipo de gás de proteção nos modos de transferência metálica na soldagem MIG de alumínio”, In: Annals of the XXVI Congresso Nacional de Soldagem, September 03 to 06, Curitiba, Paraná, Brazil [in portuguese].
Lesnewich, A., 1958, “Control of Melting Rate and Metal Transfer in Gas Shielded Metal-Arc Welding: Part I – Control of Electrode Melting Rate”, Welding Journal, August, pp. 343s-353s.
Norrish, J. & Richardson, I.F., 1988, “Back to Basics: Metal Transfer Mechanisms”, Welding & Metal Fabrication, jan.-feb., pp. 17-22.
Quites, A.M. & Dutra, J.C., 1979, “Tecnologia da Soldagem a Arco Voltaico”, EDEME, Florianópolis, Santa Catarina, Brazil [in portuguese].
Scotti, A., Clark, D.E. & Kenney, K., 1999, “Mapeamento da Transferência Metálica em MIG com Aço Inoxidável”, In: Annals of the VI Seminário Brasileiro do Aço Inoxidável, May 04 and 05, São Paulo, Brazil [in portuguese].
Scotti, A., 1991, “Process Modeling to Establish Control Algorithms for Automated GMAW”, PhD Thesis, Cranfield Institute of Technology, School of Industrial and Manufacturing Science, September.