Short Report
Printed in Brazil - ©2016 Sociedade Brasileira de Química0103 - 5053 $6.00+0.00
*e-mail: [email protected]
Exploring the Versatility of an Atomic Absorption Spectrometer: Application to
Direct Molecular Determination of Caffeine and Propranolol
Bruno L. Ferreira,a Luciano Vitalib and Eduardo S. Chaves*,a
aUniversidade Tecnológica Federal do Paraná, Campus de Ponta Grossa, 84016-210 Ponta Grossa-PR, Brazil
bUniversidade Federal de Santa Catarina, Trindade, 88040-970 Florianópolis-SC, Brazil
A simple strategy using an atomic absorption spectrometer (AAS) for the direct determination of molecular compounds is proposed. The determination of caffeine and propranolol employing atomic absorption instrumentation was conducted, monitoring the emission lines of Fe (271.9 nm) and Mg (285.2 nm), respectively, using a quartz cuvette (1.0 cm) positioned in the burner head. Samples or standards were inserted into the cuvette in order to obtain the absorbance measurements. The parameters of merit were evaluated and the limits of detection were 0.46 and 0.56 mg L-1
for caffeine and propranolol, respectively, with a coefficient of determination R2 > 0.999. The
methods developed were applied to the determination of caffeine and propranolol in real samples of beverages and pharmaceutical formulations, respectively. To evaluate the accuracy of the proposed methodologies the results obtained by atomic absorption spectrometer were compared with those obtained by molecular absorption spectrophotometry (UV-Vis) and high performance liquid chromatography (HPLC) or capillary electrophoresis (CE).
Keywords: direct molecular determination, atomic absorption spectrometer, caffeine, propranolol
Introduction
In recent years the molecular absorption spectrometry (MAS) technique has been significantly improved with the use of high-resolution continuum source atomic absorption spectrometry (HR-CS-AAS) employing flame or furnace systems.1 MAS has been mainly applied for the
determination of non-metals, since these elements cannot normally be determined using conventional line source atomic spectrometers.2-5 Some examples of the application
of MAS using HR-CS-AAS are the determination of chlorine in biological tissues,6 bromide in aqueous solutions and
organic solvents,7 sulfur in coal,8 and nitrite and nitrate in
groundwater.9 However, a conventional atomic absorption
spectrometer can also be employed using a line source for molecular measurements, as proposed by Gomes et al.10
for chromate and dichromate measurements monitoring the emission lines of Al (396.1 nm) and V (437.9 nm), respectively. The same principle could be applied to the direct determination of different organic molecules, such as caffeine and propranolol, which would broaden the range of applications of the conventional AAS instrument through the
exploitation of its versatility. One advantage of this strategy would be the easy and simple use of the optical system of the AAS instrument for this purpose.
The compounds caffeine and propranolol are present in different beverages and pharmaceutical formulations and are generally analyzed by high performance liquid chromatography (HPLC), capillary electrophoresis (CE), gas chromatography with mass spectrometry detection (GC-MS), molecular absorption spectrophotometry (UV-Vis), and potentiometric and conductometric titrations.11-13 The specificity of these techniques has been
demonstrated, which is advantageous in terms of precision and selectivity. According to reports in the literature, propranolol has been analyzed by AAS using an indirect method.14 The indirect determination of propranolol
concentrations has been performed after chelation with CuII
ions, which were subsequently determined by flame atomic absorption spectrometry (FAAS) and the corresponding propranolol concentration was subsequently calculated.9
The measurements were taken using a quartz cuvette positioned on the head burner and monitoring the emission lines of Fe (271.9 nm) and Mg (285.2 nm). The results were compared with those obtained by UV-Vis, CE and HPLC analysis.
Experimental
Instrumentation
The measurements were taken on a Shimadzu atomic absorption spectrometer (model AA-6200) using hollow cathode lamps for iron and magnesium and a spectral slit width of 0.7 nm. The measurements by the AAS instrument were performed without background correction. The determination of caffeine and propranolol was carried out monitoring the emission lines of Fe (271.9 nm) and Mg (285.2 nm), respectively, using a 1.0 cm quartz cuvette. The UV-Vis analysis was conducted on a FEMTO UV-Vis spectrometer (model 800XI), using a 1.0 cm quartz cuvette. Caffeine concentrations were also determined by HPLC (YL 9100 HPLC system), using a Phenomenex C18 column (150 × 4.60 mm, 5 µm) equipped with a C18 precolumn (4.6 × 10 mm), and the propranolol concentrations were determined on a CE system (7100 Capillary Electrophoresis System, Agilent Technologies) equipped with a diode array detector set at 214 nm.
Reagents and samples
All reagents were at least of analytical grade. Ultra-pure water deionized with a resistivity of 18.2 MΩ cm was obtained in a GEHAKA Master All 2000 system for AAS, UV-Vis and HPLC measurements and in a Milli-Q system (Millipore) for CE analysis. Standards of 99% caffeine (Vetec) and 99% propranolol (Galeno) were used. Dichloromethane (Proquímios) was used for the caffeine extraction prior to the AAS and UV-Vis measurements. Ethanol (Dinâmica) and methanol (Proquímios) solutions (25% v/v) were used to dissolve the caffeine and propranolol, respectively. The caffeine contents of samples of soluble coffee, an energetic drink and cola were determined. In the case of propranolol the analysis was carried out on different samples in tablet form (10, 40 and 80 mg). Samples were obtained in local stores as single lots.
Procedures
Caffeine
An aliquot of 0.2 g of soluble coffee was weighed and dissolved in hot water (80 ± 2 oC) and the volume
was then completed to 50 mL. The gas content of the liquid samples was removed by agitation and the caffeine content was extracted directly as follows. Aliquots (2 mL) of the soluble coffee solution, cola and energetic drink were pipetted, alkalinized with the addition of 100 µL of a 10% (m/v) NaOH solution and the caffeine content was extracted with 5 mL of dichloromethane. From the extract, an aliquot (2 mL) was collected using a pipette and the dichloromethane was evaporated in a film hood. The extracted caffeine was then dissolved in 20 mL of 25% (v/v) ethanol solution. The analysis was performed at 272 nm for the UV-Vis spectroscopy and 271.9 nm for the AAS, monitoring the Fe emission line. For the calibration, the caffeine standards, at different concentrations, were dissolved in 25% (v/v) ethanol solution and analyzed by AAS and UV-Vis. For the HPLC measurements the soluble coffee solution, cola and energetic drink were appropriately diluted and directly analyzed. The calibration was performed using caffeine standards prepared in the mobile phase medium (25% v/v methanol and 75% v/v ultra-pure water).15,16
Propranolol
Ten tablets of each sample were individually weighed, to obtain the average mass of each tablet, and then homogenized in a porcelain mortar. For the AAS and UV-Vis analysis an aliquot of 0.01 to 0.02 g of the homogenized sample was weighed out and then dissolved in 20 mL of a 25% (v/v) methanol solution. The analysis was performed by UV-Vis at 285 nm and in AAS at 285.2 nm, monitoring the Mg emission line. In the calibration procedure for the propranolol determination, standards at different concentrations were dissolved in methanol 25% (v/v) solution and analyzed by AAS and UV-Vis spectroscopy. For the CE analysis an appropriate aliquot of each propranolol sample was dissolved in 100 mL of ultra-pure water and then analyzed. For the calibration, standards were prepared by dissolving propranolol hydrochloride in ultra-pure water. Benzylamine at 12.5 mg L-1 was used as
the internal standard (IS). The other CE conditions were exactly as described by Micke et al.17
Results and Discussion
Method for direct determination of caffeine and propranolol using atomic absorption spectrometer
AAS was used to measure the absorption. The sample or standard solutions were placed in the cuvette for analysis.
For the caffeine and propranolol determination by AAS the maximum absorption wavelength of each molecule was initially determined by UV-Vis. In the next step, an analytical line of the HCL lamp was found to be coincident with the maximum absorption wavelength for caffeine (272 nm) and propranolol (285 nm). Numerous analytical lines of different sensitivity are available for atomic absorption spectrometry determinations and the lines of Fe (271.9 nm) and Mg (285.2 nm)18 were, respectively,
selected for the caffeine and propranolol determination.
Parameters of merit
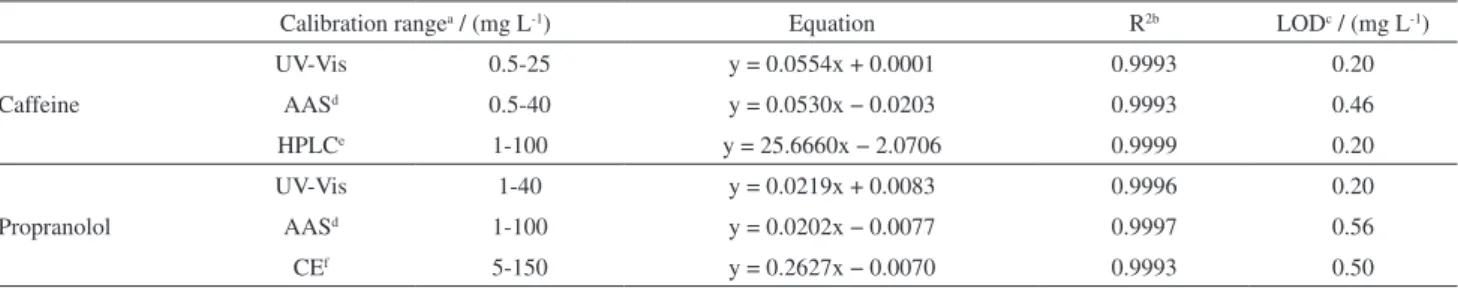
The parameters of merit obtained for the determination of caffeine and propranolol, using the four different instrumental setups (AAS, UV-Vis, HPLC and CE) are summarized in Table 1. For caffeine, the widest calibration range was achieved using HPLC, since this is a separation technique which allows a significant reduction in potential interferences. However, the use of AAS showed an improvement of 60% in the calibration range when compared to the UV-Vis technique. A similar behavior was obtained for the propranolol analysis, the AAS and UV-Vis techniques showing similar sensitivity. With the use of AAS a 150% improvement in the calibration range was achieved
when compared with UV-Vis and the widest range was obtained by CE. Monochromatic radiation is one of the most important parameters in terms of the applicability of the Lambert-Beer law,18 consequently, the improvement
observed in the calibration range on using AAS is due to the narrow beam, with more specific radiation passing through the sample cuvette.
The obtained correlation coefficients values were higher than 0.999 for all the evaluated techniques, demonstrating a good linearity. The sensitivity and the limits of detection (LOD) obtained in the determination of caffeine using different techniques were compared and the LOD values for the AAS and UV-Vis were at least three times better than the value obtained in the HPLC analysis. In the case of the propranolol measurements, the LOD values obtained for AAS and CE were very similar and three times lower than that for UV-Vis. In addition, the LOD values obtained for AAS applying the proposed analysis are comparable with those reported in the literature for caffeine and propranolol using different analytical techniques.17,19-22
Sample analysis
Caffeine determination
The caffeine concentrations of three different samples were determined by AAS, UV-Vis and HPLC. One solid sample (soluble coffee) and two liquid samples (cola and energetic drink) were selected for analysis and the results for the caffeine concentrations obtained using the different analytical techniques are shown in Table 2. The measurement precision was evaluated by means of the relative standard deviation (RSD) and ranged from 0.7 to 10%. For the AAS measurements the values obtained were comparable with those obtained by UV-Vis and HPLC. Moreover, using AAS the RSD values were lower than 6.9%, indicating that good precision is obtained with this technique when applied to the determination of caffeine concentrations.
Figure 1. Illustration of the system used for determination of caffeine at 271.9 nm and propranolol at 285.2 nm on an atomic absorption spectrometer using Fe and Mg hollow cathode lamps, respectively.
Table 1. Parameters of merit for caffeine and propranolol determination using an atomic absorption spectrometer (AAS), UV-Vis, HPLC and CE
Calibration rangea / (mg L-1) Equation R2b LODc / (mg L-1)
Caffeine
UV-Vis 0.5-25 y = 0.0554x + 0.0001 0.9993 0.20
AASd 0.5-40 y = 0.0530x − 0.0203 0.9993 0.46
HPLCe 1-100 y = 25.6660x − 2.0706 0.9999 0.20
Propranolol
UV-Vis 1-40 y = 0.0219x + 0.0083 0.9996 0.20
AASd 1-100 y = 0.0202x − 0.0077 0.9997 0.56
CEf 5-150 y = 0.2627x − 0.0070 0.9993 0.50
aAt least seven concentrations of calibration standards were used; bR2: coefficient of determination; cLOD: limit of detection; dAAS: atomic absorption
According to the Tukey’s test results, the caffeine concentrations obtained by AAS and UV-Vis were statistically equal. For two of the samples (cola and soluble coffee) there was no significant difference between the results obtained by AAS and HPLC while a significant difference was found between the UV-Vis and HPLC results. However, considering the confidence levels, good agreement between the caffeine concentrations obtained by AAS, UV-Vis and HPLC was observed.
Propranolol determination
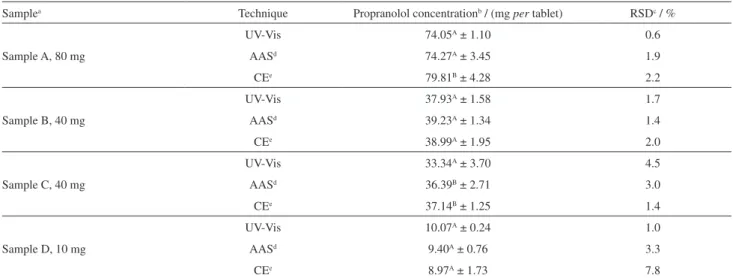
The propranolol concentrations in four samples of commercial medicines were determined by AAS, UV-Vis and CE. Samples of different brands and containing
10 to 80 mg of propranolol per tablet were analyzed and the results are shown in Table 3. The measurement precision, evaluated by means of the relative standard deviation (RSD), ranged from 0.6 to 7.8%. The AAS analysis showed good precision and the RSD values were comparable with those obtained by UV-Vis and CE. Moreover, for AAS the RSDs values were lower than 3.3%, indicating the good precision of this technique for propranolol measurements. The Tukey’s test showed that the propranolol concentrations obtained by AAS, UV-Vis and CE are statistically equal for two (samples B and D) of the four samples analyzed. In the case of sample A, the results for AAS and UV-Vis differed significantly from the values obtained by CE. For sample C, the results obtained by Table 2. Caffeine concentrations of different samples obtained using an atomic absorption spectrometer (AAS) and UV-Vis and HPLC techniques. Results reported as average ± confidence interval (95% confidence level)
Sample Technique Concentrationa RSDb (n = 3) / %
Cola drink / (mg L-1)
UV-Vis 100.27A ± 14.08 5.6
AASc 101.37AB ± 1.73 0.7
HPLCd 110.75B ± 7.74 2.8
Soluble coffee / (mg g-1)
UV-Vis 39.23A ± 9.80 10.0
AASc 39.70A ± 5.20 5.3
HPLCd 37.98A ± 2.35 2.5
Energetic drink / (mg L-1)
UV-Vis 338.03A ± 19.43 2.3
AASc 347.91A ± 59.77 6.9
HPLCd 275.67B ± 46.98 6.9
aAccording to the Tukey’s test, mean values with different letters show a significant difference; bRSD: relative standard deviation; cAAS: atomic absorption
spectrometer; dHPLC: high performance liquid chromatography.
Table 3. Propranolol concentrations of different samples obtained using an atomic absorption spectrometer (AAS) and UV-Vis and CE techniques. Results reported as average ± confidence interval (95% confidence level)
Samplea Technique Propranolol concentrationb / (mg per tablet) RSDc / %
Sample A, 80 mg
UV-Vis 74.05A ± 1.10 0.6
AASd 74.27A ± 3.45 1.9
CEe 79.81B ± 4.28 2.2
Sample B, 40 mg
UV-Vis 37.93A ± 1.58 1.7
AASd 39.23A ± 1.34 1.4
CEe 38.99A ± 1.95 2.0
Sample C, 40 mg
UV-Vis 33.34A ± 3.70 4.5
AASd 36.39B ± 2.71 3.0
CEe 37.14B ± 1.25 1.4
Sample D, 10 mg
UV-Vis 10.07A ± 0.24 1.0
AASd 9.40A ± 0.76 3.3
CEe 8.97A ± 1.73 7.8
aConcentration values given on the product labels; bmean values with different letters show a significant difference according to the Tukey’s test; cRSD: relative
AAS and CE differed significantly from those obtained by UV-Vis. However, all of the results obtained showed good agreement with the values informed on the labels of the products. Moreover, considering the confidence levels, it can be observed that there was good agreement between the propranolol concentrations determined by AAS and the results obtained by UV-Vis and CE.
Conclusions
The application of atomic absorption spectrometer to molecular determinations was successfully demonstrated via the direct determination of caffeine and propranolol concentrations in different samples. The emission lines of Fe (271.9 nm) and Mg (285.2 nm) were used for the analyte measurements and the results obtained showed good accuracy and limits of detection, which were comparable with those associated with UV-Vis, CE and HPLC. In future studies, the versatility of the atomic absorption spectrometer could be explored in the development of methods for the direct determination of other organic compounds in food, pharmaceutical, or other samples.
Acknowledgements
The authors wish to thank the Fundação Araucaria, CNPq, UTFPR and UFSC for financial support.
References
1. Butcher, D. J.; Anal. Chim. Acta2013, 804, 1.
2. Flórez, M. R.; Resano, M.; Spectrochim. Acta, Part B 2013, 88, 32.
3. Mior, R.; Morés, S.; Welz, B.; Carasek, E.; Andrade, J. B.; Talanta2013, 106, 368.
4. Ozbek, N.; Akman, S.; Spectrochim. Acta, Part B2012, 69, 32. 5. Morés, S.; Monteiro, G. C.; Santos, F. S.; Carasek, E.; Welz, B.;
Talanta2011, 85, 2681.
6. Pereira, E. R.; Welz, B.; Lopez, A. H. D.; Gois, J. S.; Caramori, G. F.; Borges, D. L. G.; Carasek, E.; Andrade, J. B.; Spectrochim. Acta, Part B2014, 102, 1.
7. Limburg, T.; Einax, J. W.; Microchem. J.2013, 107, 31. 8. Baysal, A.; Akman, S.; Talanta 2011, 85, 2662.
9. Brandao, G. C.; Matos, G. D.; Pereira, R. N.; Ferreira, S. L. C.; Anal. Chim. Acta 2014, 806, 101.
10. Gomes, M. S.; Trevizan, L. C.; Nóbrega, J. A.; Gouveia, S. T.; Rocha, F. R. P.; Quim. Nova2006, 29, 868.
11. Tobolkina, E.; Qiao, L.; Roussel, C.; Girault, H. H.; Talanta
2014, 130, 377.
12. Oliveira, G. G.; Azzi, D. C.; Vicentini, F. C.; Sartori, E. R.; Fatibello-Filho, O.; J. Electroanal. Chem. 2013, 708, 73. 13. Brunetto, M. R.; Clavijo, S.; Delgado, Y.; Orozco, W.;
Gallignani, M.; Ayala, C.; Cerdà, V.; Talanta2015, 132, 15. 14. El-Ries, M. A.; Attia, F. M. A.; Ibrahim, S. A.; J. Pharm. Biomed.
Anal.2000, 24, 179.
15. Andrade, J. B.; Pinheiro, H. L. C.; Lopes, W. A.; Martins, S.; Amorin, A. M. M.; Brandão, A. M.; Quim. Nova1995, 18, 379. 16. Biazzotto, C. S.; Meinhart, A. D.; Ballus, A.; Ghiselli, G.;
Godoy, H. T.; Food Sci. Technol.2013, 33, 186.
17. Micke, G. A.; Costa, A. C. O.; Heller, M.; Barcellos, M.; Piovezan, M.; Caon, T.; Oliveira, M. A. L.; J. Chromatogr. A
2009, 1216, 7957.
18. Welz, B.; Sperling, M.; Atomic Absorption Spectrometry, 3rd ed.;
Wiley-VCH: Weinheim, Germany, 1999.
19. Rahim, A. A.; Nofrizal, S.; Saad, B.; Food Chem.2014, 147, 262.
20. Xia, Z.; Ni, Y.; Kokot, S.; Food Chem.2013, 141, 4087. 21. Venkatesh, G.; Ramanathan, S.; Mansor, S. M.; Nair, N. K.;
Sattar, M. A.; Croft, S. L.; Navaratnama, V.; J. Pharm. Biomed. Anal. 2007, 43, 1546.
22. El-Emam, A. A.; Belal, F. F.; Moustafa, M. A.; El- Ashry, S. M.; El-Sherbiny, D. T.; Hansen, S. H.; Farmaco2003, 58, 1179.
Submitted:July 18, 2015