Article
Printed in Brazil - ©2013 Sociedade Brasileira de Química0103 - 5053 $6.00+0.00
A
*e-mail: [email protected]
Matrix Effect on Butyltin Analysis of Sediments and Fish Tissues by GC-PFPD
Dayana M. dos Santos,a Mary Rosa R. de Marchi,*,a Ana Flávia L. Godoi,b
Alexander Turrac and Rosalinda C. Montonec
aInstitute of Chemistry, State University of São Paulo (UNESP),
CP 355, 14800-900 Araraquara-SP, Brazil
bDepartment of Environmental Engineering, Federal University of Paraná (UFPR),
81531-990 Curitiba-PR, Brazil
cOceanographic Institute, University of São Paulo (USP), 05508-900 São Paulo-SP, Brazil
A quantificação de compostos butílicos de estanho (BTs) em matrizes ambientais pode ser afetada pela ocorrência de interferentes encontrados em matrizes complexas tais como sedimentos e tecidos biológicos. O presente estudo investigou o efeito matriz em procedimentos analíticos para quantificação e especiação de BTs (TBT, DBT e MBT) em sedimentos e em dois tecidos (brânquias e fígado) de peixe, utilizando a técnica de cromatografia a gás com detecção fotométrica de chama pulsante (GC-PFPD). Diferentemente dos sedimentos avaliados, um efeito matriz significativo foi observado para os tecidos de peixe investigados, indicando que a quantificação de BTs deve ser realizada através da curva construída na matriz para evitar, dessa forma, erros de quantificação e redução da precisão analítica.
Butyltin (BTs) quantification in environmental matrices can be affected by interfering species found primarily in complex matrices, such as sediment and biota tissues. This study investigated matrix effects in analytical procedures for butyltin (TBT, DBT and MBT) quantification and speciation in sediments and in two fish tissues (gill and liver) by gas chromatography with pulsed flame photometric detection (GC-PFPD) analysis. Unlike sediment samples, tissues exhibited a significant matrix effect, thus, the quantification should be made by curve over matrix to avoid quantification errors and loss of analytical accuracy.
Keywords: butyltin, GC-PFPD, matrix effect, sediment, biota tissues
Introduction
Butyltin compounds (BTs) are a group of organic contaminants characterized by a tin atom (Sn) covalently
bound to one or more butyl substituents.1 These
compounds are utilized in many applications. However, their use has resulted in significant amounts of BT residues entering the ecosystem, mainly aquatic environments in which they can be found in the water, suspended
particulate matter (SPM) and biota,2 even after tributyltin
(TBT) was banned as an antifouling paint agent in 2008.3,4
Attention has been focused on BTs in biological matrices due to their toxic effects on aquatic life even at lower
concentrations (ng L-1).5 Due to their hydrophobicity,6
BTs are mainly found in sediments in aquatic systems and
are particularly accessible for organisms in direct contact
with the bottom.7
Several studies regarding TBT toxicity in fish have
been reported,8-10 and studies of demersal and detritivorous
fishes, such as catfishes, have become important for the assessment of contaminant levels and potential risk to the aquatic trophic chain. In these organisms, butyltin residues are preferentially accumulated in liver tissues; thus, the
monitoring of this organ for contamination is important.11 In
addition to the liver, muscle tissue has also been used for BT
analysis.12 Furthermore, the accumulation of contaminants
in gills13 is less frequently tested but it is also important to
assess butyltin buildup from water and SPM.
The evaluation of the environmental impact of butyltins requires the development of accurate and precise analytical methods for several sample types, including speciation
Sample extracts with high levels of organic matter or fats can contain substances that are co-extracted and deposited on the chromatographic column, reducing the efficiency of the separation. To minimize these interferences, a
clean-up step, usually involving silica gel (Si−OH active sites),
alumina (Al−OH active sites) and Florisil (for matrices
with high lipid levels), is strongly suggested in addition to derivatization.15
Selective analyses of butyltins are based on chromatographic separation with a selective detection method, such as flame photometric detection (FPD), pulsed flame photometric
detection (PFPD) or mass spectrometry (MS).1,5,16-18
In addition, considering the time spent for BT analysis, the
analytical method must be validated to check its accuracy.19-21
The selectivity, specificity, linearity and linear range as well as the quantification accuracy are evaluated using an internal standard (IS) and a certified reference material (CRM) to
test accuracy and precision.19 A recovery assay is usually
prepared using a surrogate, a compound that is chemically very similar to butyltins (TBT, DBT and MBT) but is not
naturally present in samples.20,22
An important analytical parameter in BT analysis is the overestimation of analyte concentrations due to matrix effects in the chromatographic system, which is common
for biological matrices.22 This effect can lead to an increase
or decrease in the chromatographic response to butyltin
analytes prepared in the sample matrix versus solvent.18
During the chromatographic analysis, these effects can be observed as false-negative and false-positive peaks as well as a decrease in the detector signal for real samples
compared with the analyte prepared in solvent.23,24 The
matrix effect can manifest itself as an increase in the tested
mass,18 or as a blockage of active sites on the injector by
matrix compounds and possible degradation or adsorption
of analytes,25,26 resulting in an increase or decrease in the
detector response.27 As a consequence of these issues, the
matrix effect is considered to be one of the most significant sources of error in analytical measurements and must be accounted for in studies involving organotin compounds,
particularly in biota samples.28 Most studies involving this
analytical parameter have cited the presence/absence of a matrix effect but do not clearly describe this effect.
In this study, our group presents quality control procedures for a current method for BT quantification in estuarine sediments and fish tissues. This study focuses on matrix effects present in these two types of environmental samples and their interference on the analytical system. Currently, there are few studies evaluating butyltin quantification, and this research is important to assess the real impact of these compounds on organisms and their associated environment.
Experimental
Reagents
The organotins TBT (96% tributyltin chloride), DBT (96% dibutyltin dichloride), MBT (95% butyltin trichloride), TPrT (98% tripropyltin chloride) and TeBT (96% tetrabutyltin) were purchased from Sigma-Aldrich (Milwaukee, WI, USA). Neutral aluminum oxide and
Grignard reagent (2 mol L-1 pentylmagnesium bromide
in diethyl ether) were also obtained from Sigma-Aldrich. Methanol, hydrochloric acid, sulfuric acid, acetic acid, sodium hydroxide and anhydrous sodium sulfate were purchased from JT Baker (Xalostoc, Mexico). Hexane and toluene were acquired from Mallinckrodt (Xalostoc, Mexico). Ammonium pyrrolidine dithiocarbamate (98% APDC) was purchased from Fluka (St. Gallen, Switzerland). Certificated reference material ERM-CE477 (mussel tissue) was purchased from European Reference Materials (Institute for Reference Materials and Measurements, Geel, Belgium) and PACS-2 (marine sediment reference material) was obtained from the National Research Council of Canada (Ottawa, Canada).
Sample preparation and BT stock solutions
The estuarine catfish Cathorops spixii (Siluriformes,
Ariidae) was collected at Guaratuba Bay (S25o49’
W48o36’) in Paraná State, South of Brazil. A total of 30
fish were sampled, frozen and transported to the laboratory. Gills and livers were removed and mixed by vortexing for the procedure validation tests. Sediments were sampled
in the São Vicente Estuary (S23o58’ W46o23’) in São
Paulo State, Southeast of Brazil. Sediment samples were homogenized and sieved (< 63 µm) in the laboratory for fine particle analysis.
The butyltin chloride stock solutions were prepared
in hexane at concentrations of 5 µg mL-1 MBT, 6 µg mL-1
DBT and 4 µg mL-1 TBT. Surrogate (TPrT) and internal
standard (IS) stock solutions were 6 and 10 µg mL-1,
respectively. These solutions were stored at −20 °C in the
dark and used for a period of six months.
Analysis
The utilized methods were based on previous studies
reported in the literature.15,29,30 The method for sediment
samples was developed by Godoi et al.15, and the method
for fish tissues was adapted from a method proposed by
Cristale et al.30 using 0.5 g of fresh tissue. The procedures
all tested analytical parameters. The tripropyltin (TPrT) surrogate compound was added at a concentration of
300 ng g-1 to samples prior to the extraction step (12 h
before). The tetrabutyltin (TeBT) internal standard was
added at a concentration of 1000 ng g-1 to the final extracts.
The extraction of lipid content was based on the method
proposed by Folch et al.31 using a mixture of methanol and
chloroform (2:1).
Apparatus
The extracts were analyzed using gas chromatography. A Varian Agilent 3800 (Walnut Creek, USA) equipped with a pulsed flame photometric detector using a tin filter (610 nm) and a low polarity VF5 capillary column (30 m × 0.25 mm × 0.25 µm; Varian, Walnut Creek, USA) were employed and the setup with the following temperature program was used: 130 °C (1 min), 130-280 °C
(10 °C min-1) and 280 °C (4 min); injection mode: splitless
(1 min); injection volume: 2 mL; detector temperature: 300 °C; injector temperature: 250 °C; and hydrogen carrier
gas at a flow rate of 1.7 mL min-1.
Quality control
Linearity was calculated according to the linear
interval method proposed by Huber,32 and described by
Cristale et al.30 Values below this confidence interval
were rejected. Limits of detection (LOD) and limits of quantification (LOQ) for the analytical system (GC-PFPD)
were based on the Huber test32 in which the first note of
linearity was considered to be LOD, and the first point in linearity was considered to be the LOQ.
The Thier and Zeumer33 determination was used for
LOD, considering Student’s t-value (tn95%) using three
degrees of freedom and a confidence level of 0.05, the
system sensitivity (S), the standard deviation of a low
spiked level (A) and blank (B) and the number of spiked
determinations (m) and blank measurements (n). LOQ was
based on the lower spiked value, in which the recovery was above 70% (accuracy) and the relative standard deviation (RSD) was below 20% (precision).
Quality control was conducted using blanks, treated in the same manner as the samples, as well as the internal standard TeBT and surrogate TPrT. The accuracy and precision of the method were checked using mussel tissue ERM-CE477 for fish tissues and PACS-2 for sediment. Spiked tissues and sediments were also investigated at three different recovery levels on the calibration curve.
Matrix effects
Matrix effects were determined by adding data points to the calibration curve (n = 5) for liver and gill samples (n = 5) and sediment samples (n = 7) post-extraction. Then, the effect was measured based on the angular coefficient
of the regression curve according to Thompson et al.19 to
verify a positive or negative influence on the results. This influence was calculated based on differences between the matrix and solvent angular coefficients multiplied by 100 or the point-by-point RSD of area/concentration values
obtained from the matrix and solvent curves.26 The effect
was considered to be significant if the obtained difference was above 10% for the angular coefficient method and
above 20% for the RSD (%) method. A t-test was also
applied with a significance level of 95% for significant
differences between slopes of the curves.34
Results and Discussion
For all of the tested BTs, the system linearity and the calibration curves were linear in the interval between
0.033 and 11.880 µg mL−1. The correlation coefficients (R2)
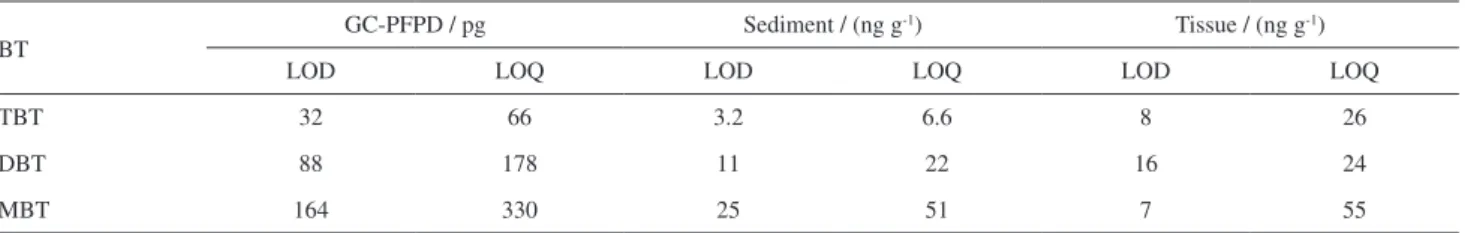
of the calibration curves were above 0.95, and all of the curves were obtained using the internal standard TeBT. The LOD and LOQ values for the GC-PFPD method and for the tested methods are presented in Table 1.
The limits of detection observed in other studies involving BT analyses of sediment and fish are generally lower than the LOD value found in this study. Thus, the tested method, which uses a Grignard reagent and extraction with toluene/methanol, does not produce the highest analytical sensitivity for BTs in these matrices. In some cases, the use of a Grignard reagent as the
Table 1. Limits of detection (LOD) and quantification (LOQ) for both the analytical system and the tested methods
BT GC-PFPD / pg Sediment / (ng g
-1) Tissue / (ng g-1)
LOD LOQ LOD LOQ LOD LOQ
TBT 32 66 3.2 6.6 8 26
DBT 88 178 11 22 16 24
derivatization agent can generate higher LODs for butyltin compounds in biological samples compared with ethylation
with NaBEt4,35 mainly for MBT.36 However, the quality
control parameters can permit the safe application of our method because environmental and toxic levels of BTs are usually above the determined limit of quantification. Furthermore, the applied quality control procedures can assure the stringency of results using strict statistical parameters for determination of limit of detection instead
of signal/noise parameters.21,37 Previous studies using the
same analytical system30,38 have found that the intermediate
analytical response is reproducible for butyltin standards
using GC-PFPD and the same analytical method.39
Tissue blanks were analyzed, and butyltin concentrations
were not detectable for C. spixii liver or gills or for
sediment samples used for quality control. For fish tissues,
the evaluation of the accuracy and precision using the certified reference material resulted in recoveries of 98 ± 12, 61 ± 18 and 32 ± 6% for TBT, DBT and MBT, respectively. The recovery interval must fall between
50-150%,21,40 so the obtained values satisfy the quality
control parameters, with the exception of that for MBT. Lower analytical response is usually observed for MBT due
to its higher polarity.41 Lower recoveries of DBT, as well as
broader peaks, are generally due to the interaction of this BT with other co-extracted compounds present in biotic
samples.42 The presence of foams and colloidal interfaces
observed between the aqueous and organic phases can also reduce the BT recoveries and the reproducibility of
the measurements.34
To obtain a realistic recovery in the absence of certified reference material for the fish tissues, spiked samples of blank fish tissues were also used for the recovery assay. The assay results ranged from 60 ± 7 to 95 ± 8% for gill samples and from 65 ± 2 to 88 ± 1% for liver samples spiked
at 3 points on the calibration curve (33-196 ng g-1). These
recoveries are acceptable for complex matrices, such as
biological samples,21 in which the lipid content can reduce
the recovery efficiency. Lipid contents in the samples were approximately 7 and 2% in liver and gill tissues, respectively. Fats present in fish tissues can remain in the extract even after a clean-up step and consequently influence the chromatographic response, affecting the detection of butyltin compounds. Although lipid content and analyte adsorption in the matrix can decrease the recoveries, the use of a surrogate compound, i.e., TPrT, in each analysis can reduce potential errors. In these samples, surrogate (TPrT) recoveries were above 70% for both matrices and represent good method efficiency.
For sediment samples, the CRM analysis (PACS-2)
using the method proposed by Godoi et al.15 obtained
recoveries between 98 ± 0.2 and 110 ± 0.13%, and the three spiked samples resulted in recoveries above 70% with RSD values below 20%. The RSD values for these samples are sometimes used to verify the matrix effect when values are
considered to be high (above 20%).43
The matrix effect on the BT analyses has been discussed in the literature since 1990; however, these studies focused on the significant variations among the responses of the chromatographic system in different matrices when the same analytical method was applied. These studies do not address the different analytical response for a standard prepared in solvent and spiked matrices. The quantification is usually made based on calibration curves for standards prepared in solvents, resulting in significant quantification errors for samples prepared in interfering matrices.
As previously discussed, the matrix effect for a chromatographic system can result from the analytical method and the selected quantification system, as well as the presence of other matrix contaminants and components, such as organic matter, fats and hydrocarbons. The term “matrix effect” is also used to refer to the recovery of spiked samples compared with the recovery of an analyte from
blanks,42-46 or to the evaluation of interfering compounds
at the same retention time as the analytes.
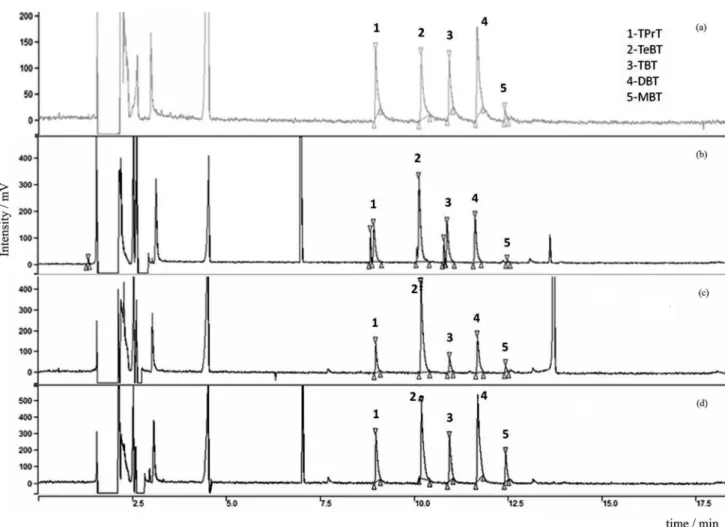
In the present study, chromatograms of BTs prepared in solvent and in the investigated matrices (sediment and fish tissues) do not exhibit differences in the retention times of analytes (Figure 1 and Table 2), and interfering peaks are only observed for sediment samples (Figure 1b) co-eluting with TPrT and TBT analyte peaks.
The matrix effect was observed for TBT in fish tissues when the calibration curves were overlapped (Figure 2), primarily in liver samples, and the signal intensity
decreases. Tang and Wang18 reported the same effect using
the muscle of the milkfish (Chanos chanos); the effect
was due to decrease ethylation (NaBEt4) of organotins
(butyltin and phenyltin compounds), which preferentially bond to cations and matrix sites. Thus, derivatized matrix components can occupy active sites during standard
analysis,24 and an internal standard and/or spiked sample
are commonly used to reduce matrix effects caused by
analyte losses during analytical procedures.47
Matrix effects can lead to systematic errors that affect
both the intercept and slope of the calibration curves.46
When the evaluation method of Thompson et al.19
was applied, a negative effect on TBT (−37.5%), DBT
(−22.2%) and TPrT (−28.5%) angular coefficient curves
was observed in liver tissues (Table 2). The slopes were
also compared using the t-test,34 and there was a significant
difference (t-values higher than critical values) for the
These results for liver tissue suggest that the matrix effect is not only matrix-dependent but is also partially due to the
chemical structure of each BT compound.23
The matrix effect was not observed using this method for TBT and DBT in gill samples based on the results presented in Figures 3a and 3b; an RSD value above 20% was found for some tested concentrations. The same RSD was found for MBT once matrix effect of liver tissues was observed in three points of curve as shown on Figure 3a. Differences above 20% RSD have been previously reported for fish tissues quantified by GC-FPD, resulting in different slopes for solvent and matrix calibration curves as well
as MBT recovery below the confidence level and LOQ
between 20 and 30 ng g-1.48
The matrix effect for sediment samples was not observed when based on a difference in response of less than 10% for the angular coefficients (Table 2) and RSD values below 20% (Figure 3c). However, the analytical performance for MBT was worse than that for other BTs, i.e., lower recoveries. According to Ceulemans and
Adams,44 the higher sulfur content, as well as the presence
of greater amounts of organic matter frequently found in estuarine environments, can strongly affect MBT extraction
from sediments, suppressing the analyte signal.22 Thus,
Table 2. BT matrix effect study: retention times (tR), linear range and angular coefficients of the calibration curves (n = 9)
tR / min
Fish Sediment
Linear range / (ng mL-1)
Angular coefficient Linear range / (ng mL-1)
Angular coefficient
Solvent Liver Gill Solvent Matrix
MBT 11.17 40 to 660 0.0001 0.0002 0.0002 40 to 990 0.0002 0.0002
DBT 10.44 46 to 792 0.0009 0.0007 0.0009 46 to 990 0.0011 0.0012
TBT 9.71 33 to 792 0.0008 0.0005 0.0008 33 to 792 0.0011 0.0011
TPrT 7.84 40 to 660 0.0007 0.0005 0.0007 40 to 990 0.0001 0.0001
MBT extraction depends on the sample composition,49 and
co-elution at the same retention time can be observed.17 In
Figure 1, some sulfur interference can be observed in the chromatogram for the sediment, but co-elution occurs with TPrT and TBT, not MBT; this result is a potential focus for further studies using the tested method.
The comparison of the results of this study with those reported in the literature indicates that the absence of the matrix effect in the tested sediment samples and the interference of biological matrices during analysis using PFPD are likely the result of variations in extraction/ derivatization efficiency or due to the use of different analytical systems. In complex matrices, the derivatization step with a Grignard reagent was reported as affecting
the BT chromatographic response.17 Matrix interference
was also previously observed in studies involving the BT determination using photometric detectors with different speciation methods, resulting in 40% higher
response for fish tissues.48,50 In contrast, the matrix effect
was not observed in biota samples using GC-PFPD for
extraction based on solid phase micro extration (SPME),5,17
demonstrating that the extraction method and the detection
system can reduce the matrix effect.24,27,51
Less interference and higher selectivity were reported
for pesticide analysis using PFPD analysis versus mass
spectrometry (MS).48 According to Pinho et al.24, the MS
detector can increase the matrix effect due to the metallic surface and combustion step that are not present on the
Figure 2. Calibration curves for TBT in the matrix effect study: (a) fish tissue and (b) sediment.
photometric detectors in PFPD. However, the matrix effect with spectrometric detectors can be reduced using
extraction procedures that improve the selectivity.51 The
reduced injection volume (2 µL) did not appear to have an influence on the matrix effects observed (fish tissues) and not observed (sediments) in the analytical system, and the mass of sample may also be investigated.
The observed differences in chromatographic response for fish tissues can lead to errors in the quantification of these compounds at reduced environmental concentrations, and their effect on the analytical system can reduce the method
sensitivity.52 This issue is significant for BTs due to the
banning of TBT after 2008; BT concentrations in the aquatic environment have experienced a considerable decrease, and the safe quantification of these compounds at lower levels is essential for determining toxic levels for aquatic organisms.
Conclusions
The method tested in this study can be applied to environmental samples of estuarine fish based on results obtained for quality control procedures for both types of tissues (liver and gills) used for BT analysis. Using GC-PFPD analysis, the matrix effect was observed in fish tissues but was absent in sediments. Although no matrix effect was observed for sediment samples, further studies will examine the interfering peaks observed in the sediment chromatogram by evaluating different estuarine sediment compositions of organic matter and sulfur. The establishment of a method based on quality control and the evaluation of matrix effects will improve the accuracy of analytical results, helping future environmental studies to determine the real impact of BT compounds in estuarine systems and nearby human communities.
Acknowledgements
The authors wish to acknowledge the Coordenação de Aperfeiçoamento de Pessoal de Nível Superior (CAPES), the Conselho Nacional de Desenvolvimento Científico e Tecnológico (CNPq) and the Fundação de Apoio à Ciência, Tecnologia e Educação (FACTE) for financial support.
References
1. Hoch, M.; Appl. Geochem.2001, 16, 719.
2. Santos, D. M.; Sant’Anna, B. S.; Godoi, A. F. L.; Turra, A.; Marchi, M. R. R. In Pollution Monitoring; Ortiz, A. C.; Griffin,
N. B., eds.; Nova Science Publishers, Inc.: New York, USA, 2011, ch. 2.
3. http://www.imo.org, accessed in April 2013.
4. Fernandez, M. A.; J. Coastal Res.2006, 39, 1336.
5. Le Gac, M.; Lespes, G.; Potin Gautier, M.; J. Chromatogr., A
2003, 999, 123.
6. Gadd, G. M.; Sci. Total Environ.2000, 258, 119.
7. Gabbianelli, R.; Moretti, M.; Carpenè, E.; Falconi, G.; Sci. Total Environ.2006, 367, 163.
8. Dwivedi, J.; Trombetta, L. D.; J. Toxicol. Environ. Health2006,
69, 1311.
9. D’Agati, P.; Mansueto, C.; Mansueto, V.; Pellerito, C.; Cangialosi, M. V.; Fiore, T.; Scopeççiti, M.; Pellerito, L.; Appl. Organomet. Chem.2006, 20, 357.
10. Zhang, J.; Zhenghong, Z.; Chen, Y.; Zhao, Y.; Hu, S.; Wang, C.;
Aquat. Toxicol.2007, 83, 174.
11. Kannan, K.; Tanabe, S.; Tatsukawa, R.; Williams, R.; Int. J. Environ. Anal. Chem.1995, 61, 263.
12. Lee, C. C.; Hsieh, C. Y.; Tien, C. J.; Chemosphere.2006, 65,
547.
13. Borghi, V.; Porte, C.; Environ. Sci. Technol.2002, 36, 4224.
14. Mechlinska, A.; Wolska, L.; Namiesnik, J.; TrAC, Trends Anal. Chem.2012, 31, 129.
15. Godoi, A. F. L.; Favoreto, R.; Santiago-Silva, M. R.; Quim. Nova, 2003, 26, 708.
16. Morabito, R.; Massanisso, P.; Quevauviller, P.; TrAC,Trends Anal. Chem.2000, 19, 113.
17. Aguerre, S.; Bancon-Montigny, C.; Lespes, G.; Potin-Gautier, M.;
Analyst2000, 125, 263.
18. Tang, C. H.; Wang, W. H.; Anal. Chim. Acta2007, 581, 370. 19. Thompson, M.; Ellison, S. L. R.; Wood, R.; Pure Appl. Chem.
2002, 74, 835.
20. Ribani, M.; Bottoli, C. B. G.; Collins, C. H.; Jardim, I. C. F. S.; Melo, L. F. C.; Quim. Nova2004, 27, 771.
21. ICH - International Conference on Harmonisation of Technical Requirements for Registration of Pharmaceuticals for Human Use, Q2(R1), Validation of Analytical Procedures, Methodology, 1996, Complementary Guideline on Methodology incorporated in November 2005, available in: http://www.ich.org, accessed in January 2013.
22. Montigny, C.; Lespes, C.; Potin-Gautier, M.; J. Chromatogr., A
1998, 819, 221.
23. Hajŝlová, J.; Holadová, K.; Kocoured, V.; Poustka, J.; Godula, M.; Cuhra, P.; Kempný, M.; J. Chromatogr., A1998,
800, 283.
24. Pinho, G.; Neves, A. A.; Queiroz, M. E. L. R.; Silvério, F. O.;
Quim. Nova.2009, 32, 987.
25. Cardoso, M. H. W. M.; Nobrega, A. W.; Abrantes, S.; Analytica
2008, 34, 48.
26. Saari, E.; Perämäki, P.; Jalonen, J.; Microchem. J.2007, 87, 113.
27. Eurachem; The Fitness for Purpose of Analytical Methods: a Laboratory Guide to Method Validation and Related Topics;
28. Kim, K. H.; Nguyen, H. T.; J. Sep. Sci.2007, 30, 367. 29. Fernandez, M. A.; Wagener, A. L. R.; Limaverde, A. M.;
Scofield, A. L.; Pinheiro, F. M.; Rodrigues, E.; Mar. Environ. Res.2005, 59, 435.
30. Cristale, J.; Santos, D. M.; Sant’Anna, B. S.; Sandron, D. C.; Cardoso, S.; Turra, A.; Marchi, M. R. R.; J. Braz. Chem. Soc.
2012, 23, 39.
31. Folch, J.; Lees, M.; Stanley, G. H. S.; J. Biol. Chem.1956, 226,
497.
32. Huber, L.; LC-GC Europe1998, 11, 96.
33. Thier, H. P.; Zeumer, H.; Manual of Pesticide Residue Analysis; Verlag Chemie: New York,USA, 1987.
34. Cassi, R.; Tolosa, I.; Bartocci, J.; De Mora, S.; Appl. Organomet. Chem.2002, 16, 355.
35. Liscio, C.; Carro, M. D.; Magi, E.; C. R. Chim. 2009, 12, 831. 36. Vahčič, M.; Milačič, R.; Ščančar, J.; Anal. Chim. Acta2011,
694, 21.
37. Rastkari, N.; Ahmadkhaniha, R.; Samadi, N.; Shafiee, A.; Yunesian, M.; Anal. Chim. Acta2010, 662, 90.
38. Santos, D. M.; Sant’Anna, B. S.; Sandron, D. C.; Souza, S. C.; Cristale, J.; Marchi, M. R. R.; Turra, A.; Estuarine Coastal Shelf Sci.2010, 88, 322.
39. Instituto Nacional de Metrologia, Normalização e Qualidade Industrial (INMETRO); Orientações sobre Validação de Métodos Analíticos; INMETRO: Brasil, 2010, p. 20.
40. Ohji, M.; Arai, T.; Miyazaki, N.; Estuarine Coastal Shelf Sci.
2007, 72, 721.
41. Leermakers, M.; Nuyttens, J.; Baeyens, W.; Anal. Bioanal. Chem. 2005, 381, 1272.
42. González-Toledo, E.; Benzi, M.; Compañó, R.; Granados, M.; Prat, M. D.; Anal. Chim. Acta2001, 443, 183.
43. Delgado, A.; Usobiaga, A.; Prieto, A.; Zuloaga, O.; Diego, A.; Madariaga, J. M.; J. Sep. Sci.2008, 31, 768.
44. Ceulemans, M.; Adams, F. C.; Anal. Chim. Acta1995, 317, 161. 45. Leroy, M. J. F.; Quevauviller, P.; Donard, O. F. X.; Astruc, M.;
Pure Appl. Chem. 1998, 70, 2051.
46. Salvador, I. M.; Frenich, A. G.; González, F. J. E.; Martínez Vidal, J. L.; Chromatographia2006, 64, 667.
47. Rodríguez-González, P.; Encinar, J. R.; Alonso, J. I. G.; Sanz-Medel, A.; J Anal. At. Spectrom.2002, 17, 824. 48. Pereiro, I. R.; Schmitt, V. O.; Szpunar, J.; Donard, O. F. X.;
Lobinski, R.; Anal. Chem.1996, 68, 4135.
49. Carpinteiro, J.; Rodríguez, I.; Cela, R.; Anal. Bioanal. Chem.
2004, 380, 853.
50. Gallego-Gallegos, M.; Garrido, M. L.; Olivas, R. M.; Baravalle, P.; Baggiani, C.; Cámara, C.; J. Chromatogr., A2010,
1217, 3400.
51. Flores, M.; Bravo, M.; Pinochet, H.; Maxwell, P.; Mester, Z.;
Microchem. J.2011, 98, 129.
52. Vidal, J. L. M.; Vega, A. B.; Arrebola, F. J.; González-Rodríguez, M. J.; Sánchez, M. C. M.; Frenich, A. G.; Rapid Commun. Mass Spectrom.2003, 17, 2099.
Submitted: February 3, 2013 Published online: May 28, 2013