O
RIGINALA
RTICLERevista Brasileira de Fisioterapia
Effects of an adapted physical activity program
on the physical condition of elderly women:
an analysis of efficiency
Efeitos de um programa de atividade física adaptada na capacidade física e
parâmetros de saúde de mulheres idosas: análise de eficiência
Francisco Alburquerque-Sendín1, Enzo Barberio-Mariano2, Naja Brandao-Santana2, Daisy A. N. Rebelatto2, José R. Rebelatto3
Abstract
Background: Specific research tools and designs can assist in identifying the efficiency of physical activity in elderly women. Objectives:
To identify the effects of physical activity on the physical condition of older women. Method: A one-year-long physical activity program (123 sessions) was implemented for women aged 60 years or older. Four physical assessments were conducted, in which weight, height, BMI, blood pressure, heart rate, absences, grip strength, flexibility, VO2max, and static and dynamic balance were assessed. The statistical analyses included a repeated measures analysis, both inferential (analysis of variance – ANOVA) and effect size (Cohen’s d coefficient), as well as identification of the participants’ efficiency (Data Envelopment Analysis – DEA). Results: Despite the observation of differences that depended on the analysis used, the results were successful in the sense that they showed that physical activity adapted to older women can effectively change the decline in physical ability associated with aging, depending on the purpose of the study. The 60-65 yrs group was the most capable of converting physical activity into health benefits in both the short and long term. The >65 yrs group took less advantage of physical activity. Conclusions: Adherence to the program and actual time spent on each type of exercise are the factors that determine which population can benefit from physical activity programs. The DEA allows the assessment of the results related to time spent on physical activity in terms of health concerns. Article registered in Clinicaltrials.gov under number NCT01558401.
Key words: physical therapy; physical activity; elderly; women; efficiency.
Resumo
Contextualização: Ferramentas e desenhos específicos de pesquisa podem ajudar na identificação da eficiência da atividade física em mulheres idosas. Objetivos: Identificar os efeitos da atividade física sobre a eficiência da condição física de mulheres idosas. Método:
Aplicou-se um programa de atividade física de um ano (123 sessões) para mulheres com idade de 60 anos ou mais. Foram realizadas quatro coletas de dados físicos, avaliando peso, altura, índice de massa corporal (IMC), pressão arterial, frequência cardíaca, ausências, força de preensão, flexibilidade, VO2max, além de equilíbrio estático e dinâmico. As análises estatísticas incluíram uma análise de medidas repetidas, tanto inferencial (análise da variância – ANOVA) quanto do tamanho do efeito (coeficiente d de Cohen), além da identificação da eficiência dos participantes (análise por envoltório de dados – DEA). Resultados: Apesar das diferenças observadas nos resultados das análises realizadas, eles permitiram apontar que a atividade física adaptada para mulheres idosas pode efetivamente mudar as capacidades físicas associadas ao envelhecimento. As mulheres com idades entre 60-65 anos são mais capazes de reverter a atividade física em benefícios para a saúde no curto e longo prazo. No entanto, as mulheres mais velhas, dentro do grupo >65 anos, tiveram mais dificuldade em tirar proveito da atividade física. Conclusões: A adesão ao programa e o tempo gasto em cada tipo de exercício determinam a população que pode se beneficiar de programas de atividade física. A DEA permite ponderar os resultados relativos ao tempo de atividade física realizada em termos de condições de saúde. Registrado no Clinicaltrials.gov sob o número NCT01558401.
Palavras-chave: fisioterapia; atividade física; idoso; mulheres; eficiência.
Received: 02/03/2012 – Revised: 03/23/2012 – Accepted: 03/23/2012
1Department of Physical Therapy, University of Salamanca, Salamanca, Spain
2Department of Production Engineering, Escola de Engenharia de São Carlos, Universidade de São Paulo (USP), São Carlos, SP, Brazil 3Department of Physical Therapy, Universidade Federal de São Carlos (UFSCar), São Carlos, SP, Brazil
Correspondence to: Francisco Alburquerque Sendín, University of Salamanca, Department of Physical Therapy, C/Donante de Sangre, s/n, Postal Code: 37007, Salamanca, Spain, e-mail: [email protected]
Efficiency of physical activity in older women
Introduction
he world’s population is aging. In 2003, Brazil’s elderly population was 16.7 million: 9.6% of its total population. It is estimated that by 2020 the elderly will make up 13% of Bra-zil’s population1. Aging is characterized by morphological and physiological changes, such as loss of muscle strength, lex-ibility, and balance, and other deicits in physical function2,3, particularly in women4. In conjunction with these processes, there are variations in body composition and anthropometry (a reduction in weight, height, and bone mineral density) and these are exacerbated by the more sedentary lifestyle of older individuals5,6, which afects their quality of life7 and increases the risk of falls, especially in women8. Furthermore, it has been identiied that Brazilian women show variations in their itness relative to other populations9.
Although physical activity programs for the elderly have been shown to curb the harmful changes of aging10,11, not all programs have the same efectiveness12,13 despite being gener-ally regarded as efective14. he existence of a wide variety of programs15 calls for debate about their outcomes13,16, which in turn implies carrying out studies on population subgroups us-ing diferent types of analysis13,16-19.
Speciic research tools and designs can assist in identifying not only program efectiveness but also program eiciency and use in terms of better physical performance, which is inluenced by multiple factors including adherence to the program20. hese analyses allow the assessment of the inluence of eiciency and the factors that determine it or are associated with it and can provide classiications and subgroups to which interventions should be adapted if they are to ofer the best service in the short and medium term19. herefore, the purpose of this study was to identify the efects and eiciency of an adapted physi-cal activity program as regards the physiphysi-cal condition of older Brazilian women.
Method
Participants
Participants were selected from among a group of 120 el-derly women (>60 yrs21,22) included in an Adult Revitalization Program in São Carlos, SP, Brazil. Initially, all participants un-derwent a medical evaluation of their physical characteristics and previous health problems that might hinder their partici-pation in the program activities23. Participants were excluded if they did not come to one or more of the physical evaluations conducted at the beginning and throughout the program, and those whose adherence to the program sessions was lower than
75% were also excluded. hus, this study included 64 women with a mean age of 66.92±5.41 years. his sample was analyzed as a group (>60 yrs group) and was divided into two subgroups by age: the 60-65 yr subgroup (n=31, 62.45±1.82 years) and the >65 yr subgroup (n=33, 71.12±4.11 years).
All participants signed an informed consent form and clared that they were not participating in other specially de-signed physical activities outside the program. he study was conducted in accordance with resolution 196/96 of the Na-tional Health Council (CNS) and was approved by the Human Research Ethics Committee of Universidade Federal de São Carlos (UFSCar), São Carlos, SP, Brazil (Document No. 104/4). his study was registered at Clinicaltrials.gov (NCT01558401).
Outcome measures
Participants were evaluated individually according to difer-ent inputs (amount of time in days spdifer-ent on strength, lexibil-ity, and aerobic exercises) and outputs (levels of grip strength, lexibility, static balance, dynamic balance, and VO2max)23 in four assessments (A1, A2, A3, and A4). Grip strength was measured using a Sammons Preston Swedley-Type hand dynamometer (Jamar®
, Bolingbrook, IL, USA)24,25. he test was performed three times on the dominant upper limb at 10-second inter-vals between each run. he grip strength assigned to each participant was the highest of the three values measured. he participants were instructed to hold the grip meter during ex-halation without performing the Valsalva maneuver; they were encouraged verbally throughout the test26. Reliability studies have shown that handgrip strength measured with the Jamar dynamometer is a reliable method (ICC>0.85) and is recom-mended for use in clinical practice27.
he Sit-and-Reach Test was employed to evaluate lower back and lower limb lexibility28. he movement was performed three times. he lexibility assigned to the participants was the highest value measured29. Previous studies have indicated that reliability estimates for the Sit-and-Reach Test are consistently high in elderly women (ICC=0.98)30.
Static balance was veriied by the One-Leg Stance Test with eyes open31. he participants gazed at a ixed point two meters away for no more than 30 seconds, with one leg bent at the knee. he test was performed three times with eyes open and closed and with both legs, taking into account the mean value of the measures for each condition (eyes open or closed). his procedure has high inter-rater reliability (ICC=0.93)32.
Dynamic balance was evaluated by Maximum Gait Veloc-ity (MGV)33,34. he participants were instructed to walk along a 33.3 cm-wide and 3.33 m-long track painted on the loor in the shortest possible time. he test was performed three times. he dynamic balance value assigned to each participant was
329
the mean time spent walking along the track. he coeicient of variation for healthy elderly women varies between 0.09 and 0.1435. he Rockport 1-Mile Walk Test was used to determine physical condition estimated by the VO2max36. he test-retest re-liability coeicient of this test has been considered high (0.97) by diferent authors37,38.
he following variables were also determined by trained re-search staf, using standardized protocols at each assessment39: height, weight, body mass index (BMI), heart rate, and systolic and diastolic pressures. Height was measured to the nearest centimeter using a portable stadiometer. he participants re-moved their shoes, stood with their back to the stadiometer maintaining erect posture and looking straight forward during height measurement. Weight was measured on a scale with the participants in undergarments. Both the stadiometer and the scale had been calibrated previously. Resting pulse rate and resting blood pressure were measured after a minimum 10-minute rest period. Pulse rate was measured manually twice for one minute at the radial artery of the left wrist. Resting blood pressure was measured manually twice on the left arm with a hand aneroid sphygmomanometer and stethoscope. All physical measurements were collected twice, and the mean of the two values was used in analysis. Adherence to the program (absenteeism) was also assessed.
Intervention
he physical activity program consisted of 123 sessions carried out over a period of 52 weeks. he irst assessment (A1) was performed, followed by 12 weeks of activities. Next, the second assessment (A2) was performed, followed by three weeks of rest and another 17 weeks of activities. hen the third assessment (A3) was conducted, followed by four weeks of activities, four weeks of rest, and inally 12 more weeks of ac-tivities. After that the fourth assessment (A4) was performed. he A1-A2 period comprised 30 sessions, the A2-A3 period 48 sessions, and the A3-A4 period 45 sessions. he rest periods coincided with the workers’ vacation periods.
he sessions were held in groups of no more than 25 partici-pants, and the activities were standardized and agreed upon by the research team, which held monthly meetings. Each session consisted of 8-10 minutes of stretching of the major muscle groups (pectoral, latissimus dorsi, cervical paravertebral, and posterior and anterior thigh muscles); 9 minutes of aerobic ex-ercise ( fast walking); 7-10 minutes of adapted strength, power, and endurance training (with load determined by the partici-pants and increased as needed according to the supervisors); 14-16 minutes of coordination, agility, and lexibility exercises, and 5-7 minutes of respiratory and relaxation exercises. he sessions were performed three times a week.
Based on previous studies23, this activity protocol is in ac-cordance with recommended time and intensity parameters40, allowing control and quantiication of the activities performed overall and during each exercise. he sessions were super-vised by previously trained physical educators and physical therapists. he research team ensured that the participants performed the activities as correctly as possible and that the exercises were varied in order to keep them motivated, as sug-gested in the literature41.
Sample size
Sample size was determined with the ENE 3.0 (GlaxoSmith-Kline, London, UK) software. he calculations were based on detecting an efect size of 6.4s of the static balance, veriied by the One-Leg Stance Test with eyes open (Preintervention: 18.5s; Postintervention: 25.9s), with a standard deviation of 7.7s at postintervention data42, an α level of 5%, and a desired power of 90%. hese assumptions generated a desired sample size of at least 31 subjects per group.
Statistical analyses
Statistical analyses were conducted with the SPSS 19.0 package (SPSS, Chicago, IL). he means and standard de-viations or 95% Conidence Intervals (95%CI) for each of the outcome measures are shown. he Kolmogorov-Smirnov test showed normal distribution of the quantitative data (p>0.05). One-way repeated-measures ANOVA, with assessment (A1, A2, A3, A4) as the within-subject factor, was performed to ex-amine the efects of the intervention on the physical ability of the group (>60 yrs) and subgroups (60-65 yrs and >65 yrs). he Bonferroni test was used for post-hoc analysis between assess-ments A1-A2, A1-A3, and A1-A4. Within-subject comparisons (A1-A2, A1-A3, A1-A4) and comparisons between eicient and non-eicient individuals in the group and subgroup efect sizes were calculated using the Cohen index (d)43. An efect size greater than 0.8 was considered large, 0.5 moderate, and less than 0.2 small.
he operational research tool, Data Envelopment Analysis (DEA), was used to determine the relative eiciency of the participants, considered Decision-Making Units (DMUs)44-46. his analysis supports the hypothesis that the outputs do not need to be proportional to the inputs47. In this case, the inputs were the amount of time in days of strength, lexibility, and aerobic exercises, and the outputs were the levels of strength, lexibility, static balance, dynamic balance, and VO2max, veriied at the end of the physical activity program47,48. After that, an un-repeated Student-t test was employed to compare the results between eicient and non-eicient women for all variables
Efficiency of physical activity in older women
not considered outputs (BMI included) for each group and assessment. he statistical analysis was conducted at a 95% conidence level. A p value of less than 0.05 was considered statistically signiicant for all analyses.
Results
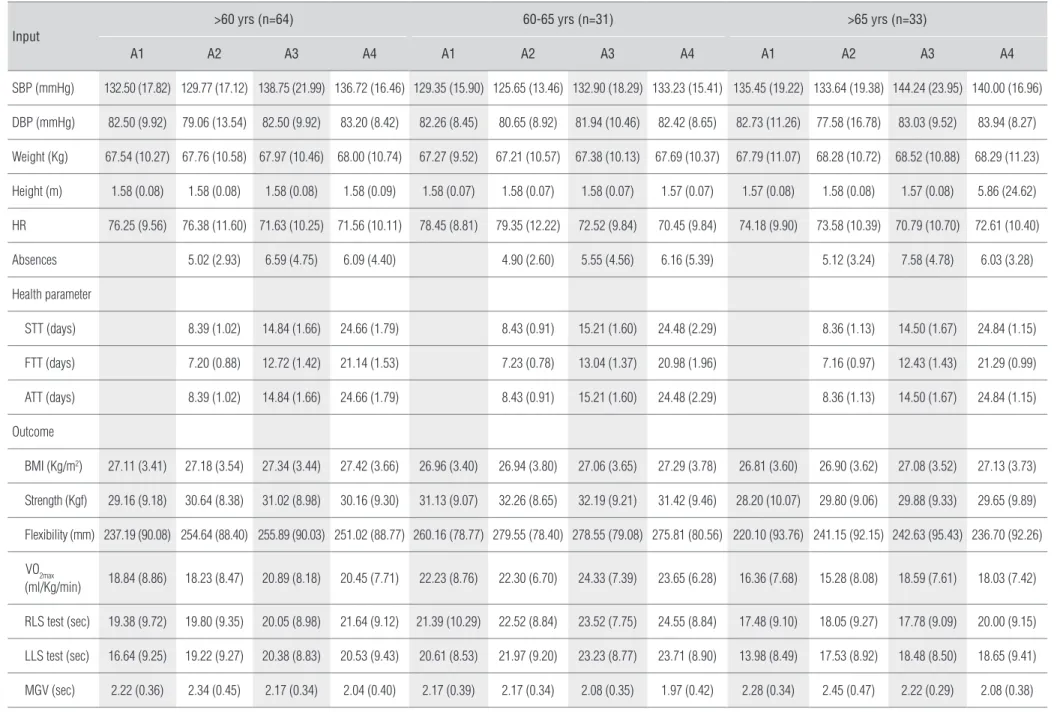
he descriptive results of the outcomes for the group and subgroups at the four assessments are shown in Table 1. he time spent on strength and aerobic endurance exercises was similar and, in all cases, longer than the time spent on stretch-ing exercises. Nevertheless, the activity program was more efective in changing lexibility than any other physical ability, when minimum, if the participants were categorized by age, i.e., 60-65 yrs and >65 yrs (more than 20 mm in some cases). In fact, dynamic and static balance, especially of the left limb, was another parameter strongly inluenced by physical activ-ity (4.67 seconds for the >65 yrs subgroup between A1 and A4) despite the fact that there were no exercises speciically aimed at recovering and preserving this ability.
Repeated-measures analyses and the Cohen index
of the group and subgroups
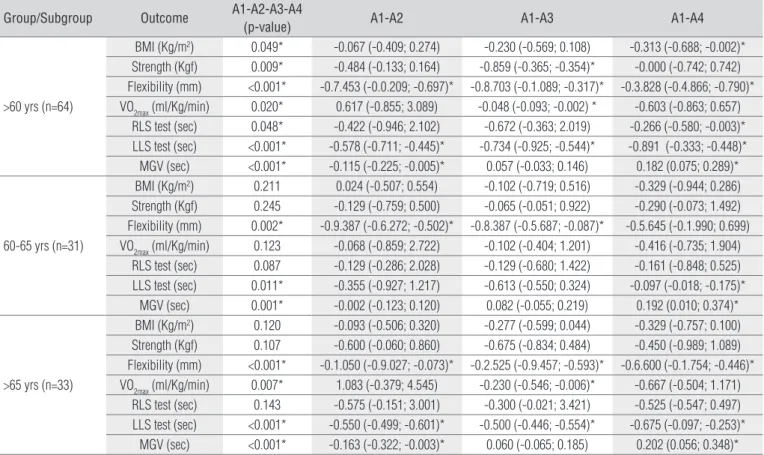
All physical variables in conjunction with BMI showed sta-tistically signiicant diferences in the ANOVA test for the total sample (>60 yrs group), pointing to an increase between assess-ments A1 and A3 in terms of strength, lexibility, and VO2max and a decrease in the last assessment (A4), breaking the trend even though the A3-A4 interval comprised more activity time on all types of exercise. When the subgroups were taken into account, the overall results showed a similar, albeit more heterogeneous, behavior. he more elderly subjects (>65 yrs) tended to generate more change in the ANOVA ( lexibility, left limb static balance, and maximum gait velocity showed p-values lower than 0.001). hese diferences were maintained in the post-hoc analysis: lex-ibility (A1-A2, A1-A3, A1-A4), VO2max (A1-A3), LLS test (A1-A2, A1- A3, A1-A4), and MGV (A1-A2, A1-A4) (Table 2).
he Cohen index did not show the same distribution of diferences found in the inferential analysis, indicating low or moderate values. Only the >65 yrs subgroup achieved moder-ate values (>0.5) with regard to balance, especially in the long term (A1-A4). BMI changed very little, with values lower than 0.1. Most of the variables showed size efects around 0.2 (small efect). In addition, some variables showed a negative efect in the A1-A2 period, VO2max being the most representative, in con-junction with dynamic balance, which decreased moderately, as in the ANOVA (Table 3).
Efficiency analysis (DEA) and Cohen index
of efficiency
he eiciency analysis showed two homogeneous types of behavior. First, considering the >60 yrs group, the A3 assessment aforded the smallest percentage of eicient women (Table 4), even though only the 60-65 yrs subgroup included a larger num-ber of eicient women at the end of the program (A4) than in the short term (A2). Second, the 60-65 yrs subgroup attained the largest number of eicient women in all three assessments (A2, A3, A4), which indicates that this age range beneits the most from the activities carried out although the efect sizes were not the largest nor did they constantly reach signiicance.
Apart from this initial analysis, we identiied the non-output variables that were diferent depending on individual eiciency or non-eiciency within the group and subgroups. his showed that age was the sole factor in the determination of diferences (p<0.05) in the >60 yrs group (A3: eicient = 65±4.1 years, non-eicient women = 68.62±5.89 years; A4: eicient women = 65±2.07 years, non-eicient women = 69.39±2.4 years) and in the >65 yrs subgroup (A3: eicient women = 68.22±2.82 years, non-eicient women = 71.55±4.93 years; A4: eicient women = 68.10±3.25 years, non-eicient women = 72.21±4.56 years) groups. he 60-65 yrs subgroup showed no dependence on the factors discussed and no diferences between the eicient and non-eicient women (p>0.05).
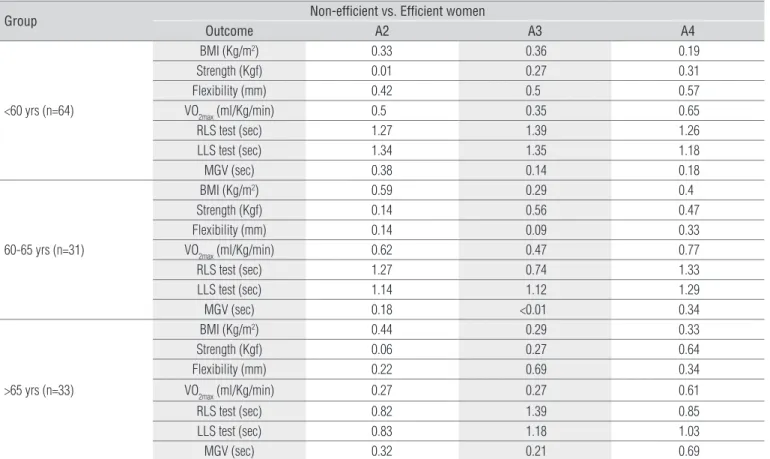
Finally, taking into account the group and subgroups, the behavior measured by the Cohen index of the eicient indi-viduals was much higher than that of non-eicient indiindi-viduals, especially in A2 and A4. In fact, variables such as static balance behaved very diferently among individuals, with large efects, several of them above one. Moderate efects were identiied for lexibility, oxygen consumption, and some BMI assessments. Both strength and dynamic balance showed small difer-ences between the eicient and non-eicient women, albeit with exceptions (MGV-A4, >65 yrs subgroup; strength-A3/A4, 60-65 yrs subgroup). he 60-65 yrs subgroup exhibited difer-ences between the eicient and non-eicient women from A2 onward, whereas older subjects (>65 yrs) took longer to exhibit signiicant beneits from the program only after A3 (Table 5).
Discussion
he results of this study indicate that prolonged adapted physical activity generates changes of diferent magnitudes and interpretations in older women. Likewise, for the older group of older women, age seems to be a determining fac-tor as regards program eiciency. Eiciency itself could be
331
Francisco Alburquerque-Sendín, Enzo Barberio-Mariano, Naja Brandao-Santana, Daisy A. N. R
ebelatto, José R. Rebelatto
Input
>60 yrs (n=64) 60-65 yrs (n=31) >65 yrs (n=33)
A1 A2 A3 A4 A1 A2 A3 A4 A1 A2 A3 A4
SBP (mmHg) 132.50 (17.82) 129.77 (17.12) 138.75 (21.99) 136.72 (16.46) 129.35 (15.90) 125.65 (13.46) 132.90 (18.29) 133.23 (15.41) 135.45 (19.22) 133.64 (19.38) 144.24 (23.95) 140.00 (16.96)
DBP (mmHg) 82.50 (9.92) 79.06 (13.54) 82.50 (9.92) 83.20 (8.42) 82.26 (8.45) 80.65 (8.92) 81.94 (10.46) 82.42 (8.65) 82.73 (11.26) 77.58 (16.78) 83.03 (9.52) 83.94 (8.27)
Weight (Kg) 67.54 (10.27) 67.76 (10.58) 67.97 (10.46) 68.00 (10.74) 67.27 (9.52) 67.21 (10.57) 67.38 (10.13) 67.69 (10.37) 67.79 (11.07) 68.28 (10.72) 68.52 (10.88) 68.29 (11.23)
Height (m) 1.58 (0.08) 1.58 (0.08) 1.58 (0.08) 1.58 (0.09) 1.58 (0.07) 1.58 (0.07) 1.58 (0.07) 1.57 (0.07) 1.57 (0.08) 1.58 (0.08) 1.57 (0.08) 5.86 (24.62)
HR 76.25 (9.56) 76.38 (11.60) 71.63 (10.25) 71.56 (10.11) 78.45 (8.81) 79.35 (12.22) 72.52 (9.84) 70.45 (9.84) 74.18 (9.90) 73.58 (10.39) 70.79 (10.70) 72.61 (10.40)
Absences 5.02 (2.93) 6.59 (4.75) 6.09 (4.40) 4.90 (2.60) 5.55 (4.56) 6.16 (5.39) 5.12 (3.24) 7.58 (4.78) 6.03 (3.28)
Health parameter
STT (days) 8.39 (1.02) 14.84 (1.66) 24.66 (1.79) 8.43 (0.91) 15.21 (1.60) 24.48 (2.29) 8.36 (1.13) 14.50 (1.67) 24.84 (1.15)
FTT (days) 7.20 (0.88) 12.72 (1.42) 21.14 (1.53) 7.23 (0.78) 13.04 (1.37) 20.98 (1.96) 7.16 (0.97) 12.43 (1.43) 21.29 (0.99)
ATT (days) 8.39 (1.02) 14.84 (1.66) 24.66 (1.79) 8.43 (0.91) 15.21 (1.60) 24.48 (2.29) 8.36 (1.13) 14.50 (1.67) 24.84 (1.15)
Outcome
BMI (Kg/m2) 27.11 (3.41) 27.18 (3.54) 27.34 (3.44) 27.42 (3.66) 26.96 (3.40) 26.94 (3.80) 27.06 (3.65) 27.29 (3.78) 26.81 (3.60) 26.90 (3.62) 27.08 (3.52) 27.13 (3.73)
Strength (Kgf) 29.16 (9.18) 30.64 (8.38) 31.02 (8.98) 30.16 (9.30) 31.13 (9.07) 32.26 (8.65) 32.19 (9.21) 31.42 (9.46) 28.20 (10.07) 29.80 (9.06) 29.88 (9.33) 29.65 (9.89)
Flexibility (mm) 237.19 (90.08) 254.64 (88.40) 255.89 (90.03) 251.02 (88.77) 260.16 (78.77) 279.55 (78.40) 278.55 (79.08) 275.81 (80.56) 220.10 (93.76) 241.15 (92.15) 242.63 (95.43) 236.70 (92.26)
VO2max
(ml/Kg/min) 18.84 (8.86) 18.23 (8.47) 20.89 (8.18) 20.45 (7.71) 22.23 (8.76) 22.30 (6.70) 24.33 (7.39) 23.65 (6.28) 16.36 (7.68) 15.28 (8.08) 18.59 (7.61) 18.03 (7.42)
RLS test (sec) 19.38 (9.72) 19.80 (9.35) 20.05 (8.98) 21.64 (9.12) 21.39 (10.29) 22.52 (8.84) 23.52 (7.75) 24.55 (8.84) 17.48 (9.10) 18.05 (9.27) 17.78 (9.09) 20.00 (9.15)
LLS test (sec) 16.64 (9.25) 19.22 (9.27) 20.38 (8.83) 20.53 (9.43) 20.61 (8.53) 21.97 (9.20) 23.23 (8.77) 23.71 (8.90) 13.98 (8.49) 17.53 (8.92) 18.48 (8.50) 18.65 (9.41)
MGV (sec) 2.22 (0.36) 2.34 (0.45) 2.17 (0.34) 2.04 (0.40) 2.17 (0.39) 2.17 (0.34) 2.08 (0.35) 1.97 (0.42) 2.28 (0.34) 2.45 (0.47) 2.22 (0.29) 2.08 (0.38)
Values are expressed as means (with standard deviations). SBP: Systolic blood pressure; DBP: Diastolic blood pressure; HR: Heart rate; STT: Strength training time; FTT: Flexibility training time; ATT: Aerobic training time; BMI: Body Mass Index; RLS time: right-leg standing time; LLS time: left-leg standing time; MGV: maximum gait velocity.
Table 1. Descriptive values of inputs, absences, health parameters, and outcomes by group, subgroups, and assessment.
Rev Bras Fisioter
Efficiency of physical activity in older women
Group/Subgroup Outcome A1-A2-A3-A4
(p-value) A1-A2 A1-A3 A1-A4
>60 yrs (n=64)
BMI (Kg/m2) 0.049* -0.067 (-0.409; 0.274) -0.230 (-0.569; 0.108) -0.313 (-0.688; -0.002)*
Strength (Kgf) 0.009* -0.484 (-0.133; 0.164) -0.859 (-0.365; -0.354)* -0.000 (-0.742; 0.742) Flexibility (mm) <0.001* -0.7.453 (-0.0.209; -0.697)* -0.8.703 (-0.1.089; -0.317)* -0.3.828 (-0.4.866; -0.790)* VO2max (ml/Kg/min) 0.020* 0.617 (-0.855; 3.089) -0.048 (-0.093; -0.002) * -0.603 (-0.863; 0.657)
RLS test (sec) 0.048* -0.422 (-0.946; 2.102) -0.672 (-0.363; 2.019) -0.266 (-0.580; -0.003)* LLS test (sec) <0.001* -0.578 (-0.711; -0.445)* -0.734 (-0.925; -0.544)* -0.891 (-0.333; -0.448)* MGV (sec) <0.001* -0.115 (-0.225; -0.005)* 0.057 (-0.033; 0.146) 0.182 (0.075; 0.289)*
60-65 yrs (n=31)
BMI (Kg/m2) 0.211 0.024 (-0.507; 0.554) -0.102 (-0.719; 0.516) -0.329 (-0.944; 0.286)
Strength (Kgf) 0.245 -0.129 (-0.759; 0.500) -0.065 (-0.051; 0.922) -0.290 (-0.073; 1.492) Flexibility (mm) 0.002* -0.9.387 (-0.6.272; -0.502)* -0.8.387 (-0.5.687; -0.087)* -0.5.645 (-0.1.990; 0.699) VO2max (ml/Kg/min) 0.123 -0.068 (-0.859; 2.722) -0.102 (-0.404; 1.201) -0.416 (-0.735; 1.904)
RLS test (sec) 0.087 -0.129 (-0.286; 2.028) -0.129 (-0.680; 1.422) -0.161 (-0.848; 0.525) LLS test (sec) 0.011* -0.355 (-0.927; 1.217) -0.613 (-0.550; 0.324) -0.097 (-0.018; -0.175)*
MGV (sec) 0.001* -0.002 (-0.123; 0.120) 0.082 (-0.055; 0.219) 0.192 (0.010; 0.374)*
>65 yrs (n=33)
BMI (Kg/m2) 0.120 -0.093 (-0.506; 0.320) -0.277 (-0.599; 0.044) -0.329 (-0.757; 0.100)
Strength (Kgf) 0.107 -0.600 (-0.060; 0.860) -0.675 (-0.834; 0.484) -0.450 (-0.989; 1.089) Flexibility (mm) <0.001* -0.1.050 (-0.9.027; -0.073)* -0.2.525 (-0.9.457; -0.593)* -0.6.600 (-0.1.754; -0.446)* VO2max (ml/Kg/min) 0.007* 1.083 (-0.379; 4.545) -0.230 (-0.546; -0.006)* -0.667 (-0.504; 1.171)
RLS test (sec) 0.143 -0.575 (-0.151; 3.001) -0.300 (-0.021; 3.421) -0.525 (-0.547; 0.497) LLS test (sec) <0.001* -0.550 (-0.499; -0.601)* -0.500 (-0.446; -0.554)* -0.675 (-0.097; -0.253)*
MGV (sec) <0.001* -0.163 (-0.322; -0.003)* 0.060 (-0.065; 0.185) 0.202 (0.056; 0.348)*
Table 2. Results of repeated-measures ANOVA by group and subgroups (post-hoc analysis: Bonferroni test).
Values of mean differences are expressed as difference (95% Confidence Interval). BMI: Body Mass Index; RLS time: right-leg standing time; LLS time: left-leg standing time; MGV: maximum gait velocity. * indicates statistical significance (p<0.05).
Group/Subgroup Outcome A1-A2 A1-A3 A1-A4
<60 yrs (n=64)
BMI (Kg/m2) 0.02 0.07 0.09
Strength (Kgf) 0.17 0.20 0.11
Flexibility (mm) 0.20 0.21 0.15 VO2max (ml/Kg/min) -0.07 0.24 0.19
RLS test (sec) 0.04 0.07 0.24
LLS test (sec) 0.28 0.41 0.42
MGV (sec) -0.28 0.16 0.48
60-65 yrs (n=31)
BMI (Kg/m2) -0.01 0.03 0.09
Strength (Kgf) 0.13 0.12 0.03
Flexibility (mm) 0.25 0.23 0.20 VO2max (ml/Kg/min) 0.01 0.26 0.19
RLS test (sec) 0.12 0.24 0.33
LLS test (sec) 0.15 0.30 0.36
MGV (sec) 0.00 0.22 0.47
>65 yrs (n=33)
BMI (Kg/m2) 0.03 0.08 0.09
Strength (Kgf) 0.17 0.17 0.15
Flexibility (mm) 0.23 0.24 0.18 VO2max (ml/Kg/min) -0.14 0.29 0.22
RLS test (sec) 0.06 0.03 0.28
LLS test (sec) 0.41 0.53 0.52
MGV (sec) -0.40 0.19 0.56
Table 3. Cohen index (d) for outcomes by group, subgroups and assessment.
The Cohen index was calculated as follows: d
repeated measures= (mean1 - mean2)/(pooled standard deviation/standard error of the difference). BMI: Body Mass Index; RLS time: right-leg standing time; LLS time: left-leg
standing time; MGV: maximum gait velocity.
333
>60 yrs (n=64) 60-65 yrs (n=31) >65 yrs (n=33)
A2 A3 A4 A2 A3 A4 A2 A3 A4
% efficient women 59% 47% 56% 68% 61% 81% 65% 45% 52.5% % non-efficient women 41% 53% 44% 32% 39% 19% 35% 55% 47.5%
Table 4. Percentage of efficient women by group, subgroups, and assessment.
Group Non-efficient vs. Efficient women
Outcome A2 A3 A4
<60 yrs (n=64)
BMI (Kg/m2) 0.33 0.36 0.19
Strength (Kgf) 0.01 0.27 0.31
Flexibility (mm) 0.42 0.5 0.57
VO2max (ml/Kg/min) 0.5 0.35 0.65
RLS test (sec) 1.27 1.39 1.26
LLS test (sec) 1.34 1.35 1.18
MGV (sec) 0.38 0.14 0.18
60-65 yrs (n=31)
BMI (Kg/m2) 0.59 0.29 0.4
Strength (Kgf) 0.14 0.56 0.47
Flexibility (mm) 0.14 0.09 0.33 VO2max (ml/Kg/min) 0.62 0.47 0.77
RLS test (sec) 1.27 0.74 1.33
LLS test (sec) 1.14 1.12 1.29
MGV (sec) 0.18 <0.01 0.34
>65 yrs (n=33)
BMI (Kg/m2) 0.44 0.29 0.33
Strength (Kgf) 0.06 0.27 0.64
Flexibility (mm) 0.22 0.69 0.34 VO2max (ml/Kg/min) 0.27 0.27 0.61
RLS test (sec) 0.82 1.39 0.85
LLS test (sec) 0.83 1.18 1.03
MGV (sec) 0.32 0.21 0.69
Table 5. Cohen index (d) for outcomes by group, subgroups and non-efficient/efficient subjects.
The Cohen index was calculated as follows: d
unrepeated measures=(mean1 - mean2)/pooled standard deviation. BMI: Body Mass Index; RLS time: right-leg standing time; LLS time: left-leg standing time; MGV: maximum
gait velocity.
an important diferentiator in terms of activity planning and dose determination.
In a general analysis, as mentioned above, the program was efective in reversing and mitigating changes due to aging10,49, contrary to what has been found by other authors in interventions aimed at reducing falls15. Nonetheless, one of the most interesting indings in this study comes from a diferent interpretation of the results according to the type of analysis in question, which may explain the controversies found in the literature14. Hence, inferential analysis identiied important changes in the older subgroup, especially with re-spect to lexibility, balance, and aerobic consumption in the short and long term. hese trends contrasted with the efect sizes, considered to be parameters of the highest clinical and practical applicability, in which as regards older individuals’ balance the changes were categorized as low or non-existent in the short term and only moderate in the long term. For this reason, it is even more important to plan the analysis properly
before interpreting the data, by establishing clear goals and managing clinical parameters13,50 and even calculation of the dose-response relationship51.
In this sense, the time of exposure to intervention has been identiied as another possible determinant of eiciency taking into account that, in some studies, the amount of physical activity did not reach the minimum recommended dose40. From this per-spective, it is possible to identify the beneits, in terms of eiciency, based on the amount of time spent on each type of exercise. In our study, the younger participants (60-65 yrs) showed higher ei-ciency, i.e. more individuals beneitted from the program, exerting less efort. he more elderly individuals needed more time on each type of exercise to be able to achieve beneicial changes.
In addition, the proportion of eicient individuals may de-crease over time in more elderly subjects (aged >65 yrs) or when the sample is not separated by age subgroups, the percentage of eicient individuals only being increased in the older women. his scenario casts doubt not only on the intensity and efectiveness of
Efficiency of physical activity in older women
physical activity, but also on the doses employed and the relative importance of the participants’ adherence to the program.
Also, the beneits, when minimum in terms of static bal-ance and aerobic consumption, may help to identify the women who will not proit from the physical activity program. hese elderly people may need a diferent type of intervention/ treatment if they belong to the same target population. It is therefore necessary to accurately identify participants’ adher-ence to the program as this can partly determine diferadher-ences in behavior among subjects.
Finally, with regard to the factors that distinguish eicient individuals from non-eicient individuals in the group and subgroups, only age had statistical signiicance, which may be in agreement with the need to take into account age divisions, both inter- and intra-group, when evaluating the efects of physi-cal activity on the elderly19, particularly individuals older than 65 years. he failure of measures such as weight or BMI in dif-ferentiating eiciency could support current evidence in favor of disregarding measures such as BMI as an indicator of risk of mortality in the elderly, with other factors, such as a sedentary lifestyle, being more important52.
hese results, in agreement with those of other authors53, suggest the importance of investigating the target popula-tion’s health needs, activity dose, and demographics before implementing programs, especially if diferences between population features have been identiied9,21,54. he estab-lishment of speciic groups of individuals may mitigate the discrepancy between ideal versions of programs and their practical implementation.
To our knowledge, this is the irst study to investigate the eiciency of an exercise program intended for older people. However, several limitations were detected. A sample consist-ing solely of women, as well as the impact of diferent sample sizes of the group and subgroups on statistical signiicance, partly mitigated by the Cohen index, may restrict the extrap-olation of our results. As mentioned, several interruptions
occurred along the intervention, but their inluence on the results was not determined because the participants’ physi-cal activity during this period was not assessed. Likewise, in spite of other studies having reported the permanence of changes achieved by the programs for long periods of time after their completion55,56, a follow-up investigation was not carried out after this program, which precludes any knowl-edge about how the changes found in participants’ physical capacity evolved. Finally, the absence of a control group reduces the internal validity of the present study, although randomized controlled trials cannot be considered the only source of scientiic evidence in complex interventions57 and other studies with similar designs have shown their ability to identify efects in the same target population49,58.
For these reasons, it seems necessary to conduct further research in order to carry out other efficiency measures with a view to determining the effects of these programs, studying the influence of other parameters, both physiologi-cal (body composition, oxidation) and cliniphysiologi-cal ( falls, fall-re-lated injuries), and determining dose-response relationship in specific populations.
Conclusions
Adapted physical activity is effective in changing the physical condition of older women. However, it is neces-sary to establish the activity dose and to standardize the analysis of results relative to the purpose of the study (e.g., determination of efficiency, clinical evaluation). In this sense, if physical activity is to be translated into health in older women, their age, both inter- and intra-groups, their adherence to the program, and the actual time they spend on each type of exercise should be taken into account. The DEA allows the assessment of the results of the time spent on physical activity in terms of health concerns.
References
1. IBGE. Breves notas sobre a mortalidade no Brasil no período 2000-2005. Rio de Janeiro: Instituto Brasileiro de Geografia Estatística; 2006.
2. Thelen DG, Wojcik LA, Schultz AB, Ashton-Miller JA, Alexander NB. Age differences in using a rapid step to regain balance during a forward fall. J Gerontol A Biol Sci Med Sci. 1997;52(1):M8-13.
3. Frontera WR, Hughes VA, Fielding RA, Fiatarone MA, Evans WJ, Roubenoff R. Aging of skeletal muscle: 12-yr longitudinal study. J Appl Physiol. 2000;88(4):1321-6.
4. Janssen I, Heymsfield SB, Wang ZM, Ross R. Skeletal muscle mass and distribution in 468 men and women aged 18-88 yr. J Appl Physiol. 2000;89(1):81-8.
5. de Jong N, Chin A Paw MJ, de Groot LCPG, de Graaf C, Kok FJ, van Staveren WA. Functional biochemical and nutrient indices in frail erderly people are partly affected by dietary supplements but not by exercise. J Nutr. 1999;129(11):2028-36.
6. Zhong S, Chen CN, Thompson LV. Sarcopenia of ageing: functional, structural and biochemical alterations. Rev Bras Fisioter. 2007;11(2):91-7.
7. Binder EF, Schechtman KB, Ehsani AA, Steger-May K, Brown M, Sinacore DR, et al. Effects of exercise training on frailty in community-dwelling older adults: results of a randomized, controlled trial. J Am Geriatr Soc. 2002;50(12):1921-8.
8. Ueno M, Kawai S, Mino T, Kamoshita H. Systematic review of fall-related factors among the house-dwelling elderly in Japan. Nihon Ronen Igakkai Zasshi. 2006;43(1):92-101.
9. Krause MP, Januário RS, Hallage T, Haile L, Miculis CP, Gama MP, et al. A comparison of functional fitness of older Brazilian and American women. J Aging Phys Act. 2009;17(4):387-97.
10. Polidori MC, Mecocci P, Cherubini A, Senin U. Physical activity and oxidative stress during aging. Int J Sports Med. 2000;21(3):154-7.
335
11. Hauer K, Becker C, Lindemann U, Beyer N. Effectiveness of physical training on motor performance and fall prevention in cognitively impaired older persons: a systemic review. Am J Phys Med Rehabil. 2006;85(10):847-57.
12. Sherrington C, Lord SR, Finch CF. Physical activity interventions to prevent falls among older people: update of the evidence. J Sci Med Sport. 2004;7(1 Suppl):43-51.
13. Gillespie LD, Robertson MC, Gillespie WJ, Lamb SE, Gates S, Cumming RG, et al. Interventions for preventing falls in older people living in the community. Cochrane Database Syst Rev. 2009(2):CD007146.
14. Bleijlevens MH, Hendriks MR, van Haastregt JC, van Rossum E, Kempen GI, Diederiks JP, et al. Process factors explaining the ineffectiveness of a multidisciplinary fall prevention programme: a process evaluation. BMC Public Health. 2008;24(8):332.
15. Baker MK, Atlantis E, Fiatarone Singh MA. Multi-modal exercise programs for older adults. Age Ageing. 2007;36(4):375-81.
16. Tinetti ME. Multifactorial fall-prevention strategies: time to retreat or advance. J Am Geriatr Soc. 2008;56(8):1563-5.
17. Lee DC, Sui X, Blair SN. Does physical activity ameliorate the health hazards of obesity? Br J Sports Med. 2009;43(1):49-51.
18. Campbell AJ, Robertson MC. Not a retreat, but advancing on numerous fronts. J Am Geriatr Soc. 2009;57(3):565-7.
19. Conn VS, Minor MA, Burks KJ, Rantz MJ, Pomeroy SH. Integrative review of physical activity intervention research with aging adults. J Am Geriatr Soc. 2003;51(8):1159-68.
20. Laine J, Finne-Soveri UH, Björkgren M, Linna M, Noro A, Häkkinen U. The association between quality of care and technical efficiency in long-term care. Int J Qual Health Care. 2005;17(3): 259-67.
21. IBGE. Perfil dos idosos responsáveis pelos domicílios no Brasil-2000. Rio de Janeiro: Instituto Brasileiro de Geografia e Estatística; 2002.
22. WHO. Report of a WHO Expert Committee Technical Report Series, No 854. Physical status: the use and interpretation of anthropometry. Geneva: World Health Organization; 1995.
23. Greve P, Wanderley F, Rebelatto JR. The effects of periodic interruptions of physical activities on the physical capacities of adult active women. Arch Gerontol Geriatr. 2009;49(2):268-71.
24. Vaz M, Hunsberger S, Diffey B. Prediction equations for handgrip strength in healthy Indian male and female subjects encompassing a wide age range. Ann Hum Biol. 2002;29(2):131-41.
25. Massy-Westropp NM, Gill TK, Taylor AW, Bohannon RW, Hill CL. Hand Grip Strength: age and gender stratified normative data in a population-based study. BMC Res Notes. 2011; 14(4):127.
26. Fess EE. Grip strength. In: Casanova JS, editor. Clinical assessment recommendations. 2nd ed.
Chicago: American Society of Hand Therapists; 1992. p. 41-5.
27. Peolsson A, Hedlund R, Oberg B. Intra- and inter-tester reliability and reference values for hand strength. J Rehabil Med. 2001;33(1):36-41.
28. Chung PK, Yuen CK. Criterion-related validity of sit-and-reach tests in university men in Hong Kong. Percept Mot Skills. 1999;88(1):304-16.
29. Baltaci G, Un V, Tunay N, Besler A, Gerçeker S. Comparison of three different sit and reach tests for measurement of hamstring flexibility in female university students. Br J Sports Med. 2003;37(1):59-61.
30. Shaulis D, Golding LA, Tandy RD. Reliability of the AAHPERD functional fitness assessment across multiple practice sessions in older men and women. J Aging Phys Act. 1994;2(3):273-9.
31. Hurvitz EA, Richardson JK, Werner RA, Ruhl AM, Dixon MR. Unipedal stance testing as an indicator of fall risk among older outpatients. Arch Phys Med Rehabil. 2000;81(5):587-91.
32. Lin MR, Hwang HF, Hu MH, Wu HD, Wang YW, Huang FC. Psychometric comparisons of the timed up and go, one-leg stand, functional reach, and Tinetti balance measures in community-dwelling older people. J Am Geriatr Soc. 2004;52(8):1343-8.
33. Aveiro MC, Granito RN, Navega MT, Driusso P, Oishi J. Influence of a physical training program muscle strength, balance and gait velocity among women with osteoporosis. Rev Bras Fisioter. 2006;10(4):441-8.
34. Matsudo SM, Matsudo VKR, Barros Neto TL, Araújo TL. Evolução do perfil neuromotor e capacidade funcional de mulheres fisicamente ativas de acordo com a idade cronológica. Rev Bras Med Esporte. 2003;9(6):365-76.
35. Oberg T, Karsznia A, Oberg K. Basic gait parameters: reference data for normal subjects, 10-79 years of age. J Rehabil Res Dev. 1993;30(2):210-23.
36. Kline GM, Porcari JP, Hintermeister R, Freedson PS, Ward A, McCarron RF, et al. Estimation of VO2max from a one-mile track walk, gender, age, and body weight. Med Sci Sports Exerc. 1987;19(3):253-9.
37. Fenstermaker KL, Plowman SA, Looney MA. Validation of the Rockport Fitness Walking Test in females 65 years and older. Res Q Exerc Sport. 1992;63(3):322-7.
38. O’Hanley S, Ward A, Zwiren L, McCarron R, Ross J, Rippe J. Validation of a one-mile walk test in 70-79 year olds. Med Sci Sports Exerc. 1987;19(Suppl 2):28.
39. Pickering TG, Hall JE, Appel LJ, Falkner BE, Graves J, Hill MN, et al. Recommendations for blood pressure measurement in humans and experimental animals: part 1: blood pressure measurement in humans: a statement for professionals from the Subcommittee of Professional and Public Education of the American Heart Association Council on High Blood Pressure Research. Circulation. 2005;111(5):697-716.
40. Kruger J, Buchner DM, Prohaska TR. The prescribed amount of physical activity in randomized clinical trials in older adults. Gerontologist. 2009;49(Suppl 1):S100-7.
41. Rebelatto JR, Morelli JG. Fisioterapia Geriátrica. 2nd ed. São Paulo: Manole; 2007.
42. Kawanabe K, Kawashima A, Sashimoto I, Takeda T, Sato Y, Iwamoto J. Effect of whole-body vibration exercise and muscle strengthening, balance, and walking exercises on walking ability in the elderly. Keio J Med. 2007;56(1):28-33.
43. Cohen J. Statistical Power Analysis for the Behavioral Sciences. 2nd ed. Hillsdale, NJ: Lawrence
Erlbaum Associates; 1988.
44. Banker RD, Conrad RF, Strauss RP. A comparative application of data envelopment analysis and translog methods: an illustrative study of hospital production. Management Science. 1986;32(2):30-44.
45. Charnes A, Cooper WW, Rhodes E. Measuring the efficiency of decision making units. Eur J Oper Res. 1978;2(6):429-44.
46. Sherman HD. Hospital efficiency measurement and evaluation. Empirical test of a new technique. Med Care. 1984;22(10):922-38.
47. Cooper WW, Sieford L, Tone K. Data envelopment analysis. A comprehensive text with models, applications, reference and DEA-Solver software. Boston: Kluwer Academic Publishers; 2000.
48. Banker RD, Charnes A, Cooper WW. Some models for estimating technical and scale inefficiencies in data envelopment analysis. Management Science. 1984;30(9):1078-92.
49. Rebelatto JR, Castro AP. Effect of the adult revitalization program on the occurrence of falls among its participants. Rev Bras Fisioter. 2007;11(5):383-90.
50. Lord SR, Castell S, Corcoran J, Dayhew J, Matters B, Shan A, et al. The effect of group exercise on physical functioning and falls in frail older people living in retirement villages: a randomized, controlled trial. J Am Geriatr Soc. 2003;51(12):1685-92.
51. Radak Z, Chung HY, Koltai E, Taylor AW, Goto S. Exercise, oxidative stress and hormesis. Ageing Res Rev. 2008;7(1):34-42.
52. Flicker L, McCaul KA, Hankey GJ, Jamrozik K, Brown WJ, Byles JE, et al. Body mass index and survival in men and women aged 70 to 75. J Am Geriatr Soc. 2010;58(2):234-41.
53. Hendriks MR, Bleijlevens MH, van Haastregt JC, Crebolder HF, Diederiks JP, Evers SM, et al. Lack of effectiveness of a multidisciplinary fall-prevention program in elderly people at risk: a randomized, controlled trial. J Am Geriatr Soc. 2008;56(8):1390-7.
54. Vogel T, Brechat PH, Leprêtre PM, Kaltenbach G, Berthel M, Lonsdorfer J. Health benefits of physical activity in older patients: a review. Int J Clin Pract. 2009;63(2):303-20.
55. Ivey FM, Tracy Bl, Lemmer JT, NessAiver M, Metter EJ, Fozard JL, et al. Effects of strength training and detraining on muscle quality: age and gender comparisons. J Gerontol A Biol Sci Med Sci. 2000;55(3):B152-9.
56. Lemmer JT, Hurlbut DE, Martel GF, Tracy BL, Ivey FM, Metter EJ, et al. Age and gender responses to strength training and detraining. Med Sci Sports Exerc. 2000;32(8):1505-12.
57. Milanese S. The use of RCT’s in manual therapy - are we trying to fit a round peg into a square hole? Man Ther. 2011;16(4):403-5.
58. Rebelatto JR, Calvo JI, Orejuela JR, Portillo JC. Influence of a long-term physical activity program on hand muscle strength and body flexibility among elderly women. Rev Bras Fisioter. 2006;10(1):127-32.