Article
J. Braz. Chem. Soc., Vol. 26, No. 10, 2029-2034, 2015. Printed in Brazil - ©2015 Sociedade Brasileira de Química 0103 - 5053 $6.00+0.00
A
*e-mail: [email protected]
Use of an Automatic System in the Preparation of Gas Mixtures for Multivariate
Calibration: A Case Study Involving NIR Analysis of Natural Gas
Mayara F. Barbosa,a Hebertty V. Dantas,a Pablo N. T. Moreira,a Roberto K. H. Galvãob
and Mário C. U. Araújo*,a
aLaboratório de Automação e Instrumentação em Química Analítica/Quimiometria (LAQA),
Departamento de Química, Universidade Federal da Paraíba, Caixa Postal 5093, 58051-970 João Pessoa-PB, Brazil
bDivisão de Engenharia Eletrônica, Instituto Tecnológico de Aeronáutica,
12228-900 São José dos Campos-SP, Brazil
This paper investigates the use of an automatic system for preparation of gas mixtures in a multivariate calibration problem involving near-infrared (NIR) spectrometric analysis of natural gas. The automatic system is used to prepare calibration mixtures according to a Brereton experimental design, in order to exploit a suitable range of gas concentrations and thus avoid extrapolations in the predictions. These mixtures were employed to build partial-least-squares models for NIR determination of methane, ethane and propane, which are the major components of natural gas. Prediction performance was evaluated by using a separate set of prepared mixtures and natural gas samples with composition analyzed by gas chromatography, as well as a group of certified mixtures. The resulting root-mean-square errors of prediction (RMSEP) values for methane, ethane and propane (3.0, 0.9 and 1.2% mol mol−1, respectively) were approximately 10 times smaller than the corresponding calibration ranges, with correlations of 0.91, 0.96 and 0.86 between the predicted and reference values.
Keywords: natural gas analysis, automatic system for preparation of gas mixtures, multivariate
calibration, NIR spectrometry, gas chromatography
Introduction
The analysis of chemical composition of gas samples is usually carried out by using gas chromatography (GC), which allows accurate determinations of individual gas components even in complex matrices. The widespread use of GC is motivated by the minimization of interference effects as the result of the separation in the chromatographic column.1 However, the operational costs related to the
use of consumables and the low sample throughput associated to the time required by the separation process are inconveniences that should be taken into account. In this context, spectrometric techniques have been proposed as a faster and less costly alternative for gas analysis,2-4 provided
that multivariate calibration is used to compensate for the absence of a separation process.5
Multivariate calibration methods are aimed at obtaining a mathematical model that relates the instrumental
measurements with the chemical composition of the sample. For this purpose, the analyst must gather a representative set of calibration samples with known composition. In the case of gas analysis, calibration mixtures with certified composition can be acquired from specialized suppliers. However, the acquisition of these mixtures can be expensive, which escapes the purpose of using a less costly alternative to GC. Alternatively, real samples with composition determined by GC can be used to build the multivariate calibration model, but the variability in the composition of these samples may not be large enough to build an appropriate model.6 A third alternative consists of
the preparation of gas mixtures in the analytical laboratory from individual gas components. In this case, a mixing system with suitable accuracy would need to be employed.
In this context, the present work investigates the use of an automatic system for accurate preparation of gas mixtures, which was proposed in a recent paper7 as an
system comprises a set of gas admission valves which are controlled in an automatic manner to achieve the desired partial pressures for each component of the mixture. A piston-driven diaphragm pump is used to circulate the mixture within the system in order to obtain an appropriate homogenization. In Dantas et al.,7 the operation of the
system was validated by preparing binary mixtures of nitrogen with methane, ethane or propane. As a result, the programmed molar fractions of the component gases in the prepared mixtures were found to be in good agreement with the results of GC analysis. However, the system was not tested in an actual application involving the preparation of gas mixtures for multivariate calibration. Within this scope, the present investigation is aimed at demonstrating the applicability of this automatic system in an actual analytical problem involving the simultaneous determination of the major components in natural gas samples by using near-infrared (NIR) spectrometry and multivariate calibration. Natural gas (NG) is mainly composed by methane (CH4)
and heavier hydrocarbons, especially ethane (C2H6) and
propane (C3H8).9 The development of analytical methods
for quality control of this fuel has become an important issue,10 in view of the growing demand for domestic,
commercial, industrial, utility and vehicular use of NG, motivated by both economic gains and environmental impact.11,12 Within this scope, NIR spectrometry has been
proposed as an attractive alternative to the use of GC, with advantages including reduced analysis time and little sample preparation2,13 in addition to the possibility of
deploying portable field instruments.5 More specifically, the
use of NIR spectrometry has been reported for screening analysis8 and determination of the calorific value of NG.14 In
a broader scope, applications have also been reported in the context of screening analysis of liquefied petroleum gas15
and quantitative analysis of gases in hydrocarbon mixtures.4
In this work, a partial-least-squares (PLS) model16,17 for
NIR spectrometric determination of methane, ethane and propane was built by using quaternary mixtures of these gases with nitrogen, which were prepared by the automatic system according to a Brereton experimental design.18
The prediction performance of the resulting model was evaluated by using a separate set of prepared mixtures, as well as three gas mixtures with certified composition and eight actual NG samples for vehicular use.
Experimental
Samples
Methane (99.9%), ethane (99.0%), propane (99.5%), nitrogen (99.9%) and three mixtures of these gases, with
certified composition, were acquired from Linde Gas. The certified mixtures were designed in order to simulate the composition of natural gas samples. All gas contents indicated herein are expressed in % mol mol−1. In addition,
eight real NG samples were acquired at 220 bar from vehicle fuelling stations in the city of João Pessoa (Paraíba, Brazil). These samples were collected by using a lab-made sampling cylinder described elsewhere.8
The Brereton algorithm18 was employed to design
67 mixtures of methane, ethane and propane, with concentrations in the range of 62.5-100, 0-17.1 and 0-11.1% mol mol−1, respectively. These ranges encompass
the minimum and maximum values stated in the technical regulations of the Brazilian fuel authority concerning the quality of NG.19 The Brereton algorithm is aimed at
obtaining an orthogonal design of appropriate variability with a reduced number of experiments, which is convenient to reduce the experimental workload.20 The molar
concentrations resulting from the Brereton design were converted to partial pressures. Nitrogen was used as diluent to complete the mixtures up to a total pressure of 2.00 bar (see Supplementary Information (SI) section).
After the NIR spectra of the 67 prepared mixtures were recorded, the Kennard-Stone algorithm21 was employed
to select 45 of these mixtures for use in the calibration of the PLS model. This algorithm is aimed at choosing a representative subset of samples in a near-uniform manner in the space of spectral variables, by avoiding the selection of samples with similar spectra. The remaining 22 mixtures were used as a separate prediction set, together with the 3 mixtures of certified composition and the 8 real NG samples. The composition of these 33 prediction samples was analyzed by GC, in order to evaluate the predictive ability of the PLS model.
Apparatus
Figure 1A presents a schematic diagram of the automatic system, which was used for preparation of the gas mixtures, as well as the sampling of the certified mixtures and real NG samples. Details of the construction and operation of the system are presented in Dantas et al.7
The apparatus also included a gas flow system to introduce the samples in a NIR cell for spectral acquisition, as described elsewhere.8 In addition, the system was
connected to a gas chromatograph for the analysis of the prediction samples.
The NIR spectra of the samples were acquired by using an FTIR Analyzer (AIT, Analect Diamond 20) in the range 4,000-12,000 cm−1 as the average of 16 scans with
the NIR flow cell at a pressure of 1.5 bar. The overall time required by the NIR analysis was one minute per sample.
The experimental procedures were carried out in a laboratory environment with air conditioning (split configuration) and dehumidifier units for temperature and humidity control. The temperature and relative humidity were controlled during the analyses in order to remain within the ranges of 23 ± 1 °C and 55 ± 1%, respectively.
The gas mixing system is not fitted with internal temperature sensors. However, the internal pressure is controlled by using a digital manometer with precision of ± 0.001 bar. The pressure measurements provided by the digital manometer are employed by the system software to control the admission of the components of the gas mixture, in order to achieve partial pressures corresponding to the desired molar fractions (% mol mol−1). Changes in the
internal temperature of the system will not affect the results in a significant manner, because the preparation of the gas mixtures is based on the actual pressure values.
The GC analyses were carried out by using a gas chromatograph (GC-2014, Shimadzu) using a 30-meter
capillary column (GC-GASPRO) with internal diameter of 0.32 mm. The GC injections were performed in split mode (1:100) at a temperature of 240 °C by using a sampling valve (Valco E60) with a 25 microliter loop. Helium was used as carrier gas with a flow rate of 1.4 mL min−1. All
analyses were carried out in isothermal mode with the column temperature at 90 °C. A flame ionization detector (FID) was employed with temperature set at 250 °C. The total analysis time per run was 10 min.
Software
Spectral preprocessing, principal component analysis and PLS modelling were carried out by using The Unscrambler 9.7 (CAMO S.A.). The optimal number of factors for each PLS model was determined by using cross-validation with the default settings of the software package. The Kennard-Stone algorithm was implemented in Matlab R2010b.
Results and Discussion
After a preliminary inspection of the NIR spectra, the range 4,000-6,500 cm–1 was selected in view of its large
signal-to-noise ratio compared to other spectral regions. The intervals 4,000-4,600 cm–1 and 5,500-6,500 cm–1
correspond to combination bands and first overtones of CH, CH2, CH3 related to the main hydrocarbons (methane,
ethane, propane) of the gas samples.22,23
Figure 2a presents the NIR spectra of three mixtures prepared in this study. In order to remove the baseline features, first-derivative spectra were obtained by using the Savitzky-Golay method with a 2nd order polynomial
and a 3-point window. Figure 2b shows the resulting derivative spectra, which were used in all the subsequent calculations.
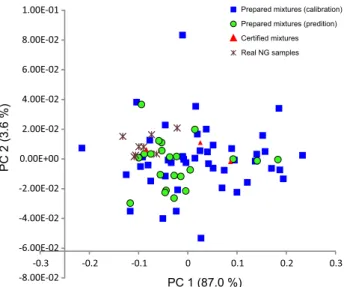
An exploratory analysis of the spectral data was carried out by using principal component analysis (PCA). As can be seen in Figure 3, the 45 calibration samples form an adequate envelope around the prediction samples (22 prepared mixtures + 3 certified mixtures + 8 real NG samples), which is convenient to avoid extrapolations in the model predictions. Indeed, this is the main motivation for calibrating the PLS model with prepared mixtures instead of real samples, which display a much smaller variability in the PC score plot.
The PLS models for methane, ethane and propane were built by using 1, 4 and 5 factors, respectively. The three elliptical joint confidence regions (EJCRs) (obtained on the basis of a linear regression between the reference and predicted gas concentrations) are presented in Figure 4, Figure 1. Schematic diagram (A) and photograph (B) of the automatic
reference values (certified values for the 3 certified mixtures and GC results for the 22 prepared mixtures and 8 real NG samples). It is worth noting that the PLS model was built by using calibration mixtures prepared by the automatic system, according to the composition defined by the Brereton design. Therefore, the GC analysis was not needed in the multivariate calibration process. In the prediction phase, the results associated to reference values smaller than LOQ were not considered, since the model predictions are not reliable in this case.
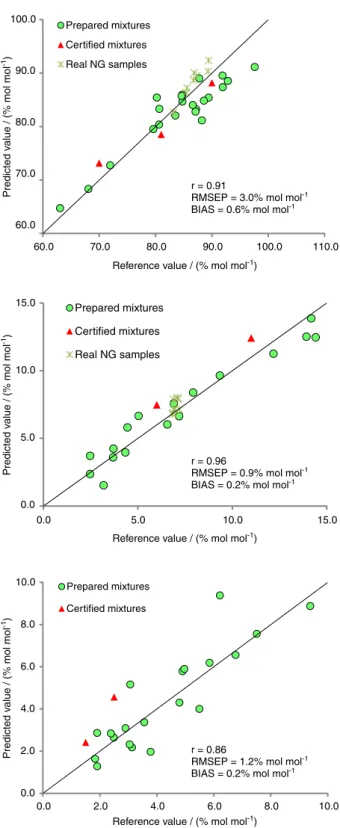
As can be seen in Figure 5, there is no systematic error, since the results are distributed on both sides of the bisectrix lines. As indicated in the graphs, the root-mean-square errors of prediction (RMSEP) for methane, ethane and propane were 3.0, 0.9 and 1.2% mol mol−1,
respectively. These values are approximately 10 times smaller than the corresponding calibration ranges, which were 62.5-100, 0-17.1 and 0-11.1% mol mol−1. The bias
values were also small (0.6, 0.2 and 0.2% mol mol−1 for
methane, ethane and propane, respectively). In relative terms, the worst result was obtained for propane, which is also reflected in a slightly smaller value for the correlation r between predicted and reference values (also indicated in the graphs). This finding may be ascribed to the smaller concentration range of propane compared to the other Figure 2. (a) NIR spectra (4000-6500 cm−1) of three mixtures prepared
in this study; (b) derivative spectra.
Figure 3. PC1 × PC2 score plot of the data set. The variance explained by each principal component is indicated at the corresponding axis.
for a confidence level of 95%. All the EJCRs contain the ideal intersection point (slope = 1, intercept = 0), which indicates that the bias in the PLS model predictions was not significant.24 The precision, limit of detection (LOD)
and limit of quantification (LOQ) for each analyte are presented in Table 1.
Figure 5 presents a comparison of the prediction results provided by the PLS models and the corresponding
Table 1. Figures of merit for the methane, ethane and propane models
Model LOD /
(% mol mol−1)
LOQ / (% mol mol−1)
Precision / (% mol mol−1)
Methane 1.0 3.0 0.9
Ethane 0.6 1.9 0.1
Propane 0.4 1.3 0.3
LOQ: limit of quantification; LOD: limit of detection.
two gases. Finally, it is worth noting that the prediction errors for the certified mixtures and real NG samples are comparable to the errors obtained for the prepared mixtures.
Conclusions
This paper investigated the use of an automatic system for preparation of gas mixtures in a multivariate calibration problem involving NIR spectrometric analysis of natural gas. The use of prepared calibration mixtures is of value to form an adequate envelope around the samples to be analyzed, which is convenient to avoid extrapolations in the model predictions. For this purpose, the automatic system is convenient to reduce the manual workload in the preparation of the mixtures and to minimize the possibility of human errors.
The NIR spectra of 45 prepared mixtures in the range 4,000-6,500 cm−1 was employed to build PLS models for
determination of methane, ethane and propane, which are the major components of natural gas. The prediction performance of the resulting models was evaluated by using a separate set of 22 prepared mixtures and 8 natural gas samples, with composition analyzed by gas chromatography, as well as 3 certified mixtures. Only the results associated to reference values larger than the limit of quantification were considered.The resulting RMSEP values for methane, ethane and propane (3.0, 0.9 and 1.2% mol mol−1, respectively)
were approximately 10 times smaller than the corresponding calibration ranges, with correlations of 0.91, 0.96 and 0.86 between the predicted and reference values. No systematic error was observed. In addition, the prediction errors for the certified mixtures and real NG samples were comparable to the errors obtained for the prepared mixtures. The results of this investigation reveal that the automatic system for preparation of gas mixtures is indeed of value for use in multivariate calibration applications.
Supplementary Information
Supplementary data (tables of concentrations of the components in the mixtures) are available free of charge at http://jbcs.sbq.org.br as PDF file.
Acknowledgements
The authors acknowledge the support of CNPq (research fellowships, postdoctoral PNPD grant 558932/2008-8 and INCTAA grant 573894/2008-6) and CAPES (DSc and MSc studentships).
References
1. Poole, C.; Gas Chromatography; Elsevier: Oxford, 2012. 2. Gao, X.; Fan, H.; Huang, T.; Wang, X.; Bao, J.; Li, X.;
Huang, W.; Zhang, W.; Spectrochim. Acta, Part A2006, 65, 133.
60.0 70.0 80.0 90.0 100.0
60.0 70.0 80.0 90.0 100.0 110.0
Prepared mixtures
Certified mixtures
Real NG samples
r = 0.91
RMSEP = 3.0% mol mol-1
-1 BIAS = 0.6% mol mol
r = 0.96
RMSEP = 0.9% mol mol-1
-1 BIAS = 0.2% mol mol
r = 0.86
RMSEP = 1.2% mol mol-1
-1 BIAS = 0.2% mol mol 0.0
5.0 10.0 15.0
0.0 5.0 10.0 15.0
Prepared mixtures
Certified mixtures
Real NG samples
0.0 2.0 4.0 6.0 8.0 10.0
0.0 2.0 4.0 6.0 8.0 10.0
Predicted v
alue / (% mol mol
)
-1
Predicted v
alue / (% mol mol
)
-1
Predicted v
alue / (% mol mol
)
-1
Reference value / (% mol mol )-1
Reference value / (% mol mol )-1
Reference value / (% mol mol )-1
Prepared mixtures
Certified mixtures
Figure 5. Comparison of the prediction results provided by the PLS models and the corresponding reference values for methane (a); ethane (b) and propane (c). The root-mean-square error of prediction (RMSEP), bias and the correlation between predicted and reference values (r) is indicated in each case. Only the results associated to reference values larger than LOQ are presented.
60.0 70.0 80.0 90.0 100.0
60.0 70.0 80.0 90.0 100.0 110.0
Prepared mixtures
Certified mixtures
Real NG samples
r = 0.91
RMSEP = 3.0% mol mol-1 -1 BIAS = 0.6% mol mol
r = 0.96
RMSEP = 0.9% mol mol-1 -1 BIAS = 0.2% mol mol
r = 0.86
RMSEP = 1.2% mol mol-1 -1 BIAS = 0.2% mol mol 0.0
5.0 10.0 15.0
0.0 5.0 10.0 15.0
Prepared mixtures
Certified mixtures
Real NG samples
0.0 2.0 4.0 6.0 8.0 10.0
0.0 2.0 4.0 6.0 8.0 10.0
Predicted v
alue / (% mol mol
)
-1
Predicted v
alue / (% mol mol
)
-1
Predicted v
alue / (% mol mol
)
-1
Reference value / (% mol mol )-1 Reference value / (% mol mol )-1 Reference value / (% mol mol )-1
Prepared mixtures
3. Zhou, J.; Brown, C. W.; Soc. Appl. Spec.2001, 55, 44. 4. Nakhoukhi, M.; Péré, E.; Creff, R.; Pouchan, C.; J. Mol. Struct.
2005, 744, 855.
5. Rohwedder, J. J. R.; Pasquini, C.; Fortes, P. R.; Raimundo, I. M.; Wilk, A.; Mizaikoff, B.; Analyst2014, 139, 3572. 6. ASTM E1655-05: Standard Practices for Infrared Multivariate
Quantitative Analysis, Washington, 2005.
7. Dantas, H. V.; Barbosa, M. F.; Moreira, P. N. T.; Galvão, R. K. H.; Araújo, M. C. U.; Microchem. J.2015, 119, 123. 8. Dantas, H. V.; Barbosa, M. F.; Nascimento, E. C. L.; Moreira,
P. N. T.; Galvão, R. K. H.; Araújo, M. C. U.; Microchem. J.
2014, 114, 210.
9. Kakaee, A. H.; Paykani, A.; Ghajar, M.; Renewable Sustainable Energy Rev.2014, 38, 64.
10. Gallagher, J. E.; Natural Gas Measurement Handbook, Gulf Publishing Company: Houston, 2006.
11. http://www.eia.gov/forecasts/aeo/pdf/0383(2014).pdf accessed on July 2015.
12. Liu, Y.; Yeom, J.; Chung, S.; Math. Comput. Model. 2013, 57, 228.
13. Reboucas, M. V.; Santos, J. B.; Domingos, D.; Massa, A. R. C. G.; Vib. Spectrosc. 2010, 52, 97.
14. Brown, C. W.; Lo, S. C.; Soc. Appl. Spec. 1993, 47, 812.
15. Dantas, H. V.; Barbosa, M. F.; Nascimento, E. C. L.; Galvão, R. K. H.; Araújo, M. C. U.; Talanta2013, 106, 158.
16. Beebe, K. R.; Pell, R. J.; Seasholtz, M. B.; Chemometrics -
A Pratical Guide; Wiley: New York, 1998.
17. Davies, A. M. C.; Spectrosc. Eur.2006, 18, 23. 18. Brereton, R. G.; Analyst 1997, 122, 1521.
19. http://nxt.anp.gov.br/nxt/gateway.dll/leg/resolucoes_anp/2008/ junho/ranp%2016%20-%202008.xml accessed on July 2015. 20. Brereton, R. G.; Chemometrics: Data Analysis for the
Laboratory and Chemical Plant; Wiley: Chichester, 2003.
21. Kennard, R. W.; Stone, L. A.; Technometrics1969, 11, 137. 22. Rest, A. J.; Warren, R.; Murray, S. C.; Appl. Spectrosc. 1996,
50, 517.
23. Rest, A. J.; Warren, R.; Murray, S. C.; Spectrochim. Acta, Part A
1996, 52, 1455.
24. Olivieri, A. C.; Goicoechea, H. C.; Inon, F. A.; Chemom. Intell. Lab. Syst. 2004, 73, 189.
Submitted: March 30, 2015
Published online: July 24, 2015