207
Abstract
The Santa Rita Mine, located in the State of Bahia, was the irst Mirabela Min-eração operation in Brazil.
Started in 2009, the nickel sulphide processing plant has undergone constant modiications, aiming to adapt to the changes in the ore. Main modiications included autogenous grinding converted to semi-autogenous, as well as the installation of a desliming stage aiming to remove ultraine minerals which reduced the nickel recovery in lotation.
A full survey and ore characterization campaign was carried out to assess alter-natives for increasing grinding circuit capacity. Experimental data were balanced and used to calibrate mathematical models which were the basis for simulation exercises.
This paper describes the main aspects related to circuit modeling and simulation, as well as assessing alternatives for increasing the grinding circuit capacity.
Keywords: grinding, simulation, nickel.
Luiz Tavares dos Santos Junior
MSc em Engenharia de Minas,
Coordenador de Processos e Desenvolvimento Tecnológico – Mirabela Mineração
Itagibá – BA - Brasil [email protected]
Homero Delboni Júnior
Professor Doutor
Universidade de São Paulo - USP Escola Politécnica
Departamento de Engenharia de Minas e de Petróleo São Paulo - SP – Brasil
Modelling and Simulation of the
Santa Rita Mine Milling Circuit
Mining
Mineração
http://dx.doi.org/10.1590/0370-44672014690186
1. Introduction
Santa Rita is the greatest nickel sul-phide discovery in the world in the last 20 years. It was discovered in 2004 and Mi-rabela Mineração started its operation in
2009. The production was focused on high quality nickel concentrate, with nickel grade varying between 13% and 15%.
The current processing capacity
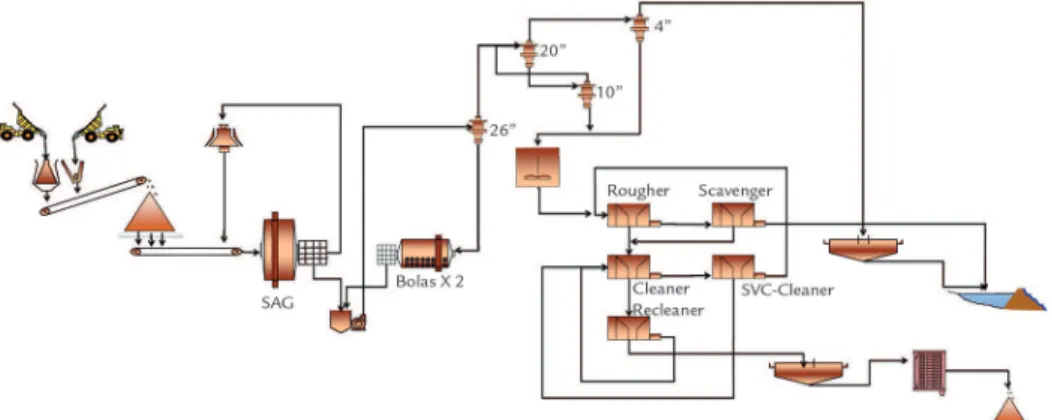
is 7.2 million t per year, producing approximately 20 kt of nickel in con-centrates. Figure 1 shows a simpliied circuit low sheet.
Figure 1 Simplified Flow Sheet of the Processing Plant.
Mined ore is hauled to two pri-mary crushers at an average rate of 1300 t/h. The primary crushing stage product is conveyed to a 67 kt capacity stockpile.
Reclaimed ore is conveyed at 860 t/h to the grinding circuit, which in-cludes one SAG mill, two pebble crush-ers and two ball mills. The grinding circuit is pumped to a desliming stage at a P80 of 125 μm.
The desliming circuit was not installed in the original processing circuit. However, reduced nickel min-eral recovery at lotation stages was observed in the initial operation, which was later associated with ibrous miner-als, mainly chrysotile and lizardite, as described by Edwards et al. (1980). It
includes three cyclone stages designed to remove such ibrous minerals which are concentrated in ine fractions.
averages 58%. The inal concentrate with nickel grade varying between 13% and 15% is thickened and iltered to
9% humidity.
The optimization study started in the grinding circuit aiming to increase
its capacity, followed by exercises tar-geting to increase nickel metallurgical recovery in the desliming stage.
2. Materials and methods
Industrial Survey Campaigns
Industrial circuit surveying is the basis for the mathematical modeling and simulation of grinding circuits. Ex-perimental data derived from surveys are initially balanced for providing consistent lowrates and size distribution associated with each single stream around the circuit. Mass balanced data are also useful for assessing circuit performance in terms of both grinding and classiication.
Even though it is the basis for any
simulation exercise, industrial surveying is generally dificult to be carried out, due to the high low rates at sampling points and operation stability among other aspects.
The mass balancing exercises are carried out to result in a high idelity repre-sentation of circuit operation. In this case, the grinding circuit sampling was con-ducted following the criteria proposed by Napier-Munn (1996), so as to reduce the sampling errors described in Gy’s theory
(1992). The survey was designed to last one hour. Pulp sampling increments were obtained every 10 minutes, while conveyor belt samples were obtained by removing the respective conveyor belt contents dur-ing a crash-stop, the latter conducted after pulp sampling.
A total of 18 different grinding circuit and desliming stage lows were sampled, besides operational and process data of all the equipment involved.
Ore Characterization
In this case ore characterization aimed to provide physical, chemical, textural and mineralogical information to allow identifying losses and ineficiencies in the Santa Rita industrial plant.
According to Naschenveng (2003)
in the comminution area, technological characterization is used to assess energy associated to fragmentation, which is used to calibrate mathematical models.
A 150 kg SAG mill feed sample was separated after homogenization to be sent
to the Laboratory of Simulation and Con-trol (LSC) of the University of São Paulo. The sample was used for carrying out standard fragmentation tests such as Bond WI (BWI) and Drop Weight Test (DWT).
Complementary Tests
Complementary bench tests were carried out so as to better assess speciic ore processing aspects.
The irst test included determining the ines distribution around the grind-ing circuit in order to assess the relative amount of natural and generated ines. The former associated with the natural distribution of such minerals in the vari-ous ore types, while the latter is related to ines generated in crushing and grinding equipment. The focus on ines was due to chrysotile and lizardite deleterious effects on lotation performance.
Samples from the milling circuit were screened at 8 and 2 mm sieves. The resulting fractions, i.e. +8 mm -8
+2 mm and -2 mm, were then crushed, ground and loated to assess the respec-tive nickel recovery.
The second bench test aimed to as-sess desliming alternatives. It consisted in two different processing routes based on SAG mill discharge. The irst route in-cluded desliming, grinding and lotation, while the second followed the grind-ing, desliming and lotation sequence. Therefore, the testing program aimed to compare the existing process (second route) with an alternative route, accord-ing to which the natural ines would be separated from the secondary grinding stage (ball milling) thus allowing the lotation stage to recover nickel minerals
contained in the ines.
The third test was based on the work carried out by Senior and Tomas (2005) that showed the beneits associ-ated with staged lotation. The test aimed increasing the nickel metallurgical recov-ery in lotation by decreasing the losses due to overgrinding. Accordingly, the irst lotation stage carried out with rela-tive coarse particles would recover the already liberated nickel minerals which could be over ground in the subsequent grinding stage, thus not recovered in the existing lotation circuit.
The experimental conditions of lotation batch tests are presented in Table 1.
Table 1
Experimental Conditions Flotation Tests.
pH 9.5
NaOH (g/t) 350
CuSO4 (g/t) 40
Citric Acid (g/t) 40
SEX (g/t) 60
DTP (g/t) 60
NaOH is used as pH modulator. CuSO4 and Citric acid is added as
acti-vators and Sodium Etil Xanthate (SEX) and Ditil Phosphate of Potassium (DTP)
209
Modelling and Simulation
The surveyed data were balanced in a JKSimMet simulator. The mass balanced data were the basis for the itting crushing, milling and classiica-tion mathematical models, the latter
including desliming stages. The charac-terization tests results were used in all comminution models.
After calibrating the models, a se-ries of simulations were conducted
aim-ing to increase the circuit throughput, by adjusting process variables along with modiications in the circuit low sheet, the latter following the complementary test results.
3. Results and discussion
Ore Characterization
The Bond WI test carried out on grinding circuit fresh feed resulted in a 21.1 kWh/t for a 0.150 mm closing
test screen. The result was regarded as an extremely high, according to Delboni Jr. (2003).
The A*b parameter derived from DWT was 46, classiied as moderately high, according to Delboni Jr. (2003).
Complementary Tests
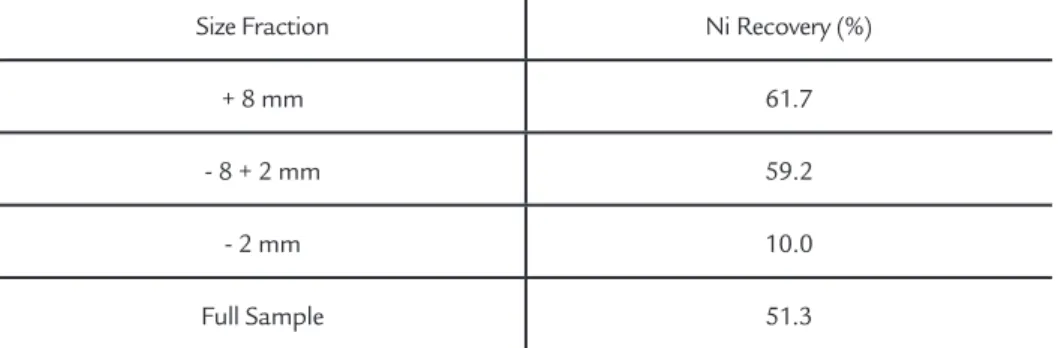
Results obtained from lotation tests carried out on discrete size fractions are listed in Table 2.
Table 2 Natural Fines Results.
Size Fraction Ni Recovery (%)
+ 8 mm 61.7
- 8 + 2 mm 59.2
- 2 mm 10.0
Full Sample 51.3
Sampling and Modelling
The sampling program was carried out as planned under steady-state operat-ing conditions. Mass balance exercises
resulted in relatively low deviations which thus indicate the overall good experi-mental data quality. Table 3 shows both
experimental and respective mass balance results obtained from the selected nine sampling points.
Table 3 Summary of the experimental and balanced data.
N0 Flow
Solids Discharge
(t/h) % Solids Volumetric Dis-charge (m3/h) P80 (mm)
Exp Bal Exp Bal Exp Bal Exp Bal
1 SAG Feed 830 830 98 98.11 280.4 279.5 148.8 148.8
2 U/S Trommel 830 830 72.49 72.34 578.5 580.8 1.522 1.524
3 TrommelO/S 114 114 98 98 38.52 38.52 59.19 59.19
4 Recrushed Product 114 114 98 98 38.52 38.52 17.39 17.39
5 Cyclons 26"Feed 2185 2188 57 56.58 2342 2374 0.425 0.427
6 Cyclons 26"O/F 830 830 39.12 39.25 1555 1548 0.149 0.147
7 Cyclons 26"U/F 1357 1358 77.22 77.47 831.1 826.4 0.765 0.77
Mass balanced results indicated a relatively low circulating load (163%) in the ball mills. It also indicated a 21.0 operational WI. According to Rowland (1978) the ratio between laboratory WI and operational WI results in grinding eficiency. Thus, in this case the ball mill grinding circuit resulted in 99.9% eficiency, which is here considered ab-normally high.
Another selected performance
index was the by-pass or ine removal in the desliming stage. The calculations indicated a 69% by-pass of the 0.010 mm fraction which was here regarded as a very low eficiency.
Model itting indicated an overall low deviation which thus resulted in a relatively high adherence between bal-anced and itted data.
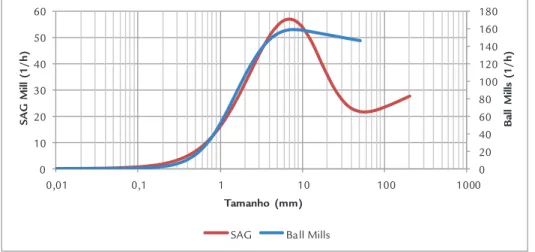
Figure 2 shows SAG and ball mills breakage rates. Note that the curve
ex-hibits the classic behavior of a SAG mill curve, showing the effect of the ore as the grinding media in coarse particles and the effect of balls, which begins to appear in the 50 mm particle size, having its greatest point at 7 mm. For all mills, the breakage rate indicates a profile with a well-defined inflection point. The kinetics is therefore increased for particles up to 6 mm, and decreased for sizes larger than this.
Figure 2 Breakage Rates.
Simulations
The irst simulation set aimed to improve the desliming performance. Simulation 1 consisted in operating the 10" cyclone cluster in open circuit, diverting its overlow to the tailings, i.e. no longer returning to the 20" cluster. Simulation 2 included Simulation 1 changes, together with diverting the 4" cyclone cluster underlow to the 10" cyclone cluster feed.
The fine by-pass was reduced from 69.1% (Base Case – current opera-tion) to 57.3% and 44.4% respectively in Simulations 1 and 2.
The second simulation set ex-plored alternatives to increase grinding circuit throughput. The modiications included (a) increasing the SAG mill ball charge from current 8% to 12%, as well as (b) reducing the cyclone pulp feed density for the achievement of the stipulated cut size. Such a combination was due to the fact that when increas-ing the SAG mill ball charge, it grinds coarser, and by reducing the cyclone feed percent solids, it reduces the cut size, thus returning to the original cut size. In such circumstances the circulat-ing load would be increased.
Simulation 4 included changes adopted in Simulation 3, along with (a) reducing the SAG mill ball diam-eter from 5" to 4", (b) reducing the
ball mill ball diameter from 2.5" to 2" and (c) increasing the ball charge in the ball mills from 27.5% to 30%. All these modifications aimed to increase the energy consumption in both SAG and two ball mills, which would thus be converted into a higher circuit throughput.
Simulation 4 resulted in a 1070 t/h overall circuit throughput which corresponds to a 29% increase as compared with the Base Case, while in Simulation 3 the throughput was 975 t/h. Ball mill circulating loads were increased to 200% in Simulation 4; therefore, higher than the Base Case igure (163%). The same Simulation 4 indicated a grinding product P80 of 0.145 mm. A limiting operation condi-tion was the classiicacondi-tion pump volu-metric low rate, limited to 3600 m3/h. Based on laboratory lotation test results, two further simulations were carried out by changing the circuit low sheet. Both targeted increasing Ni metallurgical recovery.
Simulation 5 was based on test results, which indicated the deleteri-ous effects associated with natural slimes, as opposed to generated ines which showed no reduction in nickel recovery. Hence, the simulation con-sisted in including a pre-classiication
stage after the SAG mill discharge. The pre-classiication overlow was thus diverted to desliming stages, while the underlow was directed to lotation.
The results from Simulation 5 showed a 1095 t/h overall circuit throughput, due to the double classii-cation stage prior to ball milling stage. Simulation 5 also indicated a re-duction in slime recovery, from 2.2% as compared with 8% of the Base Case.
Simulation 6 considered the two-stage ball milling concept, including one lotation stage between the two milling stages, as well as one after the second ball milling stage. The strategy here was to reduce Ni mineral over-grinding and therefore the Ni losses in lotation. In other words, the two existing parallel ball mills would be converted to an operation in series. Simulation 6 was based on the changes included in Simulation 5.
Simulation 6 results showed 1050 t/h circuit throughput, yielding 0.213 mm and 0.138 mm P80 values respectively at irst and second ball milling stage discharges.
Simulation exercise results were used to calculate the respective nickel production based on laboratory lo-tation tests. The results are listed in Table 4. 0 20 40 60 80 100 120 140 160 180 0 10 20 30 40 50 60
0,01 0,1 1 10 100 1000
B all M ill s (1/ h) S A G M ill ( 1/ h)
Tamanho (mm)
211 Scenario New Feeding (t/h) Ni Content (%) Global Ni Recovery (%) Ni Production (%)
Base Case 830 0.52 47.2 2.04
Simulation 3 975 0.52 47.2 2.39
Simulation 4 1070 0.52 47.2 2.63
Simulation 5 1095 0.52 51.2 2.92
Simulation 6 1050 0.52 51.2 2.85
Table 4 Nickel Production Simulations.
The highest nickel recovery was derived from the two-stage milling option with two flotation stages
(Simulation 6). However, the highest nickel production was obtained for the anticipated desliming stage. The
obtained figure (2.92%) was 43% higher than the Base Case (2.04%).
4. Conclusions
The survey campaign planning and sampling techniques were considered adequate as mass balance indicated low deviations between experimental and bal-anced results. The latter were successfully used for modeling the entire comminution circuit, together with the desliming stage, thus creating a Base Case.
The Base Case assessment of opera-tion performance indicated a low circulat-ing load in the ball millcirculat-ing stage, as well as very low eficiency in the desliming stage.
Laboratory batch tests indicated
a great potential for improving the nickel global recovery by relatively simple changes in the current process low sheet. Accordingly, a desliming stage after SAG milling would prevent signiicant losses in nickel contents, as compared with cur-rent desliming after the ball milling stage. Staged ball milling and lotation would also enhance significantly the overall nickel metallurgical recovery.
In the desliming circuit, a better performance would be achieved by operat-ing the 10" cyclone cluster in open circuit,
diverting its overlow to the tailings, ie. no longer returning it to the 20" cluster.
Increasing ball mill charge, along with adjusting the percent solids in classii-cation feed, resulted in signiicant increase in the circuit overall throughput.
Modelling and simulation were considered decisive tools for both assessing and improving circuit performance of the Santa Rita concentrator. The simulations indicated potential beneits to enhance nickel recovery and production, thus providing support for decision-making.
5. Acknowledgements
The authors wish to thank Mirabela Mineração especially Mr. Evandro Faria for supporting this study.
6. References
DELBONI JR, H. Modelagem e simulação de circuitos de cominuição e classiica-ção. São Paulo, Escola Politécnica, 2003. (Apostila do Curso PMI 5004).
EDWARDS, C.R., KIPKIE, W.B., AGAR, G.E. The effect of slime coatings of the ser-pentine minerals, chrysotile and lizardite, on pentlandite lotation. International Journal of Mineral Processing, Amsterdam, v. 7, n.1, p. 33-42, 1980.
GY, P.M. Sampling of heterogeneous and dynamic material systems: theories of he-terogeneity, sampling and homogenizing. Amsterdan: Elselvier , 1992. 653p. NAPIER-MUNN, T.J. et al. Mineral comminution circuits: their operation and
opti-mization. Indooroopilly, SMIJKRMC, 1996. 413 p.
NASCHENVENG, A.C. Modelagem e simulação do circuito de moagem da Ul-trafértil. São Paulo: Escola Politécnica, Universidade de São Paulo, 2003. 101 p. (Dissertação de Mestrado).
ROWLAND, C.A. Determination and use of operating work indices in controlled grin-ding circuits - a proposed concept. In: MILL OPERATOR'S CONFERENCE, 1978. North West Queensland Branch. Papers presentedat the Mill Operator's Conferen-ce. Parkville: Australasian Institute of Mining and Metallurgy, 1978, p.71-78. SENIOR, G.D; THOMAS, S.A. Development and implementation of a new
low-sheet for the lotation of a low grade nickel ore.International Journal of Mineral Processing, Amsterdam, v. 78, n.1, p 49-61, 2005.