137
Thiago Dias dos Santos
Doutorando
Universidade Estadual de Campinas – UNICAMP Faculdade de Engenharia Civil,
Arquitetura e Urbanismo Departamento de Estruturas Campinas – São Paulo – Brasil [email protected]
Gustavo Henrique Siqueira
Professor
Universidade Estadual de Campinas – UNICAMP Faculdade de Engenharia Civil,
Arquitetura e Urbanismo Departamento de Estruturas Campinas – São Paulo – Brasil [email protected]
Luiz Carlos Marcos Vieira Junior
Professor
Universidade Estadual de Campinas – UNICAMP Faculdade de Engenharia Civil,
Arquitetura e Urbanismo Departamento de Estruturas Campinas – São Paulo – Brasil [email protected]
A stochastic approach
for the wind load effect
on steel structures
Abstract
The Brazilian design load standard still provides a wind speed map developed in 1977. Since then, new data have been collected and new charts have been proposed in literature. The literature not only alerts to changes in short-term wind gust patterns, but it also warns that the wind speed values are higher than observed in the past. Many researchers have suggested that these differences are correlated to climate change ef-fects. Besides the geophysical and societal impacts of climate change, there is a general concern between designers on the impacts of higher wind speeds on structural design. This paper aims to analyze the wind speed as a stochastic variable and its inluence on the design of steel structures when changes in wind speed occur. A stochastic ap-proach is used to evaluate expected stress values for a steel beam-column example. A Monte Carlo analysis is performed on a forty-story steel frame to compare the impact of different wind speed scenarios and types of analysis. In the analyses, the wind speed is approached by a Gumbel distribution and future wind scenarios are generated for sensitiveness evaluation. The analytical and Monte Carlo analyses indicate that greater attention shall be given to the consequences of using an average wind speed value in-stead of a probability distribution function.
Keywords: stochastic analysis; wind load; steel structures design. http://dx.doi.org/10.1590/0370-44672015690203
Civil Engineering
Engenharia Civil
1. Introduction
All data or processes have a cer-tain level of uncercer-tainty. For example: material properties, loading scenarios, boundary conditions, geometry domain, etc., have smaller or larger uncertain-ties which inluence the quantiuncertain-ties or functions of interest (Deb et al., 2001).
The probability theory can be applied to understand and quantify how these uncertainties impact these quantities or functions. When probability models are coupled as parameters in the differen-tial equations that represent a physical problem of interest, the complete model is ruled by a stochastic differential equa-tion (Dorini et al., 2011). Some examples
using the probability theory to study the safety level of steel structures can be found in Beck & Doria (2008) and Zhao
et al. (2011). The irst study evaluated
the reliability of I-section steel columns designed according to the Brazilian stan-dard for the design of steel buildings NBR 8800 (ABNT, 2008). The second study evaluated the reliability associated to the use of a so-called Column Overdesign Factor (COF), which ensures a designer predeined preferable failure mode; this method is usually adopted in seismic structural design.
In this paper, however, the main focus is on the loading side, more spe-ciically: wind load. Wind velocity and, hence wind load on structures, are sto-chastic processes, which luctuate both in time and space (Beck & Corrêa, 2013). Generally, structural design codes con-sider the wind velocity randomness by deining a speciic wind velocity value that is associated to a load factor; these
values are determined based on a statis-tical study of the historical database of wind velocities.
maxi-138
mum wind speed collected between 1950 and 1975 by Vieira Filho (1975). Since then, new wind speed records have been available and more stations have been built. It is worth mentioning that Santos (1989), Bautista (2002), Almeida (2010) and Beck & Corrêa (2013) presented new wind speeds studies and their charts are considerably different than the chart in the Brazilian standard NBR 6123 (ABNT, 1988).
Recently, scientists have raised global awareness on climate change pat-terns; the irst IPCC (Intergovernmental Panel on Climate Change) report was published in 1990 and the last report was just released in 2014. All reports in-dicate important changes in environment patterns such as: seasonal temperature, amount of precipitation, wind speed, social impacts, etc. The PBMC (Brazil-ian Panel on Climate Change), funded by MCT and MMA (Ministry of Science and Technology and Ministry of Envi-ronment, respectively), has published a compilation of climate change impacts in the territory of Brazil (PBMC/GT1, PBMC/GT2, PBMC/GT3, 2013). These
studies lead one to conclude that not only new wind speed charts have to be used, but also a new approach to take in account the wind speed variability needs to be developed to provide a reliable basis for structural design standards.
An alternative for taking into ac-count the wind load variability is to consider the wind load as a stochastic variable adopted into the static or dy-namic differential equations that governs a structural problem. The results of these equations are statistical moments (mean, standard deviation, etc.) and/or prob-ability density function (pdf) of stress
and displacement. That way, in a given scenario, non-deterministic variables are transformed into a probability func-tion that describes stresses and strain in a structure. According to Dorini et al.
(2011), two methods are available to solve stochastic differential equations:
(i) the most formal method, which uses functional analysis to study the gov-erning equation of a given problem with non-deterministic variables, and
(ii) one which uses numerical meth-ods or mathematical techniques, such as
Monte Carlo, to statistically understand the problem. Others techniques, based for example on Galerkin method, are discussed and presented in Ghanem (1999), Deb et al. (2001), Babuška et al.
(2004), Wan & Karniadakis (2006), Ma & Zabaras (2008) and Azevedo (2009).
The purpose of this paper is to ana-lyze, through a simple example, the im-pact of the wind load – non-deterministic variable – on the static equilibrium equa-tions of a beam-column and to determine if the same conclusions can be expanded to the analysis of typical steel-frame build-ings. Based on the functional analysis method presented in Dorini et al. (2011),
analytical solutions for equilibrium of a beam-column in the straight and delected shape were obtained; expected values in both analyses were compared with the classical deterministic procedure. Prob-ability density function stress curves are also generated for different wind speed scenarios. A Monte Carlo analysis of a typical high-rise steel-frame building was performed; different types of struc-tural analysis procedures were adopted to verify the consistency of the conclusions.
2. Methods
Herein, the wind load is consid-ered as a stochastic variable governed by a given probability density func-tion, which is followed by examples that evaluate the stress probability
function of a beam-column – equilib-rium in the original (perfectly straight) and delected shape. A comparison be-tween expected stress value and stress obtained from mean wind speed value
for a given artiicial future scenarios is also presented. The stochastic analysis is performed for the beam-column example depicted in Figure 1.
Figure 1
Typical steel beam-column: W 200 x 35.9. a) Beam-column in perfectly straight shape. b) Beam-column in deflected shape due to the bending moment (wind load).
(a) (b)
Wind load as a stochastic variable
The wind load (pressure) is pro-portional to its velocity. As the wind
139
(1)
(2)
(3)
(4)
(5)
(6)
(7)
(8)
(9)
where � depends on the structural ge-ometry (deterministic variable) and ω is
a random event. The wind velocity can be modeled using a Gumbel cumulative
distribution function:
where � is the location parameter and
α is a scale parameter. Deriving Eq.
2 with respect to �, probability den-sity function (pdf) is obtained. The
expectation operator (mean) E [ ∙ ] is
deined as:
where C'� (�) is the wind speed pdf.
For Gumbel distribution E [�]=�+ γα,
where γ is the Euler-Mascheroni con-stant (≈0.5772).
Equilibrium in the original (perfectly straight) shape
The maximum column stress (design value) in Figure 1 occurs at the column mid-height. It is assumed
that superposition can be used. Then, the total stress is the sum of two parts: stresses caused by the wind
load and stresses caused by the verti-cal force, which can be written in the general form:
where σT,s (ω) is the random total stress,
bs is the bending moment and c(P) the
normal stress from the vertical
(deter-ministic) force P. The subscript s will
be used herein when the variable is associated to the column in a perfectly
straight shape, Figure 1(a). Thus, the
cumulative distribution function for
σT,s (ω) is:
for bs>0, q-c(P)≥0 and for some
real-ization q of the total stress. As shown
in Eq. 5, the total stress function also follows a Gumbel distribution.
Equilibrium in the deflected shape
Herein, we solve the second order elastic equation considering the bending moment produced by the vertical force:
where �(�,ω) is the lateral delection.
Solving this equation for a random event ω, we have the expression for
the bending moment, which is non-linear in respect to the vertical force
P. We can also use the superposition
of axial and bending axis stresses to get the maximum stress:
The subscript � will be used herein when the variable is associated to the
column in a delected shape, Figure 1(b).
The cumulative distribution function
for σT,� (ω) is obtained through the same
approach of Eq. 5:
for b�(P)>0, which b� (P) is non-linear in
respect to the vertical force P, q-c(P)≥0 and
for some realization q of the total stress. Note that equilibrium in the delected
shape also leads to a total stress function, which follows a Gumbel distribution.
Stress values comparison
The difference between the expected stress value based on stress probability
density function (E [σT,� ]) and the stress
value calculated with expected basic wind
speed (σ ̅T,�) is evaluated in this section.
140
where the index � is either s (perfectly
straight) or � (deflected shape), the
pdfC'σT,� is given in Eq. 5 or in Eq. 8.
Equation 9 can be written as (using the
expressions for σ ̅T,�and C'σT,�:
in which the difference between σ̅T,� and E [ σT,� ] is clear.
Wind speed scenarios
PBMC/GT2 (2013) reported a 2°C increase in the global temperature, which directly and critically impacts our ecosystems, as well as, generating a change in extreme event patterns and intensity. The irst hurricane observed in the South Atlantic region occurred in 2004 and in the last 50 years the south region of Brazil has registered an abrupt
increase in the precipitation volume. Pereira et al. (2013) analyzed trends in
wind speed from some national weather station data series and examined wind forecasts from the circulation model (GCM); their analysis was based on an average wind speed value. Important developments were achieved in terms of numerical tools to predict the effects
of the climate change, but the level of uncertainties is still large.
Based on the study presented in Steenbergen et al. (2009), it was
as-sumed, Table 1, the parameters � and α for the Gumbel distribution to analyze the impact of a non-deterministic wind load on a steel structure; these values are used in the next section.
Table 1
Artificial wind speed scenarios (SI units).
Scenario � α
Baseline 45 2
AS-1 +1% +0%
AS-2 +2% +2%
AS-3 +5% +3%
3. Beam-Column Example – Results and Discussions
The results and discussions present-ed in this subsection are baspresent-ed on the study of the beam-column depicted in Figure 1. The parameters for the Gumbel functions
are: � = 45 m/s, α = 2 m/s, and the linear factor � = 12.0 (air density, pressure area, pressure factor, etc). The comparison be-tween the probability density functions
derived above (equilibrium in the straight and delected shape) is depicted in Figure 2 below:
Figure 2
Probability density function of total stress (SI units) for equilibrium in the straight and deflected shape.
Figure 2 depicts that, for an in-crease in the vertical force, the prob-ability density function for equilibrium in the delected shape shifts to higher stress values, while the probability of
the peak load decreases and the curve becomes wider – larger standard de-viation. Table 2 summarizes the com-parison between the deterministic and stochastic expected stress for a
beam-column with axial load, P, where
equi-librium is given in the original (straight) shape and in the delected shape (Eq. 9 and Eq. 10). The parameter α is equal to 10 m/s.
(10)
141
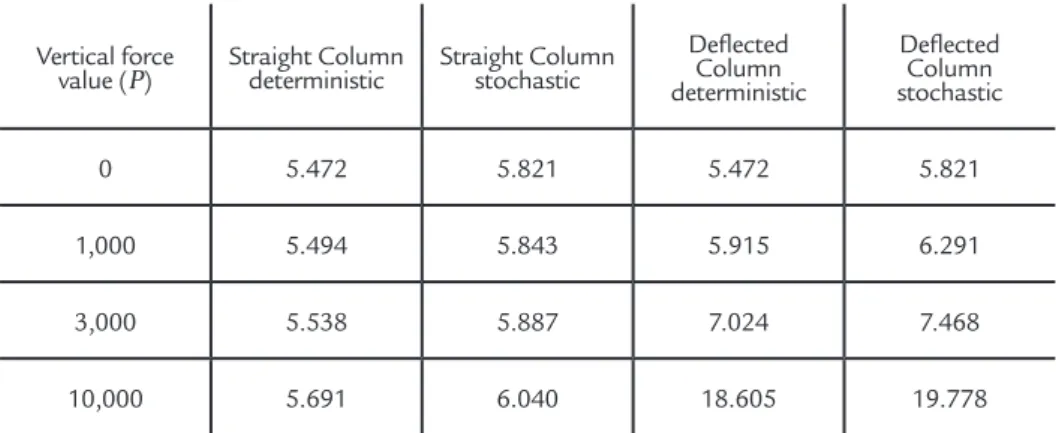
Table 2 Expected stress values (SI units, 107).
Vertical force
value (P) Straight Column deterministic Straight Column stochastic
Deflected Column deterministic
Deflected Column stochastic
0 5.472 5.821 5.472 5.821
1,000 5.494 5.843 5.915 6.291
3,000 5.538 5.887 7.024 7.468
10,000 5.691 6.040 18.605 19.778
Table 2 indicates that the ex-pected stress values are greater for stochastic analysis and that equilibrium in the delected shape, as expected, leads to higher stress values. Note that the ratios between the stochastic and deterministic expected values are practically the same for each type of
equilibrium analysis.
Figure 3 depicts the pdf for
differ-ent wind scenarios and vertical force
P = 3,000. Figure 3 depicts that
param-eters � and α shift to higher values and the function baseline gets wider. Table 3 provides the ratio between expected stress values. The results indicate a
nonlinearity between wind speed and stress, as expected, since wind load and wind speed have a nonlinear relation-ship. Equilibrium in the straight and the delected shape produces practically the same expected stress ratio, since, for this column-beam example, wind load and stresses have a linear relationship.
Figure 3 Probability density function of total stress (SI units) for the artificial wind speed scenarios, equilibrium in the straight shape.
Table 3 Expected stress value ratio for different scenarios.
Scenario Straight Structure Deflected Structure
Baseline 1 1
AS-1 1.019 1.019
AS-2 1.039 1.040
AS-3 1.097 1.100
4. Frame Example – Results and Discussions
A forty-story steel frame com-monly found in office-type building is analyzed in this section; this frame, Figure 4, is a two-bay structure with 9.15m span (30 feet), 9.15m (30 feet) spacing between frames, and each story
is 3.66m (12 feet) high. Cross-sections, mechanical material properties, and nominal loads are summarized in Figure 4. This frame was originally proposed in a report issued by the Fritz Laboratory at Lehigh University, Lu et al. (1975),
142
Figure 4
Description of forty-story steel frame (Adapted from
Lu et al. (1975) and Stlater et al. (2011)).
The inite element model of the forty-story steel frame considers that the load factor for dead load is 1.2, while the load factor is 0.5 for live load; a load factor was not applied to the wind load since the wind load is considered as a non-deterministic variable in the model. The simulation was performed using the structural analysis software MASTAN2 (Ziemian, 2009), following the recommendations listed in Stlater et al. (2011), which are:
(i) residual stresses, as well as con-nection size and stiffness were neglected for simplicity,
(ii) all distributed loads were lumped to beam-column intersections using tributary area (lengths),
(iii) self-weight was assumed to be included in the dead loads provided,
(iv) all wide-lange sections are ori-ented for major-axis lexure (i.e., with their webs in the plane of the frame),
(v) all out-of-plane behavior is restrained,
(vi) member lengths are deined by their centerlines,
(vii) to adequately account for
P-δeffects, members are divided into four elements,
(viii) second-order analyses were performed using a predictor-corrector (mid-point Runge-Kutta) solution scheme and applying the factored loads in 5% increments until the frame is fully loaded.
In this paper, the considered forty-story steel frame is located in the region of Campinas, Sao Paulo, Brazil. Based on historical data available in the software Mathematica (2015) for the airport of Viracopos (VCP) from 1973 to 2014, it was found that the basic wind speed distribution is well represented by a Gumbel distribu-tion funcdistribu-tion with locadistribu-tion parameter
� = 35.8m/s (80mi/h) and scale param-eter α = 4m/s (8.95mi/h). As an example, a basic wind speed of 35.8m/s (80mi/h) is equivalent to a mean velocity pressure of 778N/m2 (16.25lbf/ft2), given that the
factors to account for the importance of the structure, its height, and the terrain (ASCE 7-10, 2010) are equal to 1. Given the Gumbel distribution function just described, a vector with 10,000 values of basic wind speed was created and for each value of basic wind speed, three types of analysis were performed:
(i) irst-order elastic,
(ii) second-order elastic, and (iii) second-order inelastic; for more details on what each type of analysis entails, the reader is directed to McGuire et al. (2000). A
143
Figure 5 Comparative histogram for the overturning moment at the center column.
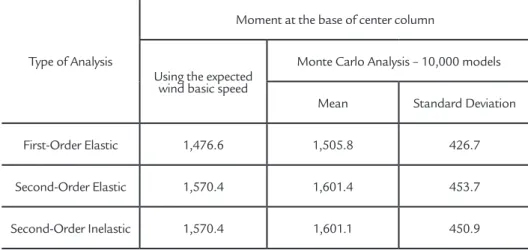
Figure 5 and Table 4 depict that, as was concluded for a beam-column analytical analysis, the histogram for second-order analysis shifts to a higher moment at the base, while the probabil-ity of the maximum moment decreases and the curve becomes wider – larger standard deviation; note that the ratios between the Monte Carlo simulation and the analysis using the expected basic wind speed value are still practi-cally the same for each type of analysis. Another interesting fact is depicted in
the zoomed-in view graph in Figure 5; for most part of the models, the probability associated to second-order elastic and inelastic analysis is the same. However, once the moment at the base reaches values close to 4,210.1N.m, second-order elastic and inelastic analy-sis looses its parity. The moment value just mentioned is the moment at the base right before the structure reaches a plastic collapse mechanism, which can only be detected through a second-order inelastic analysis. In fact, based
on the second-order inelastic analysis, 0.21% of the structures collapse under the applied wind pressure distribution; this value can be considered high, given that an acceptable probability failure is in the order of 10-4; this
observa-tion reinforces that more studies shall be conducted on the topic and that a proper reliability analysis – all non-deterministic variables are considered/ varied in the analysis – is necessary given the actual climate change sce-narios that we are experiencing.
Table 4 Analysis of overturning moment at the base of center column (Units = kN.m).
Type of Analysis
Moment at the base of center column
Using the expected wind basic speed
Monte Carlo Analysis – 10,000 models
Mean Standard Deviation
First-Order Elastic 1,476.6 1,505.8 426.7
Second-Order Elastic 1,570.4 1,601.4 453.7
Second-Order Inelastic 1,570.4 1,601.1 450.9
5. Conclusion
How to perform a stochastic analy-sis for a very simple example: steel beam-column has been described. Results indi-cate that, using Gumbel distribution to describe the wind velocity, the expected stress values are higher when performing
a stochastic analysis. It was also shown that the probability density functions are more susceptible to vertical force changes when equilibrium is considered in the delected shape, which shows the importance of also accounting for the
vertical force in a stochastic analysis. There were significant changes in the pdf curves for different wind
144
much due to the nonlinearity between wind speed and stress; similar conclu-sions were reached in the analysis of a multi-story high-rise steel frame. The importance of further research in this
area has been shown in a beam-column model, as well as in a high-rise build-ing model, where the effect of the basic wind speed was considered separately without the interference of any other
non-deterministic variable. Climate change has affected the loading curve distribution, especially for wind loads, and future changes must be acknowl-edged in upcoming design standards.
6. Acknowledgements
The authors would like to ac-knowledge SimWorx – Eng., Research & Development and College of Civil Engineering, Architecture and
Ur-banism - University of Campinas for supporting this research project and Patrick Kherlakian for his assistance with MASTAN2/Matlab. Any
opin-ions, indings, and conclusions or recommendations expressed in this material are those of the authors only.
7. References
ABNT (2008). "NBR 8800: Projeto de estruturas de aço e de estruturas mistas de aço e concreto de edifícios." Associação Brasileira de Normas Técnicas.
ALMEIDA, L. O.. Estudo para atualização do mapa de ventos da NBR6123. Brasil,
São José dos Campos: ITA, 2010. (M.Sc. Thesis).
ASCE. Minimum design loads for buildings and other structures. ASCE/SEI 7-10.
Reston, VA, American Society of Civil Engineers, 2010.
AZEVEDO, J. S.. Modelagem numérica de escoamento transiente em meios porosos aleatórios usando a expansão de Karhunen-Loève. Brasil, Salvador: D.Sc. UFBA,
2009. (D.Sc. Thesis).
BABUŠKA, I., TEMPONE, R., ZOURARIS. G. E. Galerkin inite element appro-ximations of Stochastic Elliptic Partial Differential Equations. SIAM J. Numer. Anal., v. 42, n. 2, p. 800-825, 2004.
BAUTISTA, E. A.L. A distribuição generalizada de valores extremos no estudo da velocidade máxima do vento em Piracicaba. Brasil, Piracicaba, SP: USP,
2002. (M.Sc. Thesis).
BECK, A. T., CORRÊA, M. R. S. New design chart for basic wind speeds in Brazil.
Latin American Journal of Solids and Structures, v. 10, p. 707-723, 2013.
BECK, A. T., DÓRIA, A. S. Reliability analysis of I-section steel columns designed according to New Brazilian Building Codes.J. of the Braz. Soc. of Mech. Sci. & Eng., v. XXX, n. 2, p. 152-159, 2008.
BUCHER, C. Computational analysis of randomness in Structural Mechanics.
Lon-don, UK: Taylor & Francis Group, 2009. v.3.
DAVENPORT, A. G. Past, present and future of Wind Engineering. Journal of Wind Engineering and Industrial Aerodynamics. v. 90, p. 1371-1380, 2002.
DEB, M. K., BABUŠKA, I., ODEN, J. T. Solution of Stochastic Partial Differential Equations using Galerkin Finite Element Techniques, Comput. Methods Appl. Mech. Engrg., v. 190, p. 6359-6372, 2001.
DORINI, F. A., CUNHA, M. C. C., Oliveira, S. P. Soluções de problemas envolvendo equações diferenciais sujeitas a incertezas. TEMA Tend. Mat. Apli. Comput. v.12,
n.2, p. 111-123, 2011.
GHANEM, R. Ingredients for a general purpose stochastic inite elements implemen-tation. Comput. Methods Appl. Mech. Engrg. v. 168, p. 19-34, 1999.
Intergovernmental Panel on Climate Change. IPCC Fifth Assessment Report – Clima-te Change 2013. 2013. Available at www.ipcc.ch. Accessed August 2014.
LU, L.W., OZER, E., DANIELS, J.H., OKTEN, O.S., MORINO, S. Frame stabili-ty and design of columns in unbraced multistory steel frames, Fritz Engineering Laboratory Report n. 375.2. Lehigh University, Bethlehem, Pennsylvania: Lehigh
University, 1975.
MA, X., ZABARAS, N. A stabilized stochastic inite element second-order projection method for modeling natural convection in Random Porous Media. Journal of Computational Physics. v. 227, p. 8448-8471, 2008.
MCGUIRE, W., GALLAGHER, R. H., ZIEMIAN, R. D. Matrix structural analysis. 2000.
NBR 6123:1988: Forças devidas ao vento em ediicações. ABNT – Associação Brasi-leira de Normas Técnicas, Rio de Janeiro.
145
UFRGS, 1977. (M. Sc. Thesis).
PBMC, Contribuição do Grupo de Trabalho 1 ao Primeiro Relatório de Avaliação Nacional do Painel Brasileiro de Mudanças Climáticas. Sumário Executivo GT1, PBMC, Rio de Janeiro, Brazil. 2013.
PBMC, Contribuição do Grupo de Trabalho 2 ao Primeiro Relatório de Avaliação Nacional do Painel Brasileiro de Mudanças Climáticas. Sumário Executivo GT2, PBMC, Rio de Janeiro, Brazil. 2013.
PBMC, Contribuição do Grupo de Trabalho 3 ao Primeiro Relatório de Avaliação Nacional do Painel Brasileiro de Mudanças Climáticas. Sumário Executivo GT3, PBMC, Rio de Janeiro, Brazil. 2013.
PEREIRA, E. B., MARTINS, F. R., PES, M. P., da CRUZ SEGUNDO, E. I. LYRA, A. A. The impacts of global climate changes on the wind power density in Brazil.
Renewable Energy. v. 49, p. 107-110. doi:10.1016/j.renene.2012.01.053, 2013.
SANTOS, M. L. W. Regionalização das velocidades extremas e temperatu-ras dos ventos no Centro-Sul do Btemperatu-rasil. Brasil, Porto Alegre: UFRGS, 1989.
(M.Sc. Thesis).
STATLER, D.E., ZIEMIAN, R.D., ROBERTSON, L.E.. The natural period as an indicator of second-order effects. Proceedings of the Annual Stability Conference Structural Stability Research Council. 2011.
STEENBERGEN, R. D. J. M., GEURTS, C. P. W., VAN BENTUM, C. A. Climate change and its impact on structural safety. HERON Built Environment and Ge-osciences. v. 54, n. 1, 2009.
VIEIRA FILHO, J. M. S. Velocidades máximas do vento no Brasil. Brasil, Porto
Alegre, 1975. (M.Sc. Thesis).
WAN, X. KARNIADAKIS, G. Multi-element generalized polynomial chaos for ar-bitrary probability measures. SIAM J. Sci. Comput. v. 28, n. 3, p. 901-928, 2006.
WOLFRAM Research, Inc., 2015. Mathematica, Version 10.2, Champaign, IL. ZHAO, Y.-G., SHARFUDDIN, M., IDOTA, H. Probabilistic evaluation of COF for
steel frames considering system reliability. J. Struct. Constr. Eng., AIJ. v. 76, n.665,
p. 1235-1244, 2011.
ZIEMIAN, R. D. & MCGUIRE, W. 2009. MASTAN2. Available at www.mastan2. com. Accessed December 2015.