Relationships of Human Medulloblastoma Subgroups
during Early Human Neurogenesis
Cornelia M. Hooper1,2, Susan M. Hawes3, Ursula R. Kees4, Nicholas G. Gottardo1,5, Peter B. Dallas1* 1Brain Tumour Research Program, Telethon Kids Institute, University of Western Australia, Subiaco, Western Australia, Australia,2Centre of Excellence in Computational Systems Biology, ARC Centre of Excellence in Plant Energy Biology, University of Western Australia, Perth, Western Australia, Australia,3Monash Institute of Medical Research, Monash University, Clayton, Victoria, Australia,4Division of Children’s Leukaemia and Cancer Research, Telethon Kids Institute, University of Western Australia, Subiaco, Western Australia, Australia,5Department of Paediatric Oncology and Haematology, Princess Margaret Hospital for Children, Subiaco, Western Australia, Australia
Abstract
Medulloblastoma is the most common form of malignant paediatric brain tumour and is the leading cause of childhood cancer related mortality. The four molecular subgroups of medulloblastoma that have been identified – WNT, SHH, Group 3 and Group 4 - have molecular and topographical characteristics suggestive of different cells of origin. Definitive identification of the cell(s) of origin of the medulloblastoma subgroups, particularly the poorer prognosis Group 3 and Group 4 medulloblastoma, is critical to understand the pathogenesis of the disease, and ultimately for the development of more effective treatment options. To address this issue, the gene expression profiles of normal human neural tissues and cell types representing a broad neuro-developmental continuum, were compared to those of two independent cohorts of primary human medulloblastoma specimens. Clustering, co-expression network, and gene expression analyses revealed that WNT and SHH medulloblastoma may be derived from distinct neural stem cell populations during early embryonic development, while the transcriptional profiles of Group 3 and Group 4 medulloblastoma resemble cerebellar granule neuron precursors at weeks 10–15 and 20–30 of embryogenesis, respectively. Our data indicate that Group 3 medulloblastoma may arise through abnormal neuronal differentiation, whereas deregulation of synaptic pruning-associated apoptosis may be driving Group 4 tumorigenesis. Overall, these data provide significant new insight into the spatio-temporal relationships and molecular pathogenesis of the human medulloblastoma subgroups, and provide an important framework for the development of more refined model systems, and ultimately improved therapeutic strategies.
Citation:Hooper CM, Hawes SM, Kees UR, Gottardo NG, Dallas PB (2014) Gene Expression Analyses of the Spatio-Temporal Relationships of Human Medulloblastoma Subgroups during Early Human Neurogenesis. PLoS ONE 9(11): e112909. doi:10.1371/journal.pone.0112909
Editor:Berta Alsina, Universitat Pompeu Fabra, Spain
ReceivedJune 5, 2014;AcceptedSeptember 10, 2014;PublishedNovember 20, 2014
Copyright:ß2014 Hooper et al. This is an open-access article distributed under the terms of the Creative Commons Attribution License, which permits
unrestricted use, distribution, and reproduction in any medium, provided the original author and source are credited.
Data Availability:The authors confirm that all data underlying the findings are fully available without restriction. All relevant data are within the paper and its Supporting Information. Raw expression data Cel files are available at ?http://bioinformatics.childhealthresearch.org.au/datasets/index.php. Data is available at NCBI GEO repository - accession number GSE62600.
Funding:This work was supported by the Australian National Health and Research Council (NHMRC, Project grant 403893, URK and PBD); the Government of Western Australia through funding for the WA Centre of Excellence for Computational Systems Biology (DIR WA CoE) (CMH), the Stan and Jean Perron award (CMH), and the Jock and Marjorie Hetherington Award for Neuroscience Tesearch (CMH). The authors thank The Children’s Leukaemia and Cancer Research Foundation/Three boys Legacy for financial support for the purchase of critical equipment. The funders had no role in study design, data collection and analysis, decision to publish, or preparation of the manuscript.
Competing Interests:The authors have declared that no competing interests exist.
* Email: [email protected]
Introduction
Medulloblastoma is the most common type of malignant brain tumor affecting children. Although the prognosis for patients has improved markedly in the last thirty years, the outlook for those with metastatic or recurrent disease remains poor [1], and for many patients post-treatment sequelae often result in significant long-term intellectual and/or developmental impairment and associated psychosocial problems [2]. These issues highlight the pressing need for more effective treatment strategies with less damaging collateral effects. Significant progress has been made towards these goals in the last five years, with an improved understanding of the molecular profiles underpinning the histo-logical and clinical heterogeneity of medulloblastoma. The current consensus points to the existence of at least four molecular
subgroups [3,4] including a predominantly desmoplastic Sonic Hedgehog (SHH) subgroup, a Wingless (WNT) classic subgroup, and two other less clearly defined subgroups, Group 3 and Group 4, which exhibit classic and large-cell/anaplastic histology and gene signatures characterized by activated photoreceptor or neuronal receptor signaling, respectively. The accruing data reveal that medulloblastoma subgroups arise in distinct regions of the posterior fossa [5–7] are associated with characteristic genetic aberrations [8], and may be derived from distinct cells of origin.
Substantial evidence has been generated in the last decade to support the hypothesis that for at least some cancers, a minority population of cells with stem cell like properties may be primarily responsible for driving tumor growth [9]. Indeed, previous reports revealed that human medulloblastoma contain a small proportion of cells expressing the neural stem cell (NSC) markers CD133+
Nestin+
(NES), which were the only tumor cell population displaying the hallmark stem cell characteristics of self-renewal and differentiation [10–12]. Critically, only the CD133+
cells were capable of regenerating human medulloblastoma that were phenotypically identical to the original tumor in xenograft assays [10]. Several murine models have demonstrated that medullo-blastoma with characteristics similar to human subgroups can be generated through the genetic manipulation of NSCs. Important-ly, these studies highlight the critical relationship between the differing molecular pathogenesis of the various medulloblastoma subgroups and the spatio-temporal origins of the NSCs in which the initiating tumorigenic events occur. For example, expression of mutant n-Myc in E16 cerebellar NSCs induces SHH medullo-blastoma, while expression of the same mutant at P0, produces medulloblastoma with human Group 3 characteristics [13]. SHH and Group 3 medulloblastoma have also been generated using other approaches, including deletion of Ptch1 [14] in GFAP+ cerebellar NSCs, and combined inactivation of Rb and p53 in CD133+ NSCs [15], respectively. Finally, medulloblastoma that mimic the human WNT subgroup were initiated by activating CTNNB1mutations in dorsal brainstem precursors [5]; however, GFAP+cerebellar stem cells may also be the cell of origin for some WNT group tumors [16]. In murine tumor models, transcriptional profiling comparisons suggest that WNT and SHH-medulloblas-toma arise during early embryonic development equivalent to the first 6 weeks of human embryogenesis [17]. Similar human studies are lacking due to the ethical issues associated with obtaining human embryonic and foetal brain tissues, and little is known of the spatio-temporal origins of human Group 3 and Group 4 medulloblastoma. For SHH and WNT medulloblastoma, gene expression profiles overlap with stem cell regulatory pathways [18– 20] while activated expression of later neuronal signaling and maintenance pathway genes, is characteristic of Group 3 and Group 4 medulloblastoma [21].
To define the spatio-temporal relationships of human medul-loblastoma subgroups from a neuro-developmental perspective, we aligned the transcriptional profiles of two primary medulloblasto-ma cohorts with the profiles of early humedulloblasto-man neural tissues and cell types that represent different stages of embryonic and early foetal human neural development. Our data demonstrate the molecular relationships between medulloblastoma subgroups and normal neural cell types at distinct developmental stages, and highlight subgroup specific deviation of expression profiles away from normal neuronal lineage differentiation patterns, which may contribute to the pathogenesis of medulloblastoma subgroups.
Materials and Methods
Patient specimens
The study was approved by the Princess Margaret Hospital for Children (PMH) Human Ethics Committee (Perth, Western Australia) and written consent was obtained for the use of all samples for research. The Australian medulloblastoma cohort (AU-MB) included 19 childhood medulloblastoma specimens obtained from PMH (n = 14) and the Westmead Tumour Bank (WTB), Sydney, New South Wales (n = 5). For more details about the AU-MB cohort and developmental control samples refer to Table S1. Normal fetal germinal matrix (NFGM) samples were obtained from the lateral sub-ventricular zones of two 16 week old aborted male fetuses at King Edward Memorial Hospital, Perth, Western Australia. Human normal fetal brain (NFB) consisted of total RNA pooled from 50 individuals (embryonic week 22–33) and was purchased from BD Bioscience (Palo Alto, CA, USA). Expression profiles of 46 independent medulloblastoma samples
[22] were obtained from St. Jude Children’s Research Hospital (SJ-MB, http://St Juderesearch.org).
Neural stem cell culture
Human neurospheres were derived from embryonic stem cell (hESC) lines hES3, hES4 (ES Cell International, Singapore, http://www.escellinternational.com) and MEL1 (StemCore, Mel-bourne, VIC, Australia, http://www.stemcore.com.au), derived from three different individuals, using a protocol described previously [23,24]. In brief, hESCs were co-cultured for 14 days on a layer of mitomycin-C-treated mouse embryo fibroblasts in the presence of the BMP2-antagonist, Noggin (500 ng/ml; R&D Systems – Bioscientific, Gymes Australia). Cell clumps were mechanically excised from Noggin-treated colonies and trans-ferred to 96-well ultra-low adherence plates (Corning, Corning, NY, USA). Neurospheres were cultured up to 12 weeks in neural basal medium (NBM) (Gibco, Invitrogen, Carlsbad, CA, USA) supplemented with N2 (Gibco), B27 (Gibco), Penicillin/Strepto-mycin (Gibco), L-Glutamine (Sigma, St Louis, MO, USA), Interferrin-Transferrin-Selenium (Gibco), EGF (20 ng/ml; Sigma) and bFGF (20 ng/ml; Chemicon, Temecula, CA, USA). Growth factors were added fresh every 2–3 days during media change. Neurospheres were quartered and replated for propagation as described previously [25].
Isolation of CD133+ NSCs
Neurospheres consisting of,30% CD133+ NSCs and,70% CD133- neural progenitor cells (NPCs) [23,26], were dissociated using a trypsin-based neural tissue dissociation kit (Miltenyi Biotec, Bergisch Gladbach, Germany). Cells were centrifuged (4006g) and resuspended in FACS buffer (PBS supplemented with 0.5% bovine serum albumin (BSA) (Sigma) and 2 mM ethylene diamine triacetic acid (EDTA) (Sigma). Cells were blocked with fragment crystallisable region (FcR) (Miltenyi Biotec) for three min at room temperature and incubated with AC133/1-Phycoerythrin (PE) and CD133/2(C293)-PE antibodies (Miltenyi Biotec) on ice for 20 min. As negative controls, cells were incubated with IgG2b-PE (Santa Cruz Biotechnology, Santa Cruz, CA, USA) at the same concentration, or antibodies were omitted. Excess antibody was removed by washing in FACS buffer, and samples were isolated using an ARIA-I flow cytometer (BD Biosciences, San Jose, CA, USA). CD133+
NSCs were isolated from neurosphere cell lines MEL1, hES3, and hES4, at 90% or greater purity (Table S1). The purity of CD133- NPCs derived from the same cell lines was consistently greater than 99%. The expression ofPROM1 (p, 0.05) andNES(p,0.01) was significantly higher in the CD133+ compared to the CD133-depleted samples consistent with successful enrichment of CD133+NSCs (data not shown).
Tissue processing and mRNA extraction
1ml glycogen (Ambion, Foster City, CA, USA). After 1 hr at 2 20uC, the samples were centrifuged (13000 rpm) for 20 min at 4uC. The RNA pellet was washed twice with 80% ethanol and air-dried prior to resuspension in 10ml DEPC-treated water. RNA integrity was measured with an Agilent 2100 Bioanalyser (Agilent, Santa Clara, CA, USA).
Gene expression analysis
The gene expression profiles of the AU-MB cohort were generated using human U133A arrays (Affymetrix, Santa Clara, CA, USA) and a protocol described previously [27]. Annotated raw and processed mRNA expression data are available NCBI GEO accession no. GSE62600.
The SJ-MB gene expression profiles are publically available and were generated using the Affymetrix human U133A_v2 array [22]. Statistical analysis was performed in R 2.14.0 (http://www.r-project.org) and bioconductor version 2.10 (http://www. bioconductor.org). Affymetrix cel files were normalized using robust multi-array average (Package:affy). For statistical analysis, simpleaffy, annotate, hgu133acdf, limma, vegan and matrixStats packages were used. The Student’s T-test was performed pair-wise between all sample groups with p,0.05 deemed as significant. For comparison to NFB (one value only) the NFB expression value was tested for inclusion or exclusion from medulloblastoma sample distribution using standard deviation (stdev) as membership cut off. Tables with mean 6 stdev, median, variance, fold change, Student’s T-test values ands-fold deviation were generated for all medulloblastoma subgroupsversus all control samples. Principal component analysis (PCA) and global hierarchical clustering was performed in R (Package:stats). The AU-MB cohort was classified into molecular subgroups using principal components analysis (PCA) and alignment to SJ-MB subgroups as previously deter-mined [28]. For classification, we used 20 of 24-classifier genes (LEF1, RUNX2, DCX, MAB21L1, PTCH1, PDLIM3, NEU-ROG1, DLL3, PDGFA, FOXG1B, GRM1, VAMP4, CDKN1C, SERPINF1, NRL, CRX, NMNAT2, SMARCD3, GABRA5and DCC) reported by Kool et al (2008) [28]. The remaining four genes, OTX2, LEMD1, PTPN5 and ZNF179, were not represented on the U133A array used in this study. The 24-classifier genes were identified from the analysis of Affymetrix gene expression data generated from 62 medulloblastoma that were further validated in an independent cohort of 46 specimens. The 24-classifier gene set represented the smallest set of genes with the greatest variance in expression, which also showed the most robust cluster result with the highest support from bootstrap analysis [28]. For the various sample groups, cluster coordinate centroids were calculated and centroid distance was generated as geometric vector length. Results were graphed using R, Excel version 14.0.0 (Microsoft) and Adobe Illustrator (Creative Suite 5.5, Adobe).
Developmental intersect analysis (DIA)
The medulloblastoma expression intersect database was con-structed using SequelPro 0.9.9.1 (http://www.sequelpro.com), and tabular data were imported from R. Probe sets ranging below 200 intensity units were deemed below detection limit. Using structured query language (SQL), the compiled Student’s T-test result database was queried for significantly differentially expressed transcripts in the medulloblastoma subgroups in comparison to all controls using a step-wise intersect protocol. Query results were analyzed using Ingenuity Pathway Analysis (IPA, http://www. ingenuity.com).
Weighted Gene Co-expression Network Analysis (WGCNA)
Genes operating in neighbourhoods (clusters) are often co-expressed [29], and genes clusters can form associated cluster families. Mathematically, the association strength acts as a distance measure for clusters in networks, which organizes clusters spatially within the network. This can be graphed as dendograms representing clusters as branches. When relating non-expression characteristics (traits) to such networks, their association will reveal relationships with specific functional neighbourhoods. Co-expres-sion network clustering was performed in R (Package:WGCNA) according to the protocol of Langfelder and Horvath [30]. In brief, medulloblastoma gene expression data derived from both cohorts were filtered and low signal probe sets with low expression variation were omitted. Probe sets with the extensionx_at were omitted. The remaining 6052 probe sets were used for approx-imation to the scale-free small world network model. Genes were grouped into clusters of significantly co-expressed gene sets using Pearson statistics. The correlation of clusters was used to construct cluster families within the network. For developmental alignment, co-expression network clusters were correlated to mean intensity of developmental control samples in order of their alignment derived from PCA and compared to alternative order possibilities. Pearson correlation coefficients and p values were generated for each alignment order and cluster. Cluster families were constructed using cluster Eigengenes (the normalized linear combination of genes with largest variance in a population), considered as the representative gene expression pattern of each cluster. For association of medulloblastoma subgroups and cluster families, molecular subgroup membership of medulloblastoma samples was correlated to clusters using a binary matrix. Genes within co-expression clusters of interest were analyzed using SQL and IPA for over-expression and pathway enrichment as described above.
Results
Medulloblastoma molecular subgroups align along a neuronal differentiation continuum
variation accounted for by the third PC reflected differences between neoplastic and non-neoplastic samples, and intersect analyses revealed that this variance was derived from differential expression of chromatin regulators (data not shown). The spatial distance between sample groups was established using the geometric distance of group centroid for PC1, 2 and 4 (Fig. 1c). This revealed that WNT and SHH subgroups clustered closest to NSCs and NPCs, indicating less variance between these medul-loblastoma groups and embryonic cell types. Group 4 clustered closest to NFB, then NFGM, highlighting a closer relationship to an early fetal cell type. Both hierarchical clustering and multivariate analysis showed that Group 3 medulloblastoma did not cluster particularly close to any early developmental control, with the nearest neighbor being NFGM by PCA. We brought together the PC data (Fig.1b), additional statistical parameters (cluster scatter and cluster shape), as well as known biology to summarise the spatial relationships between controls and medul-loblastoma subgroups, and project them schematically onto a brain development timeline (Fig. 1d). This represents a spatio-temporal snapshot of the medulloblastoma developmental signa-tures aligned to control samples in this study.
The alignment of NSCs, NPCs, NFGM and NFB with WNT, SHH, Group 3 and Group 4 medulloblastoma was tested using gene signatures organized into functional genetic neighborhoods. A gene co-expression network was constructed using all medul-loblastoma samples generating 27 gene clusters that formed at least five cluster families (A–E) (Fig. S2). To test the proposed medulloblastoma alignment to controls as shown schematically (Fig. 1d), possible alignments were treated as traits and associated with the medulloblastoma network. Cluster family E was the genetic neighborhood most descriptive for alignment analysis and was strongly correlated with the association of WNT/SHH subgroups with embryonic samples and Groups 3 and 4 with foetal samples. Cluster correlation increased when WNT medul-loblastoma were associated with NSCs instead of NPCs, and Group 3 with NFGM instead of NFB. Consistent with PCA, transcripts from the functional neighborhood E correlated most strongly (Pearson coefficient = 0.87, p,2.2610216). Since this neighborhood contains neuronal differentiation gene sets, medul-loblastoma subgroups (WNT,SHH,Group 3,Group 4) may represent stages of a neuronal differentiation continuum.
WNT and SHH pathway activation is higher in WNT and SHH medulloblastoma than NSCs
To identify functional neighborhoods descriptive for medullo-blastoma subgroups, the membership of each medullomedullo-blastoma in a molecular subgroup was used as a trait. Analysis of associations between co-expression network clusters and membership (traits) showed that distinct subgroups are significantly correlated with distinct gene clusters of the co-expression network (Fig. 2a). Taking the network organization of clusters into account, medulloblastoma subgroups associated with cluster families (Fig. 2b) that contained distinct genetic functional neighborhoods. The associated gene sets of the clusters represent major functional genetic connections underlying medulloblastoma expression pro-files and provide clues to mechanisms of pathogenesis.
WNT medulloblastoma were most strongly associated (Pearson coefficient = 0.92; p,7e227) with only one cluster of co-expressed genes enriched for WNT/b-catenin signaling (p,0.002), and WNT-related cancer gene sets (BCC, GBM, ovarian cancer, p, 0.01) (Table. 1) and not any other cluster or cluster family. Transcripts contributing significantly to these enrichments encod-edWNT16, DKK1andLEF1that are specifically over-expressed in WNT medulloblastoma irrespective of developmental control
comparison (Fig. 2c). These gene sets overlapped strongly with intersect analyses selecting for exclusively over-expressed tran-scripts in WNT medulloblastoma irrespective of control compar-ison (Table S3, S4). In contrast, SHH medulloblastoma associated with cluster family B, containing genes enriched for SHH signaling (p = 0.01), as well as extracellular matrix-affiliated pathways (Table. 1). The main contributors to these enrichments are GLI2, PTCH1, PTCH2, AXIN, MATH1 and a number of collagen genes. Some of these genes are exclusively over-expressed in SHH medulloblastoma (Fig. 2d). These data demonstrate that the co-expression network alignment and intersect analysis strategy was able to filter for known deregulation of WNT and SHH pathway members in WNT and SHH medulloblastoma, respectively. These two gene sets represent distinct stem cell maintenance pathways that are strongly linked and exclusively over-expressed in these subgroups. Of note, the expression of most WNT and SHH pathway members was significantly higher in WNT or SHH-medulloblastoma than in CD133+
NSCs (Fig. 2c, d). In contrast, members of the NOTCH signaling pathway, another major stem cell maintenance pathway, were not highly expressed in any medulloblastoma subgroup compared to NSCs and their immediate derivatives (Fig. S3).
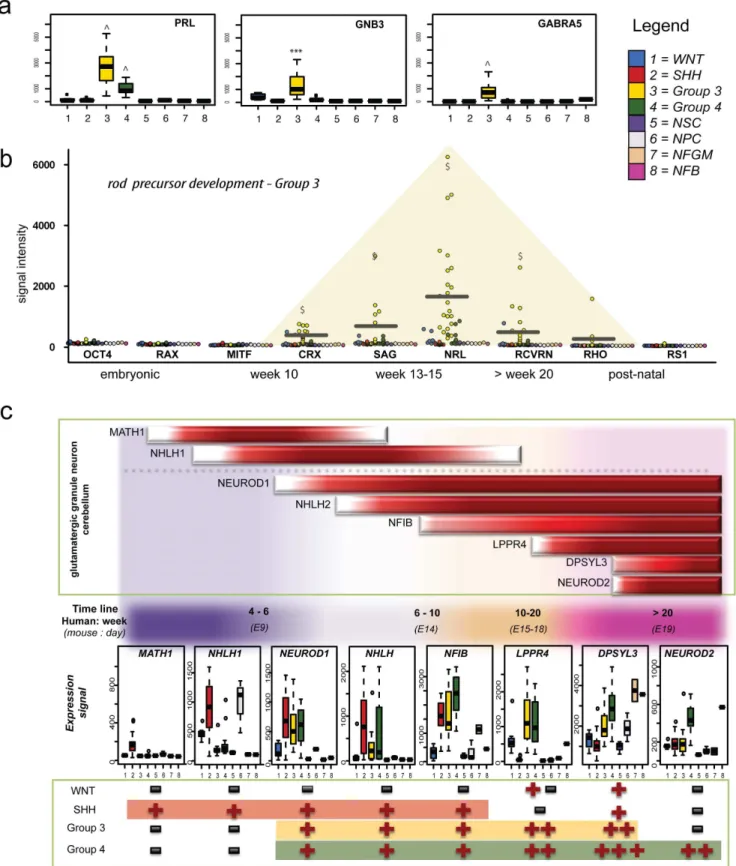
Group 3 photoreceptor gene neighbourhood signatures are reminiscent of rod, but not cone, precursor cells at weeks 10 to 15 of human neurodevelopment
Using the above analysis strategy, we were able to identify genes and pathways that were differentially regulated in Group 3 medulloblastoma irrespective of the control group comparison (Table S2, S3). Pathways identified from these analyses included the photo transduction pathway (p = 2.51610212), protein kinase A signaling (p = 0.002), glutamate (**p,0.01) and glucocorticoid (*p,0.02) receptor signaling 3 (Table. 1). Some individual members of these pathways, includingGNB3, GNB5, GABRA5, RCVRN and SAG were exclusively over-expressed in Group 3 medulloblastoma (Fig. 3a). In comparison to previous studies reporting general photoreceptor pathway activation as a hallmark of Group 3 medulloblastoma, this study revealed that Group 3 expression profiles were characteristic of early rod cell differen-tiation, whereas cone lineage genes were not expressed (Fig. S4). Rod development genes expressed by Group 3 medulloblastoma were representative of week 10–20, corresponding to the mid fetal phase of retinal or pineal development. The early rod precursor-specific transcripts,CRXandNRLwere exclusively and strongly over-expressed by Group 3 medulloblastoma (Fig. 3b). Further, rhodopsin (RHO) and retinoschisin 1 (RS1) normally highly expressed by functional rod cells post-natally, were weakly expressed, but detectable in most Group 3 samples. Temporally, this stage of early rod determination is best represented by NFGM in this study. Despite the large spatial deviation between Group 3 medulloblastoma and any control group in previous cluster analyses, NFGM remained the most suitable control for compar-ison within this data set. A selection of the most differentially expressed genes in Group 3 compared to NFGM (including NEUROD1, MYC, SOX2, andDLX) is listed in Table 2.
Novel connections between granule neuron development and cell cycle regulation in Group 4 medulloblastoma
characteristic of Group 4 medulloblastoma are reminiscent of active glutamatergic neurons (reviewed by Northcott et al. [31]), although this link has not been investigated in detail. With this in mind, we assessed key transiently activated neural transcription factors (MATH1, NHLH1), and other temporally activated genes (NEUROD1, NHLH2, NFIB, LPPR4, DPYSL3, NEUROD2) expressed throughout granule neuron differentiation, in the medulloblastoma subgroups (Fig. 3c). Alignment of the glutama-tergic gene expression markers showed that SHH, Group 3, and Group 4 subgroups all express glutamatergic granule neuron genes, but from different temporal stages of development. SHH medulloblastoma resembled granule precursor cells (GPCs) in the external granule layer (EGL) around week 6 of human embryo-genesis, whereas Group 3 resembled granule neuron precursors
(GNPs) in the EGL around week 15, and Group 4 expressed genes that are only activated during late fetal development of the cerebellar EGL and cortex. We also observed activation of the Reelin pathway, another hallmark of granule neuron development in the cerebellum, in all medulloblastoma molecular subgroups, except for WNT tumors (Fig. 4a). Reelin pathway activation during the late embryonic to early fetal period of gestation has been observed in mouse model [32], and increasing expression of reelin pathway components, TAU and DCX, in neurodevelop-mental tissues representing equivalent human stages was also observed in this study (Fig. 4a).
It is unclear how the neuronal developmental gene sets activated in Group 4 medulloblastoma are involved in the pathogenesis of this subgroup. When we investigated associated network clusters
Figure 1. Alignment of molecular subgroups to developmental controls. a.Unsupervised clustering using global expression signatures of the AU-MB cohort and developmental controls is displayed with patient gender, age and tumor histology features.b.Multivariate analysis of combined AU-MB and SJ-MB cohorts using 20-gene molecular subgroup classifiers. Spatial distribution of medulloblastoma subgroups and developmental control samples is graphed for the first four largest variances. Medulloblastoma subgroup variance in the context of control samples is best displayed by PC1, 2 and 4.c.Distance measures of controlversusmedulloblastoma subgroups by geometric distance of group centroid in the variance dimensions PC1 and PC2. The arbitrary distance units were graphed on a blue (far) to red (close) scale.d.Interpretation of spatial and temporal association of clustering alignment analyses. Geometric distance of medulloblastoma subgroups to all control samples groups is schematically graphed in distance along the temporal brain development axis (x-axis) and spatial axis (y-axis, average distance of subgroup to all control groups).AU-MB – Australian medulloblastoma cohort (solid symbols), NFB - normal fetal brain, NFGM - normal fetal germinal matrix, NPC - neural progenitor cells, NSC - neural stem cells, PC – principal component, SJ-MB – St Jude medulloblastoma cohort (open symbols).
and exclusively differentially expressed transcripts in Group 4 medulloblastoma (Table 1, Table S2, S3), we found that several associated pathways contain co-expressed genes forming bridging pathway links. Semaphorin (co-expression network, p, 1.2361025) and dopamine (intersect analysis, p,0.02) signaling pathways were exclusively enriched in Group 4 medulloblastoma and connected via co-expressed genes, DPYSL4, RND2 and SNCAIPthat are all part of the same network cluster (Fig. 4b,c). Both pathways were connected in the same co-expression cluster withTAUand DCXof the reelin pathway. Further, semaphorin pathway members, RND2, DPYSL3, RAC1 and FNBP1 are known to interact with apoptosis regulatorsTP53andROBO1, as well as neuronal survival genesNTF3andNEUROG1during the late fetal synaptic pruning phase [33–36]. Whilst expression of apoptosis genesTP53andROBO1was below the detection limit, the pro-survival genes NTF3 and NEUROG1 were
over-expressed in Group 4 medulloblastoma, irrespective of control comparison (Fig. 4b). Considering thatNTF3is also part of the same cluster family of the network, this implies a functional connection between deregulation of reelin, dopamine and cell cycle pathways that is worth exploring in the context of Group 4 pathogenesis.
Discussion
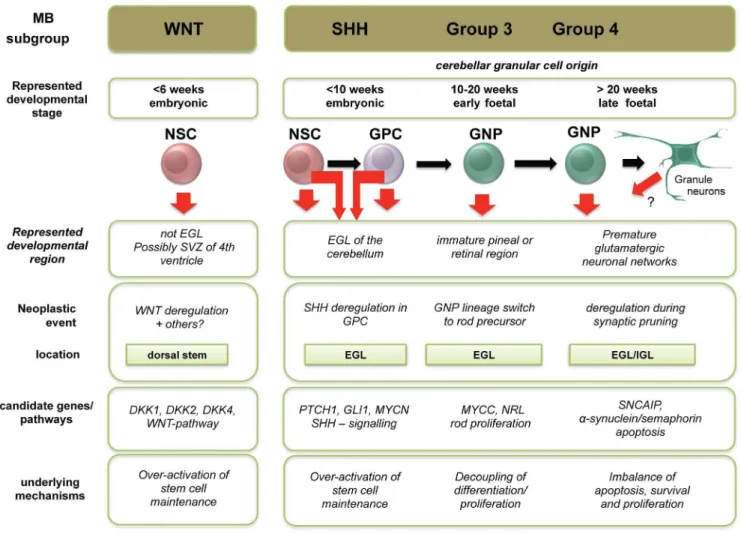
The current evidence suggests that medulloblastoma subgroups arise in distinct regions of the cerebellum or cerebellar vicinity [6,7] and are associated with characteristic genetic aberrations affecting the local cell of origin [5]. Our data revealed molecular relationships of medulloblastoma subgroups to distinct develop-mental control samples, and highlighted subgroup-specific devia-tion in gene expression from normal neuronal lineage
ation programs that may contribute to medulloblastoma patho-genesis (Fig. 5). Extending on this idea, we hypothesised that shared expression features between medulloblastoma subgroups and specific controls may be indicative of the neuro-developmental stage and potentially, the cell of origin. WNT and SHH medulloblastoma consistently clustered closer to embryonic-derived cell types, whereas Group 3 and Group 4 medulloblas-toma clustered closer to foetal samples. Consistent with the literature [3], WNT medulloblastoma expression signatures set them apart from the other three subgroups. Our data suggest that this may be linked to the relative inactivity of neuronal developmental pathways, reflected by reduced expression of glutamatergic granule neuron markers and reelin pathway members, which are strongly expressed in normal granule cell precursors during early cerebellar development and into post-natal stages [37]. We noted that several reelin pathway members are
significantly over-expressed in SHH, Group 3 and Group 4 medulloblastoma, but are not expressed in the WNT subgroup. RELN mutations cause mis-alignment and degeneration of granule neurons in the cerebellar cortex [38,39]. However, the oncogenic implications of reelin hyper-activation or ectopic expression during neuronal differentiation have not been deter-mined and warrant further investigation.
In accord with previous reports [21,22,28], we identified distinct groups of co-expressed genes that were highly enriched for WNT signalling in WNT medulloblastoma, (including DKK1, DKK2, DKK4, WIF1, LEF1andWNT16). Similarly, over-expression of associated network clusters enriched for SHH pathway members, GLI1, PTCH1 and PTCH2, was exclusive to human SHH medulloblastoma, and expression levels were significantly higher than in CD133+NSCs, NPCs and all other controls used in this study. WNT and SHH signalling regulate NSC self-renewal and Table 1.Pathway enrichment of medulloblastoma-associated co-expression cluster families.
Enriched pathways p, Contributing genes
WNT brown cluster (342 probes) Wnt/b-catenin Signaling 0.002 FZD10, CDH2, WIF1, DKK4, WNT16, DKK2, LEF1, DKK1, FZD7
Glioblastoma Multiforme Signaling 0.003 FZD10, PDGFRA, CDK6, WNT16, PLCB1, LEF1, PDGFC, FZD7
Basal Cell Carcinoma Signaling 0.006 FZD10, BMP4, WNT16, LEF1, FZD7
Ovarian Cancer Signaling 0.006 FZD10, LHCGR, WNT16, LEF1, MMP2, PDGFC, FZD7
SHH cluster family B) (358 probes) Hepatic Fibrosis 0.002 COL1A2, COL1A1, IGFBP4, FGFR1, IGFBP5, PGF, COL3A1, EGFR
Molecular Mechanisms of Cancer 0.003 RAP2B, A XIN1, ARHGEF7, PTCH1, PTCH2, FOXO1, GAB1, RHOB, MAPK10, BID, MAP2K3, CDK2, CTNND1
Basal Cell Carcinoma Signaling 0.005 GLI2, AXIN1, PTCH1, DVL3, PTCH2
Sonic Hedgehog Signaling 0.010 GLI2, PTCH1, PTCH2
Group 3 cluster family D (508 probes) Phototransduction Pathway 3.89E210 PDE6G, GUCA1A, GNGT1, GNB5, PRKAR2A, PDE6H, GNB3, GNAT1, RHO, PDC, SAG, CNGB1, RCVRN
Protein Kinase A Signaling 0.0087 RAF1, PDE6G, MYL6, PTP4A3, GNB5, PRKAR2A, MYL6B, PTPRF, PDE6H, GNB3, RHO, PPP1R10, TGFB1, TGFB3, CNGB1, TNNI1, CDC25A, MTMR3
Cyclins and Cell Cycle Regulation 0.0138 RAF1, TGFB1, ABL1, TGFB3, HDAC5, CDC25A
Estrogen Receptor Signaling 0.0141 CTBP1, RAF1, POLR2A, NCOR2, MED24, TRRAP, MED27, SMARCA4
Group 4 cluster family E (343 probes) Semaphorin Signaling in Neurons 1.23E205 RND2, CRMP1, DPYSL3, DPYSL4, DIRAS3, RAC1, FNBP1
Glioblastoma Multiforme Signaling 7.41E205 RND2, SRC, TSC1, DIRAS3, IGF1R, RAC1, PLCL2, CDKN1B, PLCH2, FNBP1
Axonal Guidance Signaling 1.20E204 NTF3, ITSN1, EPHB2, TUBB2A, RAC1, PLXNA2, PLCL2, GNAZ, PLCH2, NCK2, SRGAP3, PRKAR2B, TUBA1A, PTPN11, PPP3CB, GNAO1, BAIAP2
Gap Junction Signaling 1.23E204 DBN1, HTR2C, SRC, PRKAR2B, TUBA1A, PPP3CB, ADCY1, TUBB2A, PLCL2, PLCH2
Actin Nucleation by ARP-WASP Complex 1.91E204 RND2, NCK2, DIRAS3, BAIAP2, RAC1, FNBP1
Cardiac Hypertrophy Signaling 0.001 RND2, PRKAR2B, PPP3CB, DIRAS3, GNAO1, ADCY1, IGF1R, PLCL2, GNAZ, PLCH2, FNBP1
Ephrin B Signaling 0.001 NCK2, ITSN1, EPHB2, GNAO1, RAC1, GNAZ
RhoGDI Signaling 0.001 RND2, SRC, DIRAS3, GNAO1, RAC1, PIP4K2B, CDH18, GNAZ, FNBP1
Sphingosine-1-phosphate Signaling 0.001 RND2, DIRAS3, ADCY1, RAC1, PLCL2, PLCH2, FNBP1
Regulation of Actin-based Motility by Rho 0.001 RND2, DIRAS3, BAIAP2, RAC1, PIP4K2B, FNBP1
Clathrin-mediated Endocytosis Signaling 0.002 SRC, ARRB1, PPP3CB, EPHB2, SH3GL3, RAC1, HIP1, FGF13, HIP1R
Neuregulin Signaling 0.002 SRC, PTPN11, ERBB4, CDKN1B, STAT5B, CDK5R1
differentiation [40], and deregulation of these pathways is consistent with mouse models implicating a NSC cell of origin for at least some WNT and SHH subgroup medulloblastoma [14,15].
Our data indicate that the expression profiles of SHH, Group 3 and Group 4 medulloblastoma are similar to cerebellar granule neuron gene expression signatures, but there are distinct differences in the specific pathways that are active. Molecular studies comparing the four medulloblastoma subgroups revealed that Group 3 medulloblastoma exclusively express photoreceptor genes normally associated with retinal development [8,21,28]. Our data significantly extend these findings, and indicate that the expression profiles of Group 3 medulloblastoma resemble that of rod precursor cells at week 15 of human retinal development. All Group 3 medulloblastoma expressed the transient rod precursor geneNRLat high levels, and most over-expressedCRXandSAG, with only a few expressing mature rod cell genes, RCVRNand RHO. The expression of the latter markers has been well documented in normal rod/cone specification during
embryogen-esis [41]. In contrast, the pre-rod-determination gene,MITF, and cone cell markers normally expressed after lineage commitment to cone cells [42], were not expressed in Group 3 medulloblastoma. CRX is a down stream target of the neuronal differentiation repressor OTX2. The latter is known to be over-expressed in medulloblastoma [43] raising the possibility that over-expression of OTX2 causes a premature halt in neuronal differentiation. WhileOTX2 and CRX are both expressed in the retina, pineal region and EGL from E16 of murine development (equiv. week 10 in human),CRXexpression regresses to the pineal gland from E18 (equiv. to week 15 human) and is not detectable in normal mouse cerebellum at all after this time [44]. Therefore, it seems possible that during this developmental window, OTX2 and CRX expression deviates from normal differentiation patterns generat-ing phenotypes more reminiscent of a retinal or pineal cell. The fact thatCRXis expressed by Group 3 medulloblastoma as well as most pineal tumours [45], and that Group 3 medulloblastoma and pineoblastoma are often histologically indistinguishable [45,46] and share a poor prognosis despite intensive therapy, supports the all control groups but not exclusive for medulloblastoma subgroup, NFB - normal fetal brain, NFGM - normal fetal germinal matrix, NPC - neural progenitor cells, NSC - neural stem cells.
doi:10.1371/journal.pone.0112909.g003
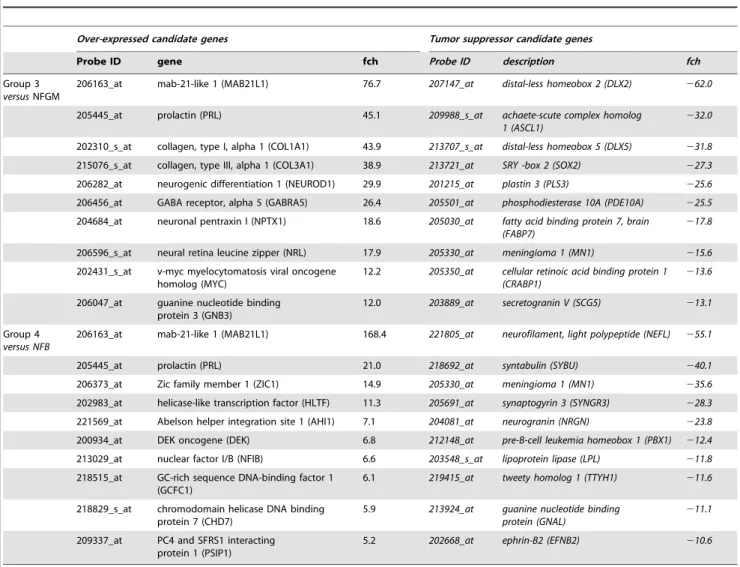
Table 2.Over-expressed transcripts in Group 3 and Group 4 medulloblastoma.
Over-expressed candidate genes Tumor suppressor candidate genes
Probe ID gene fch Probe ID description fch
Group 3
versusNFGM
206163_at mab-21-like 1 (MAB21L1) 76.7 207147_at distal-less homeobox 2 (DLX2) 262.0
205445_at prolactin (PRL) 45.1 209988_s_at achaete-scute complex homolog
1 (ASCL1)
232.0
202310_s_at collagen, type I, alpha 1 (COL1A1) 43.9 213707_s_at distal-less homeobox 5 (DLX5) 231.8
215076_s_at collagen, type III, alpha 1 (COL3A1) 38.9 213721_at SRY -box 2 (SOX2) 227.3
206282_at neurogenic differentiation 1 (NEUROD1) 29.9 201215_at plastin 3 (PLS3) 225.6
206456_at GABA receptor, alpha 5 (GABRA5) 26.4 205501_at phosphodiesterase 10A (PDE10A) 225.5
204684_at neuronal pentraxin I (NPTX1) 18.6 205030_at fatty acid binding protein 7, brain (FABP7)
217.8
206596_s_at neural retina leucine zipper (NRL) 17.9 205330_at meningioma 1 (MN1) 215.6
202431_s_at v-myc myelocytomatosis viral oncogene homolog (MYC)
12.2 205350_at cellular retinoic acid binding protein 1 (CRABP1)
213.6
206047_at guanine nucleotide binding protein 3 (GNB3)
12.0 203889_at secretogranin V (SCG5) 213.1
Group 4
versus NFB
206163_at mab-21-like 1 (MAB21L1) 168.4 221805_at neurofilament, light polypeptide (NEFL) 255.1
205445_at prolactin (PRL) 21.0 218692_at syntabulin (SYBU) 240.1
206373_at Zic family member 1 (ZIC1) 14.9 205330_at meningioma 1 (MN1) 235.6
202983_at helicase-like transcription factor (HLTF) 11.3 205691_at synaptogyrin 3 (SYNGR3) 228.3
221569_at Abelson helper integration site 1 (AHI1) 7.1 204081_at neurogranin (NRGN) 223.8
200934_at DEK oncogene (DEK) 6.8 212148_at pre-B-cell leukemia homeobox 1 (PBX1) 212.4
213029_at nuclear factor I/B (NFIB) 6.6 203548_s_at lipoprotein lipase (LPL) 211.8
218515_at GC-rich sequence DNA-binding factor 1 (GCFC1)
6.1 219415_at tweety homolog 1 (TTYH1) 211.6
218829_s_at chromodomain helicase DNA binding protein 7 (CHD7)
5.9 213924_at guanine nucleotide binding protein (GNAL)
211.1
209337_at PC4 and SFRS1 interacting protein 1 (PSIP1)
5.2 202668_at ephrin-B2 (EFNB2) 210.6
idea of a molecular relationship between the two. For medullo-blastoma, the relationship between rod receptor signatures and neoplastic transformation remains unclear, but we speculate that deregulated differentiation and lineage switch to rod fate may play an important role.
Our data indicate that the expression profiles of Group 4 medulloblastoma are similar to cerebellar glutamatergic granule neurons at late foetal developmental stage (.week 20). Group 4 medulloblastoma expressed late granule neuron markers and reelin pathway members most highly, which are normally expressed in granule cell precursors during cerebellar development and into post-natal stages [37]. Most of our data demonstrating dominant expression of genes regulating neuronal migration, differentiation and synaptic development is consistent with previous findings [21]. We confirmed SNCAIP as exclusively expressed in Group 4 medulloblastoma [47], and we also identified SLC6A3 as a significantly over-expressed and highly
connected pathway member. In glutamatergic neurons,SNCAIP and SLC6A3 are involved in the regulation of dopamine concentration [48]. Over-expression of SNCA or SNCAIP in GPCs has been shown to promote GPC proliferation and protection from apoptosis [49–52]. Interestingly, a recent report describing epigenetic repression of the dopamine receptor family member, DRD4, in primary medulloblastoma adds further support for a significant role for deregulated dopamine signalling in medulloblastoma pathogenesis [53]. Additional novel findings from our analysis indicate that Group 4 medulloblastoma over-express semaphorin signalling molecules, includingDPYSL3and DPYSL4, which regulate neuronal differentiation and apoptosis in the context of synaptic pruning [54]. Overall, our results build significantly on previous data and implicate an important connection between dopamine, semaphorin signalling and cell cycle deregulation in the pathogenesis of Group 4 medulloblas-toma. These pathways may constitute promising therapeutic
Figure 4. Granule neuron signatures of Group 4 medulloblastoma.a. Differential expression of reelin signaling members b. Semaphorin signaling pathway members and downstream mediators and c. Dopamine/a-synuclein signaling pathway members are shown for all sample groups using Box-Whisker plots.*2p,0.05, **2p,0.01, ***2p,0.001,‘2p,0.05 compared to all control groups but not exclusive for medulloblastoma
targets to combat medulloblastoma angiogenesis, growth and metastases [53,55,56].
The consensus in the field is that the four medulloblastoma subgroups will be further subdivided as more genomic data become available, and more refined animal models are developed. Additional subtypes will likely be derived from distinct intra or extra cerebellar cells of origin. Clearly, this hetereogeneity complicates comparative analysis of medulloblastoma expression profiles to those of selected ‘‘normal’’ cells, including whole human foetal cerebellum. In this study we assessed highly purified cell populations from cultured neurospheres, as well as heterogeneous cell populations from resected tissues. Although the transcriptional profiles of cell lines maintained in vitrowill inevitably differ to some extent from intra or extra cerebellar NSCs within the normal developing brain [57], the human ESC-derived NSCs analysed in our study self renew and differentiate normallyin vitro, and when transplantedin vivo[58]. Neurospheres are cultured in EGF and FGF, which is known to drive cell proliferation via SHH, WNT, and NOTCH signalling [59]. However, in this study, activation of these pathways correlated most closely with developmental stage rather than cultureversusnon-culture status. Overall, these data suggest that ESC derived NSC/NPCs represent a reasonable and practical option for comparison to medulloblastoma transcription-al profiles and characteristics.
Our data provide a valuable framework for the design of more refined cell of origin studies that are currently lacking in the human context, particularly for Group 3 and Group 4 medullo-blastoma (Fig. 5). For example, our data support the analysis of cell populations derived from GPCs, as well as retinal and pineal neuronal precursors, to address potential aberrant trans-lineage differentiation in the pathogenesis of Group 3 medulloblastoma. Indeed, GPCs and GNPs, as well as GNPs and rod precursor cells generated from ESC-derived NSCs [60–62] represent promising candidate populations for further genetic comparisons. In addi-tion, as described by our group previously [26], human ESC-derived NSCs may in turn be a usefulin vitro system to model medulloblastoma pathogenesis in vitro and potentially in vivo using orthotopic xenografts. Functional testing of proposed cancer driver genes in putative human cell of origin populations will be a crucial step towards the identification of novel therapeutic targets in the various medulloblastoma molecular subgroups.
Supporting Information
Figure S1 Variation distribution and length of principle component vectors for combined medulloblastoma cohorts and all developmental controls. Individual and
Figure 5. Schematic summary of the spatio-temporal alignment of medulloblastoma subgroups with proposed cells of origin.The summary shows novel concepts derived from this study integrated with existing medulloblastoma paradigms from the literature.EGL – external granule layer, GPC = granule precursor cell, GNP – granule neuron precursor, IGL – internal granule layer, NSC – neural stem cell.
accumulative total variation for the largest principle components as indicated. Discriminative components are marked in red. (DOCX)
Figure S2 Co-expression modules and developmental alignment.Medulloblastoma cluster families of the co-expression network were generated using Eigengenes. Cluster family E that associated closest with alignment orders was emphasized in red shading. NFB – normal foetal brain, NFGM – normal foetal germinal matrix, NPC – neural progenitor cells, NSC – neural stem cells.
(DOCX)
Figure S3 Expression of NOTCH pathway members in medulloblastoma subgroups and control. Most NOTCH signalling members were significantly lower expressed in medul-loblastoma subgroups than in NSC-rich samples. Expression levels were graphed using Box-Whisker plots. ¢2p,0.05 compared to all medulloblastoma subgroups. NFB – normal foetal brain, NFGM – normal foetal germinal matrix, NPC – neural progenitor cells, NSC – neural stem cells.
(DOCX)
Figure S4 Photoreceptor lineage expression alignment. Expression levels of transcripts known to be actively transcribed during cone lineage specification was presented as mean and standard deviation for all sample groups. NFB – normal foetal brain, NFGM – normal foetal germinal matrix, NPC – neural progenitor cells, NSC – neural stem cells.
(DOCX)
Table S1 Details of clinical cohort and developmental samples.
(DOCX)
Table S2 Transcripts over-expressed in all medullo-blastoma subgroups irrespective of control group com-parison.
(DOCX)
Table S3 Exclusive transcripts associated with pathway enrichment in medulloblastoma subgroups.
(DOCX)
Acknowledgments
The authors thank Dr Adrian Charles for the provision of human fetal germinal matrix samples and Dr Mirella Dottori for provision of cultured neurospheres and for critical input with questions in developmental neurobiology. The authors also thank Philippa Terry, Simone Egli and David Holthouse for technical assistance, and Dr. Gary Peh as well as StemCore, Melbourne, Victoria for training in culturing, differentiation and isolating ESCs and NSCs.
Author Contributions
Conceived and designed the experiments: CMH PBD URK. Performed the experiments: CMH. Analyzed the data: CMH. Contributed reagents/ materials/analysis tools: SMH. Wrote the paper: CMH NGG PBD SMH URK.
References
1. Pui CH, Gajjar AJ, Kane JR, Qaddoumi IA, Pappo AS (2011) Challenging issues in pediatric oncology. Nat Rev Clin Oncol 8: 540–549.
2. Kulkarni AV, Piscione J, Shams I, Bouffet E (2013) Long-term quality of life in children treated for posterior fossa brain tumors. J Neurosurg Pediatr 12: 235– 240.
3. Taylor MD, Northcott PA, Korshunov A, Remke M, Cho YJ, et al. (2012) Molecular subgroups of medulloblastoma: the current consensus. Acta Neuropathologica 123: 465–472.
4. Gottardo NG, Hansford JR, McGlade JP, Alvaro F, Ashley DM, et al. (2014) Medulloblastoma Down Under 2013: a report from the third annual meeting of the International Medulloblastoma Working Group. Acta Neuropathologica 127: 189–201.
5. Gibson P, Tong Y, Robinson G, Thompson MC, Currle DS, et al. (2010) Subtypes of medulloblastoma have distinct developmental origins. Nature 468: 1095–1099.
6. Wefers AK, Warmuth-Metz M, Poschl J, von Bueren AO, Monoranu CM, et al. (2014) Subgroup-specific localization of human medulloblastoma based on pre-operative MRI. Acta Neuropathologica 127: 931–933.
7. Teo WY, Shen J, Su JM, Yu A, Wang J, et al. (2013) Implications of tumor location on subtypes of medulloblastoma. Pediatr Blood Cancer 60: 1408–1410. 8. Cho YJ, Tsherniak A, Tamayo P, Santagata S, Ligon A, et al. (2011) Integrative genomic analysis of medulloblastoma identifies a molecular subgroup that drives poor clinical outcome. Journal of Clinical Oncology 29: 1424–1430. 9. Nguyen LV, Vanner R, Dirks P, Eaves CJ (2012) Cancer stem cells: an evolving
concept. Nature reviews Cancer 12: 133–143.
10. Singh SK, Hawkins C, Clarke ID, Squire JA, Bayani J, et al. (2004) Identification of human brain tumour initiating cells. Nature 432: 396–401. 11. Singh SK, Clarke ID, Terasaki M, Bonn VE, Hawkins C, et al. (2003)
Identification of a cancer stem cell in human brain tumors. Cancer Research 63: 5821–5828.
12. Hemmati HD, Nakano I, Lazareff JA, Masterman-Smith M, Geschwind DH, et al. (2003) Cancerous stem cells can arise from pediatric brain tumors. Proceedings of the National Academy of Sciences of the United States of America 100: 15178–15183.
13. Swartling FJ, Grimmer MR, Hackett CS, Northcott PA, Fan QW, et al. (2010) Pleiotropic role for MYCN in medulloblastoma. Genes and Development 24: 1059–1072.
14. Yang ZJ, Ellis T, Markant SL, Read TA, Kessler JD, et al. (2008) Medulloblastoma can be initiated by deletion of Patched in lineage-restricted progenitors or stem cells. Cancer Cell 14: 135–145.
15. Sutter R, Shakhova O, Bhagat H, Behesti H, Sutter C, et al. (2010) Cerebellar stem cells act as medulloblastoma-initiating cells in a mouse model and a neural
stem cell signature characterizes a subset of human medulloblastomas. Oncogene 29: 1845–1856.
16. Pei Y, Brun SN, Markant SL, Lento W, Gibson P, et al. (2012) WNT signaling increases proliferation and impairs differentiation of stem cells in the developing cerebellum. Development 139: 1724–1733.
17. Kho AT, Zhao Q, Cai Z, Butte AJ, Kim JY, et al. (2004) Conserved mechanisms across development and tumorigenesis revealed by a mouse development perspective of human cancers. Genes and Development 18: 629–640. 18. Kawauchi D, Robinson G, Uziel T, Gibson P, Rehg J, et al. (2012) A mouse
model of the most aggressive subgroup of human medulloblastoma. Cancer Cell 21: 168–180.
19. Leung C, Lingbeek M, Shakhova O, Liu J, Tanger E, et al. (2004) Bmi1 is essential for cerebellar development and is overexpressed in human medullo-blastomas. Nature 428: 337–341.
20. Pei Y, Moore CE, Wang J, Tewari AK, Eroshkin A, et al. (2012) An animal model of MYC-driven medulloblastoma. Cancer Cell 21: 155–167.
21. Northcott PA, Korshunov A, Witt H, Hielscher T, Eberhart CG, et al. (2011) Medulloblastoma Comprises Four Distinct Molecular Variants. Journal of Clinical Oncology 29: 1408–1414.
22. Thompson MC, Fuller C, Hogg TL, Dalton J, Finkelstein D, et al. (2006) Genomics identifies medulloblastoma subgroups that are enriched for specific genetic alterations. Journal of Clinical Oncology 24: 1924–1931.
23. Peh GS, Lang R, Pera M, Hawes S (2009) CD133 expression by neural progenitors derived from human embryonic stem cells and its use for their prospective isolation. Stem Cells and Development 18: 269–282.
24. Pera MF, Andrade J, Houssami S, Reubinoff B, Trounson A, et al. (2004) Regulation of human embryonic stem cell differentiation by BMP-2 and its antagonist noggin. Journal of Cell Science 117: 1269–1280.
25. Svendsen CN, ter Borg MG, Armstrong RJ, Rosser AE, Chandran S, et al. (1998) A new method for the rapid and long term growth of human neural precursor cells. Journal of Neuroscience Methods 85: 141–152.
26. Bertram CM, Hawes S, Egli S, Peh GS, Dottori M, et al. (2010) Effective adenovirus mediated gene transfer into neural stem cells derived from human embryonic stem cells. Stem Cells Dev 19: 569–578.
27. Hoffmann K, Firth MJ, Freitas JR, de Klerk NH, Kees UR (2005) Gene expression levels in small specimens from patients detected using oligonucleotide arrays. Molecular Biotechnology 29: 31–38.
28. Kool M, Koster J, Bunt J, Hasselt NE, Lakeman A, et al. (2008) Integrated genomics identifies five medulloblastoma subtypes with distinct genetic profiles, pathway signatures and clinicopathological features. PLoS ONE 3: e3088. 29. Rogozin IB, Makarova KS, Murvai J, Czabarka E, Wolf YI, et al. (2002)
30. Langfelder P, Horvath S (2008) WGCNA: an R package for weighted correlation network analysis. BMC Bioinformatics 9: 559.
31. Northcott PA, Korshunov A, Pfister SM, Taylor MD (2012) The clinical implications of medulloblastoma subgroups. Nat Rev Neurol 8: 340–351. 32. Herz J, Chen Y (2006) Reelin, lipoprotein receptors and synaptic plasticity.
Nature reviews Neuroscience 7: 850–859.
33. Ben-Zvi A, Yagil Z, Hagalili Y, Klein H, Lerman O, et al. (2006) Semaphorin 3A and neurotrophins: a balance between apoptosis and survival signaling in embryonic DRG neurons. Journal of Neurochemistry 96: 585–597. 34. Kimura J, Kudoh T, Miki Y, Yoshida K (2011) Identification of
dihydropyr-imidinase-related protein 4 as a novel target of the p53 tumor suppressor in the apoptotic response to DNA damage. International Journal of Cancer 128: 1524– 1531.
35. Chedotal A, Kerjan G, Moreau-Fauvarque C (2005) The brain within the tumor: new roles for axon guidance molecules in cancers. Cell Death and Differentiation 12: 1044–1056.
36. Fujita H, Katoh H, Ishikawa Y, Mori K, Negishi M (2002) Rapostlin is a novel effector of Rnd2 GTPase inducing neurite branching. Journal of Biological Chemistry 277: 45428–45434.
37. Jossin Y (2004) Neuronal migration and the role of reelin during early development of the cerebral cortex. Molecular Neurobiology 30: 225–251. 38. Hong SE, Shugart YY, Huang DT, Shahwan SA, Grant PE, et al. (2000)
Autosomal recessive lissencephaly with cerebellar hypoplasia is associated with human RELN mutations. Nature Genetics 26: 93–96.
39. Kumar K, Patro N, Patro I (2013) Impaired structural and functional development of cerebellum following gestational exposure of deltamethrin in rats: role of reelin. Cellular and Molecular Neurobiology 33: 731–746. 40. Kalani MY, Cheshier SH, Cord BJ, Bababeygy SR, Vogel H, et al. (2008)
Wnt-mediated self-renewal of neural stem/progenitor cells. Proceedings of the National Academy of Sciences of the United States of America 105: 16970– 16975.
41. Bibb LC, Holt JK, Tarttelin EE, Hodges MD, Gregory-Evans K, et al. (2001) Temporal and spatial expression patterns of the CRX transcription factor and its downstream targets. Critical differences during human and mouse eye development. Human Molecular Genetics 10: 1571–1579.
42. Muranishi Y, Sato S, Inoue T, Ueno S, Koyasu T, et al. (2010) Gene expression analysis of embryonic photoreceptor precursor cells using BAC-Crx-EGFP transgenic mouse. Biochemical and Biophysical Research Communications 392: 317–322.
43. Bai RY, Staedtke V, Lidov HG, Eberhart CG, Riggins GJ (2012) OTX2 represses myogenic and neuronal differentiation in medulloblastoma cells. Cancer Research 72: 5988–6001.
44. Rath MF, Munoz E, Ganguly S, Morin F, Shi Q, et al. (2006) Expression of the Otx2 homeobox gene in the developing mammalian brain: embryonic and adult expression in the pineal gland. Journal of Neurochemistry 97: 556–566. 45. Santagata S, Maire CL, Idbaih A, Geffers L, Correll M, et al. (2009) CRX is a
diagnostic marker of retinal and pineal lineage tumors. PLoS ONE 4: e7932. 46. Gielen GH, Gessi M, Denkhaus D, Pietsch T (2012) CRX/OTX3: A Useful
Marker in the Differential Diagnosis of Tumors of the Pineal Region and Indicator of Photoreceptor Differentiation in Medulloblastomas and Atypical Teratoid Rhabdoid Tumors. Appl Immunohistochem Mol Morphol.
47. Northcott PA, Shih DJ, Peacock J, Garzia L, Morrissy AS, et al. (2012) Subgroup-specific structural variation across 1,000 medulloblastoma genomes. Nature 488: 49–56.
48. Kristensen AS, Andersen J, Jorgensen TN, Sorensen L, Eriksen J, et al. (2011) SLC6 neurotransmitter transporters: structure, function, and regulation. Pharmacological Reviews 63: 585–640.
49. Monti B, Polazzi E, Batti L, Crochemore C, Virgili M, et al. (2007) Alpha-synuclein protects cerebellar granule neurons against 6-hydroxydopamine-induced death. Journal of Neurochemistry 103: 518–530.
50. Schneider BL, Seehus CR, Capowski EE, Aebischer P, Zhang SC, et al. (2007) Over-expression of alpha-synuclein in human neural progenitors leads to specific changes in fate and differentiation. Human Molecular Genetics 16: 651–666. 51. Nuber S, Franck T, Wolburg H, Schumann U, Casadei N, et al. (2010)
Transgenic overexpression of the alpha-synuclein interacting protein synphilin-1 leads to behavioral and neuropathological alterations in mice. Neurogenetics 11: 107–120.
52. Mori F, Piao YS, Hayashi S, Fujiwara H, Hasegawa M, et al. (2003) Alpha-synuclein accumulates in Purkinje cells in Lewy body disease but not in multiple system atrophy. Journal of Neuropathology and Experimental Neurology 62: 812–819.
53. Unland R, Kerl K, Schlosser S, Farwick N, Plagemann T, et al. (2014) Epigenetic repression of the dopamine receptor D4 in pediatric tumors of the central nervous system. Journal of Neuro-Oncology 116: 237–249.
54. Kowara R, Menard M, Brown L, Chakravarthy B (2007) Co-localization and interaction of DPYSL3 and GAP43 in primary cortical neurons. Biochemical and Biophysical Research Communications 363: 190–193.
55. Tamagnone L (2012) Emerging role of semaphorins as major regulatory signals and potential therapeutic targets in cancer. Cancer Cell 22: 145–152. 56. Kast RE, Ellingson BM, Marosi C, Halatsch ME (2013) Glioblastoma treatment
using perphenazine to block the subventricular zone’s tumor trophic functions. Journal of Neuro-Oncology.
57. Colombo E, Giannelli SG, Galli R, Tagliafico E, Foroni C, et al. (2006) Embryonic stem-derived versus somatic neural stem cells: a comparative analysis of their developmental potential and molecular phenotype. Stem Cells 24: 825– 834.
58. Reubinoff BE, Itsykson P, Turetsky T, Pera MF, Reinhartz E, et al. (2001) Neural progenitors from human embryonic stem cells. Nature Biotechnology 19: 1134–1140.
59. Basak O, Taylor V (2009) Stem cells of the adult mammalian brain and their niche. Cellular and Molecular Life Sciences 66: 1057–1072.
60. Meyer JS, Shearer RL, Capowski EE, Wright LS, Wallace KA, et al. (2009) Modeling early retinal development with human embryonic and induced pluripotent stem cells. Proceedings of the National Academy of Sciences of the United States of America 106: 16698–16703.
61. Ikeda H, Osakada F, Watanabe K, Mizuseki K, Haraguchi T, et al. (2005) Generation of Rx+/Pax6+neural retinal precursors from embryonic stem cells. Proceedings of the National Academy of Sciences of the United States of America 102: 11331–11336.