Characterization of the volatile fraction emitted by phloems of four
pinus species by solid-phase microextraction and gas
chromatography–mass spectrometry
A.M. Santos
a, T. Vasconcelos
b, E. Mateus
a, M.H. Farrall
a,
M.D.R. Gomes da Silva
c, M.R. Paiva
a,∗, M. Branco
d,∗aGUECKO/Departamento de Ciˆencias e Engenharia do Ambiente, FCT, Universidade Nova de Lisboa 2829-516 Campus de Caparica, Portugal bDepartamento de Ciˆencias Exactas e do Ambiente, Escola Superior Agr´aria de Coimbra, 3040-316 Bencanta, Coimbra, Portugal
cREQUIMTE, Departamento de Qu´ımica, FCT-UNL, 2829-516, Caparica, Portugal
dDEF/Departamento de Engenharia Florestal, Instituto Superior de Agronomia, Universidade T´ecnica de Lisboa,
Tapada da Ajuda, 1349-17 Lisboa, Portugal
Available online 23 November 2005
Abstract
Pine forests constitute some of the most important renewable resources supplying timber, paper and chemical industries, among other functions. Characterization of the volatiles emitted by differentPinusspecies has proven to be an important tool to decode the process of host tree selection by herbivore insects, some of which cause serious economic damage to pines. Variations in the relative composition of the bouquet of semiochemicals are responsible for the outcome of different biological processes, such as mate finding, egg-laying site recognition and host selection. The volatiles present in phloem samples of four pine species,P. halepensis,P. sylvestris,P. pinasterandP. pinea, were identified and characterized with the aim of finding possible host-plant attractants for native pests, such as the bark beetleTomicus piniperda. The volatile compounds emitted by phloem samples of pines were extracted by headspace solid-phase micro extraction, using a 2 cm 50/30 mm divinylbenzene/carboxen/polydimethylsiloxane table flex solid-phase microextraction fiber and its contents analyzed by high-resolution gas chromatography, using flame ionization and a non polar and chiral column phases. The components of the volatile fraction emitted by the phloem samples were identified by mass spectrometry using time-of-flight and quadrupole mass analyzers. The estimated relative composition was used to perform a discriminant analysis among pine species, by means of cluster and principal component analysis. It can be concluded that it is possible to discriminate pine species based on the monoterpenes emissions of phloem samples.
© 2005 Published by Elsevier B.V.
Keywords: Tomicusspp.;Pinusspp.; Monoterpenes; SPME; GC-FID; GC-TOF-MS
1. Introduction
Bark beetles constitute some of the economically most impor-tant insects for pine forests[1], since epidemic levels are often reached, particularly after fires and storms, killing healthy trees and causing serious damage to stands. Tomicus piniperda is an endemic species able of colonizing weakened, stressed or recently killed trees [1]. The larvae excavate galleries in the phloem of the trunks and of freshly cut logs, while adults must feed on shoots to complete sexual maturation[1–4].T. piniperda
∗Corresponding authors.
E-mail addresses:[email protected] (M.R. Paiva), [email protected] (M. Branco).
is a monogamous species which have no known pheromones to either attract mates or locate breeding sites[5]. Host selection is achieved by detection of the monoterpenes released by the trees, which act as kairomones[2–6].
Monoterpenes are a group of volatile plant secondary metabolism compounds, that act as primary defence against pathogenic agents and are thought to be a key tool to decode insect–host interactions [6–15]. Several authors have referred that both biosynthesis and biogenesis of mono- and sesquiter-penes are genetic and species dependent [12,16]. The differ-ences found in the emission patterns of the genus Pinus are reported to be mainly quantitative, allowing for interspecific dis-crimination [9–12,15]. The importance of specifying the type of tissue sample used in the analysis has also been pointed out, since variations in the relative amount of the constituents,
as well as the enantiomeric composition of the monoter-penes were observed, both between and within conifer species [9,12,17].
Most studies on conifer monoterpene emissions used sam-ples from foliage [8,9,11,16,18–22], cortex tissue[12], seeds [10], cones[11], or bark volatiles emissions after insect ovipo-sition induction [14,15]. In most of these studies, simul-taneous destillation-extraction (SDE) methods were used to isolate the volatile compounds from the complex matrices [8,9,13,20,23,24]. However, the presence of the extraction sol-vent that frequently coelutes, during the chromatographic run, with less retained peaks, is an important drawback of this tech-nique[22]. Headspace solid-phase microextraction (HS-SPME) has the isolation capability of SDE while allowing for the iso-lation to be achieved without solvent intervention. Moreover, the wide variety of fibers that can be used, depending on the functionalities of the target organic compounds, made it a sim-ple, quick, sensitive and versatile method of sample prepara-tion, suitable for routine analysis of monoterpenes in tree tissue [10–12,14–16,22,23].
Within the genusPinus, phylogenetic relationships have been established mostly based on pine morphological characteristics, such as needles and cones, as well as on the species geographic distribution [25], while DNA markers, proteins and terpenes have been used to corroborate the taxonomic distinctions found among species[26–28]. Further studies showed that it is possible to differentiatePinusgenus using the volatile terpene composi-tion of pine needles[8–11,13,16]and similar results were found for the genusTsuga[29]. In this study, we investigated whether volatile terpene emissions from the phloem of pine trunks, might also be used as a distinguishing character among coniferous species. Therefore, we characterized the volatile fraction emit-ted by trunk phloem sections of four pine species,P. pinaster,
P. sylvestris,P. pineaandP. halepensis, by means of headspace
solid-phase microextraction (SPME), gas chromatography (GC) and mass spectrometry (GC–MS), as a potential method to be used for the determination of pine species.
Hierarchical cluster analysis was used to study the chemical variability of the fourPinusspecies analyzed. Principal compo-nent (PC) analysis was applied to study the nature and magnitude of the differentiation among species.
2. Materials and methods
2.1. Standards
All monoterpene standards used were purchased from Aldrich (Deisenhofen, Germany), Fluka (Neu-Ulm, Germany) and Kasei (Tokyo, Japan).
2.2. Research materials
Phloems were sampled fromP. halepensis,P. sylvestris,P.
pinaster and P. pinea, in October 2004, from stands located
in central Portugal (Table 1). After collection samples were stored immediately in liquid nitrogen until the analysis were performed.
Table 1
Sampling locations, in Portugal, October 2004
Species Sampling site Latitude Longitude
P. pinaster Serra da Lous˜a 40◦08′N 8◦10′W
P. sylvestris Serra da Lous˜a 40◦08′N 8◦10′W
P. pinea Alc´acer do Sal 38◦23′N 8◦31′W
P. halepensis Serra da Ota 39◦07′N 8◦59′W
2.3. Sample preparation
All phloem samples were weighted, cut and transferred to a 7.0 ml sealed vial (Supelco, Bellefonte, USA). Their volatile fraction was extracted by solid-phase microextrac-tion using a 100m polydimethylsiloxane (PDMS) coated fiber for enantiomeric separation, and a 50/30m divinyl-benzene/Carboxen/polydimethylsiloxane (DVB/CAR/PDMS) coated fiber (both from Supelco, Belfonte, USA) for non-enantiomeric separation. The headspace extraction was per-formed at room temperature for 60 min and the trapped com-pounds desorbed at 250◦C in the injection port, for 60 s. Before the analysis, the fibers were conditioned according to the man-ufacturer standard procedures.
2.4. Analysis of monoterpenes
2.4.1. GC-FID analysis
The analysis of the volatile compounds was performed by gas chromatography, using a HP 5890A gas chromatograph (Hewlett Packard, USA) equipped with flame ionization detection (GC-FID). The separation was achieved on a DB-5 capillary column with 30 m×0.32 mm I.D., 1.0m thickness (J &W Scientific, Folsom, USA) after split injection (1:20), using hydrogen as carrier gas, at flow rate of 1.7 ml/min.
Oven temperature was initially held at 50◦C for 1 min and increased up to 125◦C, at a rate of 4◦C/min. From 125◦C, it was further increased up to 250◦C at 6◦C/min rate where it was
held for 5 min. The final temperature of 295◦C was reached at
a rate of 10◦C/min. The flame ionization detector temperature
was set at 300◦C.
2.4.2. Enantiomeric analysis
The separation of enantiomeric monoterpenes was per-formed on a taylor made fused silica capillary column with 30 m×0.25 mm I.D., coated with 0.25m film of 15% heptakis (2,3-di-O-methyl-6-O-terc -butyldimethylsilyl)--cyclodextrin in SE52 (DiMe). The column was placed on a GC-Trace 2000 (Thermo Unicam, USA) equipped with flame ionization detection. Hydrogen was used as carrier gas, with a flow rate of 1.0 ml/min. The oven temperature was initially set at 68◦C and kept isothermal for 15 min.
After-wards, it was increased at a rate of 2◦C/min until 125◦C,
followed by a rate of 5◦C/min to 200◦C where it was held
for 1 min. The flame ionization detector temperature was set at 250◦C. All compounds were detected by standard
2.5. Identification of the monoterpenes
2.5.1. GC-TOF-MS analysis
The GC–MS analysis were carried out on an Agilent 6890N gas chromatograph, coupled to a mass spectrometer Micromass GCT (Manchester, UK) equipped with a time-of-flight (TOF) mass analyzer. Separation was performed on a 30 m×0.25 mm I.D., 0.25m thickness fused silica ZB-5ms column (Phe-nomenex, Torrance, USA). Sample injection was performed with a split ratio of 1:20. Helium was used as carrier gas with a flow rate of 0.8 ml/min.
The mass spectrometer operated in electron impact mode (70 eV) with a mass range set from 35 to 350m/z. The interface and source temperatures were set at 250◦C and gas
chromatog-raphy conditions were as given.
2.6. Data analysis
2.6.1. Peak identification
Individual peaks of compounds were detected by compari-son with retention times of standard pure solutions under similar operating conditions. The compounds were identified by com-paring the mass spectra obtained for the standards and by Wiley 7th mass spectral reference library.
2.6.2. Statistical analysis
Relative area percentage of the monoterpenes present in the volatile fraction was used for data analysis. Data processing was performed using SPSS (V.12 for Windows) statistical package.
Pine species homogeneity was analyzed by hierarchical clus-ter analysis using Ward’s method and square Euclidean dis-tances, based on the content of the monoterpenes emitted by phloem samples, which were variables impossible to normal-ize. Principal component analysis was used to determine the key enantiomers that best explain the species sets. Enantiomers rela-tive percentages were transformed (cubic root) and standardized to obtain normal distributed variables.
3. Results and discussion
The chromatogram profiles for non-chiral and chiral analy-sis of the volatile fractions present in the phloem samples are exemplified, respectively, inFigs. 1 and 2.
We identified 11 monoterpenes (Figs. 1 and 2;Tables 2 and 3), that have been previously reported to play a role in the pro-cess of host tree selection by conifers phytophagous insects [1,2,4–11,15,17–20]. Traces of non-terpenoid volatiles, such as 4-methyl-hex-4-en-3-one, oct-1-en-3-ol and benzaldehyde were also identified, although not used for data treatment. The volatile compositions estimated for the species sampled are shown on Table 2. Fig. 3 represents the dendrogram obtained through a hierarchical cluster analysis, using Ward’s method.P. pinea
appears as the most homogeneous group, whileP. halepensis
shows larger heterogeneity, with two groups of samples clearly identifiable. P. sylvestris and P. pinasterare separated in the dendogram at species level. Nevertheless, these two species are grouped together in one of the three main clusters obtained.
Fig. 1. Typical chromatogram of the volatile fraction emitted by phloem samples ofP. halepensisdetected by GC-FID using a DB5 column and SPME extraction. Peak identification: 1,␣-thujene; 2,␣-pinene; 3, fenchene; 4, camphene; 5, sabinene; 6,-pinene; 7, myrcene; 8,␦-3-carene; 9,␣-terpinene +p-cymene; 10, limonene.
Fig. 2. GC profile of chiral monoterpenes of the phloem volatile fraction of
Table 2
Monoterpene composition of thePinusspecies studied, using non-enantiomeric separation, calculated based on relative area percentages
Monoterpenes P. pinaster(N= 2) P. sylvestris(N= 5) P. pinea(N= 5) P. halepensis(N= 7) Relative area mean Standard deviation (%) Relative area mean Standard deviation (%) Relative area mean Standard deviation (%) Relative area mean Standard deviation (%)
␣-Thujene 0 0 0 0 0 2.229 1.725
␣-Pinene 51.574 8.065 50.968 14.635 8.101 6.8613 33.577 18.045
Camphene 0.965 1.364 0.000 0.000 0.000 0.000 1.350 1.508
Sabinene 0.000 0.000 0.000 0.000 0.357 0.958 3.600 2.549
-Pinene 30.126 4.208 38.503 11.689 7.565 5.877 25.419 20.189
Myrcene 3.483 1.084 0.224 0.601 9.973 13.834 7.091 11.099
␦-3-Carene 8.625 12.198 1.020 1.004 3.364 3.216 6.338 9.468
␣-Terpinene
p-Cymene 1.812 0.142 4.044 1.957 2.017 3.234 18.326 21.015
Limonene 3.415 2.231 5.240 4.852 68.623 27.852 2.071 2.9725
Table 3
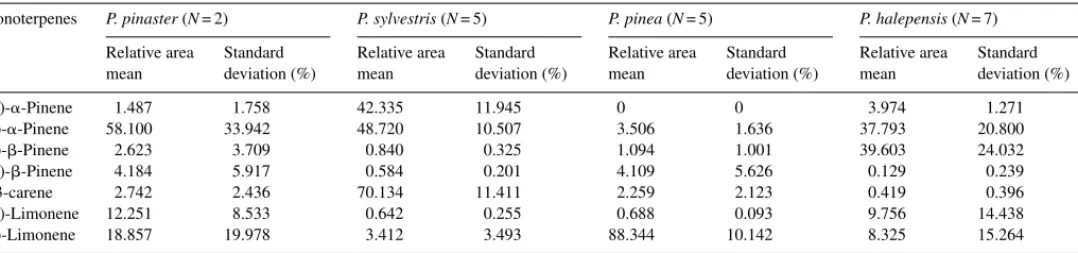
Enantiomeric monoterpene composition of thePinusspecies studied, using enantiomeric separation, calculated based on relative area percentages Monoterpenes P. pinaster(N= 2) P. sylvestris(N= 5) P. pinea(N= 5) P. halepensis(N= 7)
Relative area mean Standard deviation (%) Relative area mean Standard deviation (%) Relative area mean Standard deviation (%) Relative area mean Standard deviation (%)
(−)-␣-Pinene 1.487 1.758 42.335 11.945 0 0 3.974 1.271
(+)-␣-Pinene 58.100 33.942 48.720 10.507 3.506 1.636 37.793 20.800
(+)--Pinene 2.623 3.709 0.840 0.325 1.094 1.001 39.603 24.032
(−)--Pinene 4.184 5.917 0.584 0.201 4.109 5.626 0.129 0.239
␦-3-carene 2.742 2.436 70.134 11.411 2.259 2.123 0.419 0.396
(−)-Limonene 12.251 8.533 0.642 0.255 0.688 0.093 9.756 14.438
(+)-Limonene 18.857 19.978 3.412 3.493 88.344 10.142 8.325 15.264
Fig. 3. Dendogram using Ward’s method for hierarchical cluster analysis. Pine species were grouped using non-chiral volatile concentrations only.
As reported by Sjodin et al.[8]and by Gomes da Silva et al. [16], it is possible to discriminatePinusspecies by analyzing tissues, other than phloem, of trees of this genus, based only on the quantitative enantiomeric composition of the samples. PC analysis was performed using only the results obtained with the chiral column, since it was not possible to normalize the monoterpene data.
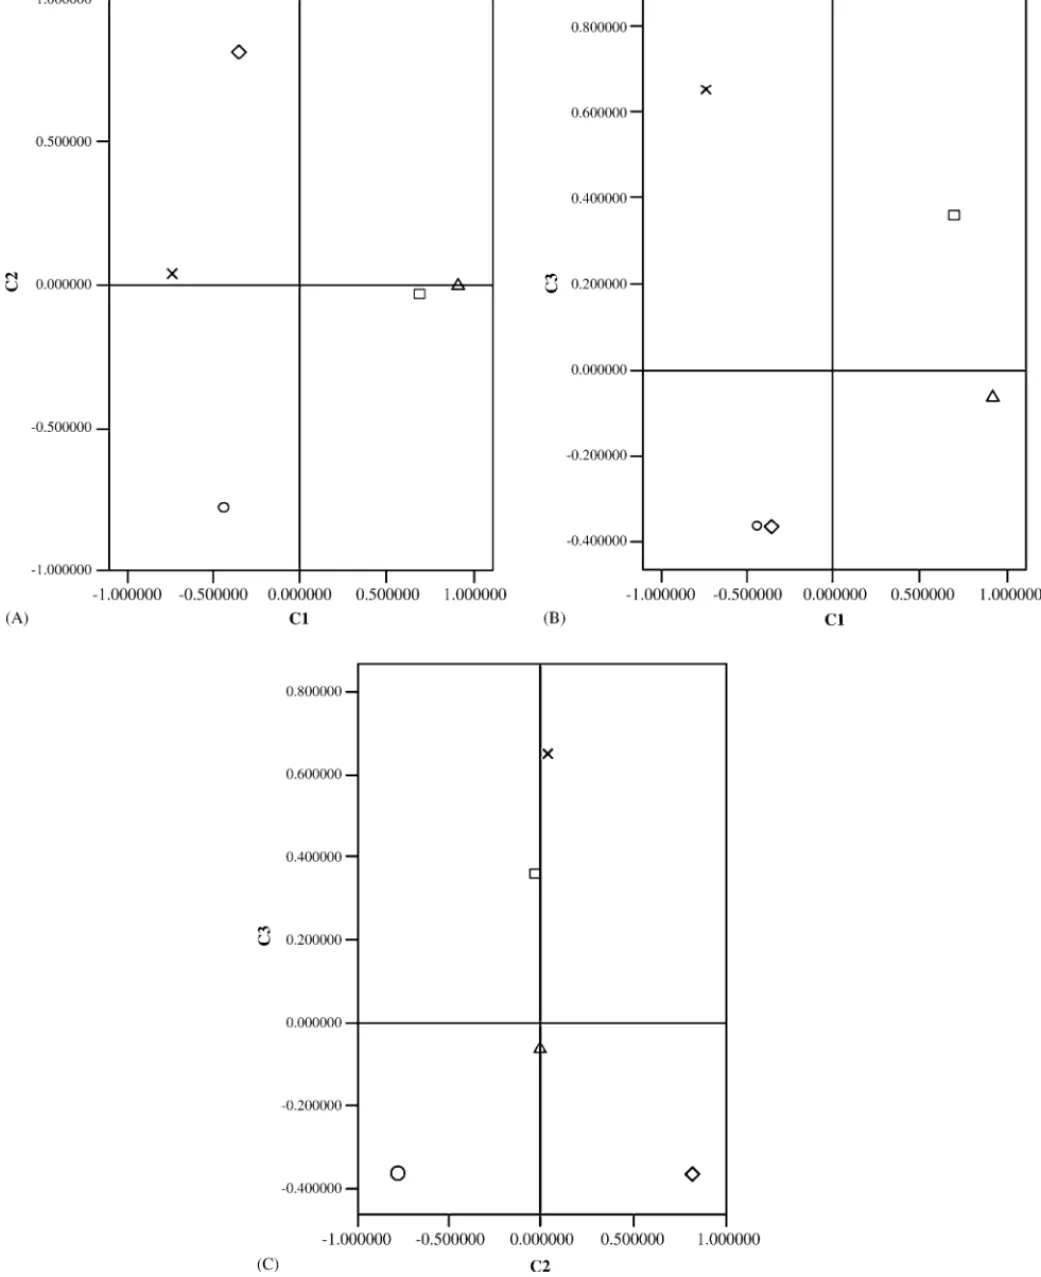
Since the enantiomers usually have specific biological activi-ties, each one has to be considered as two separated constituents. For this reason, principal component analysis was performed using the enantiomeric compositions, given as total area per-centages, for the monoterpenic compounds identified (Table 3). The three principal components explained 85.78% of the total variance with the first factor scoring 43.8% (Table 4).
Table 4
Percentage of the total variance explained by PC analysis, referring to the enan-tiomeric monoterpene composition of thePinusspecies studied
Components Initial Eigenvalues
% of Variance % Cumulative
1 43.837 43.837
2 25.491 69.327
3 16.430 85.757
4 12.811 98.569
5 1.431 100.000
The first component is explained by the enantiomers (+)-limonene and (−)--pinene versus (+)-␣-pinene, while the sec-ond component is defined by (+)--pinene versus (−)-␣-pinene. Finally, the third component is characterized by (+)-␣-pinene (Fig. 4). PC analysis results, illustrated by Figs. 4 and 5, show that the discrimination of P. pinea is strongly influ-enced by the contents of (+)-limonene and (−)--pinene. (+)--pinene and (−)-␣-pinene contents discriminate between P.
halepensisandP. sylvestris, respectively. Finally,P. pinasteris
discriminated based on the contents of (+)-␣-pinene. Unpub-lished results (Vasconcelos, in preparation) showed that Tomi-cus spp. in Portugal preferably attack P. pinaster in com-parison to other native and exotic pine species. Thus, vari-ations encountered among Pinus species, regarding phloem monoterpene emissions, are of significance considering the selection and colonization processes for insects such as bark beetles.
These results are in accordance with Shaw’s morphologi-cal classification of the genusPinuswhich separatesP. pinea
(Subsection Parapinaster), from the other three species (Sub-section Pinaster). This last sub(Sub-section is further separated into the groups of Laraciones (P. sylvestris) and Insignes (P. pinaster
andP. halepensis).
Gomes da Silva et al. [16], using needle samples, dis-criminated 10 pine species based on the enantiomeric con-tents: (−)--pinene and (+)-limonene for P. pinaster; (−)-limonene for P. pinea;␣-pinene and (+)--pinene for both P.
sylvestris and P. halepensis. Our results, using phloem
sam-ples, revealed a different pattern. This apparent contradiction is explained by authors like Sjodin et al. [8], Pureswaran et al. [9] and Harfouche et al. [17]. The first author empha-sized the importance of specifying the plant tissue sampled, since volatile analysis strongly depend on this factor. All authors report large variations in the relative amounts of the volatile components, between and within trees, of the same species.
The distinction between volatile emissions from different tree organs or tissues provides an important cue to decode the mechanism of host selection taking place by different species, or by different stages of the same species, feeding on different parts of the plant. This is the case of Tomi-cus sp. which feeds on pine needles during a period of the adult stage, before attacking the trunks for breeding. There-fore, the distinction between volatile emissions from different tree organs provides an important cue to decode the mecha-nism of host selection taking place in different phases of its life cycle.
4. Conclusions
Our results indicate that it is possible to discriminate pine species based on monoterpene emissions from phloem samples, using HS-SPME extraction followed by GC and GC–MS anal-ysis.
P. pineaappears to be the most cohesive group of the four
species studied, a conclusion which can be derived both from the cluster and PC analysis. The enantiomers emission pattern was
different from those obtained for other tissues of Pinustrees. We were able to discriminateP. pineabased on the emissions of both (+)-limonene and (−)--pinene, andP. pinasterbased on (+)-␣-pinene emissions. Finally, the distinction betweenP.
sylvestrisandP. halepensiswas made based on the contents of
(+)--pinene and (−)-␣-pinene.
The fact that the enantiomeric discrimination achieved reflects Shaw’s morphological classification of the genusPinus
is an encouraging result leading to further research.
Acknowledgements
This work was financed by projects POCTI/AGG/47275/02 and EU-PROMOTH (QLRT-2001-00852). The authors are grateful to Professor Dr. Susana Barreiros research team, DQ, FCT, New University of Lisbon, for logistic support with chiral analysis.
References
[1] T.D. Paine, K.F. Raffa, T.C. Harrington, Annu. Rev. Entomol. 42 (1997) 179.
[2] J.A. Byers, J. Lofqvist, F. Schylter, G. Bergstrom, Naturwissenschaften 72 (1985) 324.
[3] A.E. Santoro, M.J. Lombardero, M.P.J. Ayres, J. Forest Ecol. Manag. 144 (2001) 245.
[4] A.A. Kennedy, D.G. McCullough, Environ. Entomol. 31 (2002) 261. [5] I. Amezaga, C. Garbisu, Environ. Entomol. 29 (2000) 1011.
[6] S. Trapp, R. Croteau, Annu. Rev. Plant Physiol. Plant Mol. Biol. 52 (2001) 689.
[7] T. Norin, Pure Appl. Chem. 11 (1996) 2043.
[8] K. Sjodin, M. Persson, A. Borg-Karlson, T. Norin, Phytochemistry 41 (1996) 439.
[9] D.S. Pureswaram, R. Gries, J.H. Borden, Biochem. Syst. Ecol. 32 (2004) 1109.
[10] P. Tammela, M. Nygren, I. Laakso, A. Hopia, H. Vuorela, R. Hiltunen, Flavour Fragr. J. 18 (2003) 290.
[11] L. Dormont, A. Roquest, C. Malosse, Phytochemistry 49 (1998) 1269.
[12] E. Silvestrini, M. Michelozzi, T. Skroppa, E. Brancaleoni, P. Ciccioli, J. Chromatogr. A 1034 (2004) 183.
[13] R. Slimestad, Biochem. Syst. Ecol. 31 (2003) 1247.
[14] R. Mumm, K. Scharank, R. Wegener, S. Shulz, M. Hilker, J. Chem. Ecol. 29 (2003) 1235.
[15] R. Mumm, T. Tiemann, S. Shulz, M. Hilker, Phytochemistry 65 (2004) 3221.
[16] M.D.R. Gomes da Silva, E.P. Mateus, J. Munh´a, A. Drazyk, M.H. Far-rall, M.R. Paiva, H.J. Chaves das Neves, A. Monsandl, Chromatographia 53 (2001) 412.
[17] A. Harfouche, W. Boujada, M. Allam, O. Belhou, A. Merazga, Silvae Genet. 52 (2003) 5.
[18] G.K. Girisha, L.M. Condron, P.W. Clinton, M.R. Davis, Forest Ecol. Manag. 179 (2003) 169.
[19] W. Oleszec, A. Stochmal, P. Karolewski, A. Simonet, F.A. Macias, A. Tava, Biochem. Syst. Ecol. 30 (2002) 1011.
[20] G. Vazquez, G. Antorrena, J. Gonz´alez, S. Freire, Bioresourse Technol. 51 (1995) 83.
[21] G.R. Shaw, Genus Pinus, Riverside Press, Cambridge, 1914.
[22] J.G. Lee, C.G. Lee, J.J. Kwag, A.J. Buglass, G.H. Lee, J. Chromatogr. A 1089 (2005) 227.
[23] A.M. Manninen, S. Tarharnen, M. Vuorinen, P. Kainulainen, J. Chem. Ecol. 28 (2002) 211.
[25] R.D. Burdon, An Introduction to Pines of Silvicultural Importance, CABI Publishing, Wallingford, Oxon, UK, 2002, p. x–xxi.
[26] P. Baradat, A. Marpeau-Bezard, Le pin maritime Pinus pinaster Ait: biologie et g´en´etique des terp`enes pour la connaissance et l’am´elioration de l’esp`ece, Ph.D. Thesis, University of Bordeaux I, 1988.
[27] N. Bahrman, M. Zivy, C. Damerval, P. Baradat, Theor. Appl. Genet. 88 (1994) 407.
[28] C. Burban, R. Petit, Mol. Ecol. 12 (2003) 1487.