FUNDAÇÃO GETÚLIO VARGAS
ESCOLA DE PÓS-GRADUAÇÃO EM ECONOMIA
Diana Goldemberg
Essays on the Economics
of Education
Diana Goldemberg
Essays on the Economics
of Education
A dissertation submitted in partial fulfillment of the requirements for the degree of Doctor of Philosophy at Escola de Pós-Graduação em Economia da Fundação Getúlio Vargas
Advisor: Francisco Junqueira Moreira da Costa
Rio de Janeiro
2019
Dados Internacionais de Catalogação na Publicação (CIP) Ficha catalográfica elaborada pelo Sistema de Bibliotecas/FGV
Goldemberg, Diana
Essays on the economics of education / Diana Goldemberg. – 2019. 116 f.
Tese (doutorado) - Fundação Getulio Vargas, Escola de Pós-Graduação em Economia. Orientador: Francisco Junqueira Moreira da Costa.
Inclui bibliografia.
1. Educação - Fatores climáticos - Brasil. 2. Evasão escolar. 3. Educação – Aspectos econômicos - Brasil. I. Costa, Francisco Junqueira Moreira da. II. Fundação Getulio Vargas. Escola de Pós-Graduação em Economia. III. Título. CDD – 371.2913
Acknowledgements
First and foremost, I would like to express my gratitude and appreciation to my mother Bernadette, my sister Flora and my partner Raphael for all their love and support. My father Clovis has not lived to see me graduate, but undoubtedly nourished my interest in academe.
I am indebted to my advisor Francisco Junqueira Moreira da Costa for his research guidance and insightful comments. I would also like to thank my professors and colleagues at Harvard University and the generous support of Fundação Lemann, Fundação Estudar, Claudio Haddad Family Fellowship and John F. Kennedy Fellowship that enabled me to pursue part of my graduate studies there. This study was partly funded by the Coordenação de Aperfeiçoamento de Pessoal de Nível Superior (CAPES).
Many other individuals provided support specific to one or more of my dissertation chapters. My understanding of how my work fit within the economic and educational institutions in Brazil benefitted greatly from discussions with Veveu Arruda and Igor Lima. I thank Marcio Costa, Eduardo Ribeiro and Natalino Pontual at the Rio de Janeiro Department of Education for helping me access student data used in Chapter 2. I thank Trajano Dantas de Andrade and George Gomes Ferreira at the Ceará Department of Education for providing access to administrative data and explaining in detail the peer mentoring program from Chapter 3.
Table of Contents
Acknowledgements ... iv
Abstract ... vii
Resumo ... viii
Too hot to learn? Evidence from the Brazilian Northeast ... 1
1. Introduction ... 2
2. Context ... 4
3. Data ... 5
3.1. Weather Data ... 5
3.2. Education data ... 7
4. Empirical specification and results ... 9
4.1. Mean impacts ... 11
4.2. Heterogeneity by school type ... 12
4.3. Robustness checks ... 14
4.4. Water cisterns in schools ... 15
5. Conclusion ... 15
References ... 17
Figures ... 20
Tables ... 28
Appendix ... 33
The consequences of chronic exposure to community violence for children’s academic progression in Rio de Janeiro, Brazil ... 38
1. Introduction ... 39
2. Related literature ... 42
2.1. Acute and chronic exposure to violence ... 42
2.2. Mechanisms ... 44
2.3. On-time grade progression ... 45
3. Context and Data ... 46
3.1. Violence in Rio de Janeiro: context ... 46
3.3. Education in Rio de Janeiro: context ... 49
3.4. Education Data ... 50
4. Empirical specification and results ... 52
4.1. Year-by-year impacts... 52
4.2. Cumulative impacts ... 54
5. Discussion and Conclusion ... 57
5.1. Limitations ... 58 5.2. Conclusion ... 59 References ... 60 Figures ... 65 Tables ... 68 Appendix ... 71
Peer mentoring for principals: a systemic approach to school turnaround ... 72
1. Introduction ... 73
2. Context and data ... 76
2.1. Education in Ceará ... 76
2.2. Peer-mentoring initiative ... 77
2.3. Data ... 79
3. Empirical strategy ... 81
3.1. Program participation effects ... 82
3.2. Identification Assumptions ... 83
4. Results ... 83
4.1. Program participation effects ... 84
4.2. Robustness check ... 86 5. Mechanisms ... 86 5.1. Improvement drivers... 89 6. Conclusion ... 91 References ... 92 Figures ... 95 Tables ... 98
Abstract
Education is a powerful tool to improve lives and enhance the development prospects of nations. While primary and secondary school enrollment have increased considerably over the past decades in Brazil, completion rates and learning have remained low. This dissertation consists of three empirical essays, the first two focused on factors that may be holding back completion rates and the last one tackling the unsatisfactory learning levels.
The first essay analyses the impact of cumulative heat exposure on educational outcomes in the Brazilian Northeast. Using data from over 78 thousand schools, I find that a one-degree Celsius increase in the annual mean maximum temperature during the school year reduces grade progression by 0.35 percentage points and increases dropout rates by 0.26 percentage points. Results are consistent with established links between temperature and cognitive performance and have important implications for evaluating the welfare-burden of climate change.
The second essay, written jointly with Emily Hanno, examines the consequences of chronic exposure to community violence for children’s academic progression in Rio de Janeiro, relying on longitudinal data for five cohorts of children attending municipal schools in the city. We estimate that a single year of exposure to high violence during the first four years of elementary school leads to a 6.9 percentage points reduction in the probability of reaching fifth grade on time, with effects being more than twice as large for children facing four years of high violence.
The third essay evaluates a peer mentoring program for school principals implemented in Ceará in 2008. Exploiting a regression discontinuity design for the school rank defining program participation, I find that low performing schools participating in the program subsequently achieve education quality indexes that are 0.18 standard deviations higher. Similarity in number of enrolled students and proximity between paired schools are associated with stronger outcomes for low performing participants, indicating that matching of mentee-mentors deserves careful consideration. These findings provide an example of how school turnaround may be achieved systemically without leadership replacement.
Resumo
Educação é um poderoso instrumento para a mobilidade social de indivíduos e o desenvolvimento de nações. No Brasil, apesar de melhoras consideráveis das taxas de matrícula na educação primária e secundária, as taxas de conclusão e de aprendizado continuam baixas. Esta tese de doutorado consiste em três estudos empíricos, os dois primeiros focados em possíveis entraves às taxas de conclusão, e o último abordando os níveis insatisfatórios de aprendizado.
O primeiro estudo analisa o impacto cumulativo de exposição ao calor nos resultados educacionais no Nordeste. Usando dados de mais de 78 mil escolas, encontro que um aumento de um grau Celsius na temperatura máxima média anual durante o ano letivo reduz a progressão escolar em 0,35 pontos percentuais e aumenta a taxas de abandono em 0,26 pontos percentuais. Esses resultados são consistentes com vínculos estabelecidos entre temperatura e desempenho cognitivo e têm implicações importantes para avaliar o impacto social das mudanças climáticas.
O segundo estudo, escrito conjuntamente com Emily Hanno, examina as consequências da exposição crônica à violência urbana para a progressão acadêmica de crianças no Rio de Janeiro, baseando-se em dados longitudinais para cinco coortes de alunos de escolas municipais. Estimamos que um único ano de exposição à alta violência durante os anos iniciais do ensino fundamental leva a uma redução de 6,9 pontos percentuais na probabilidade de atingir o quinto ano no tempo ideal, sendo os efeitos duas vezes maiores para crianças expostas por quatro anos à alta violência.
O terceiro estudo avalia um programa de parceria entre diretores de escolas, implementado no Ceará em 2008. Exploro uma descontinuidade na classificação escolar que define a participação no programa, e estimo que as escolas de baixo desempenho que participam do programa melhoram em 0,18 desviões padrões seus índices de qualidade de educação. A similaridade no número de alunos e a proximidade entre as escolas pareadas estão associadas a melhores resultados, indicando que a atribuição de mentorados e mentores merece consideração cuidadosa. Essas descobertas fornecem um exemplo de como a melhora de escolas com baixo desempenho pode ser alcançada sistemicamente sem a substituição de diretores.
Too hot to learn?
Evidence from the Brazilian Northeast
Diana Goldemberg
FGV EPGE
January 16, 2019
Abstract
Using data from over 78 thousand schools in the Brazilian Northeast between 2007 and 2016, this study analyzes the impact of cumulative heat exposure on educational outcomes. Hotter school days during the academic year reduces grade progression, with extreme heat being particularly detrimental. In our preferred specification – which includes spatial, temporal and school-grade fixed effects –, a one-degree Celsius increase in the annual mean maximum temperature during the school year reduces grade progression by 0.35 percentage points (0.43%) and increases dropout rates by 0.26 percentage points (3.86%). Results are consistent with established links between temperature and cognitive performance and have important implications for evaluating the welfare-burden of climate change in developing countries.
1.
Introduction
Despite much recent progress in primary education enrollment, which reached 91% worldwide, completion rates still lag far behind in developing countries. In Latin America, only 48% of those aged 20-24 have completed secondary education, due to high dropout and repetition rates1. Given the importance of human capital accumulation for economic growth (Romer, 1986; Barro, 1991; Card, 2001) and concerns that climate change will disproportionally affect least developed countries, we study the links between temperature and educational attainment.
Weather shocks are known to impact schooling decisions in developing countries, especially in rural areas, through agricultural income and health channels (Jensen, 2000; Maccini and Yang, 2009; Björkman-Nyqvist, 2013; Groppo and Kraehnert, 2017; Shah and Steinberg, 2017). Temperature is also known to have a direct negative effect on cognition: a meta-analysis from laboratory studies estimates that human cognition is the highest at 21.75°C (71.5°F) with a 9% decrement of performance when temperature is 30°C (86.1°F) (Seppanen, Fisk, and Lei, 2006).
Using data from over 78 thousand schools and 114 million K-12 enrollments in Northeast Brazil from 2007-2016, we analyze the impact of cumulative heat exposure on educational outcomes. This region is the largest pocket of poverty in Brazil, characterized by a hot and semi-arid climate. We find strong evidence for negative impacts of heat on schooling: a one-degree Celsius increase in the annual mean of maximum temperature during school days reduces grade progression by 0.35 percentage points (0.43%) and increases dropouts by 0.26 percentage points
1 Worldwide primary school enrollment and Latin American secondary education completion figures from UNICEF
(3.86%). We cannot untangle the mechanisms through which heat is affecting academic progress, with both income and cognition effects being plausible components. A suggestive evidence for cognition effects is that our estimates for urban areas are significant and of similar magnitude to the estimates for rural areas, despite a higher sensitivity to weather income effects in rural areas through agriculture. Those results are also interpreted as estimated net effects, including direct effects on children and indirect effects through teachers and principals. Using estimators by temperature bins and considering the Intergovernmental Panel on Climate Change predicted 2-degree Celsius warming by 2050 (IPCC, 2014), this would mean a 0.67 percentage points decrease in grade promotion and a 0.34 increase in dropouts.
We build on the bourgeoning literature on the impacts of weather and climate on human-capital accumulation. Prior work has focused on standardized assessments, that is, the intensive margins of education and fall into two categories. They analyze either the contemporaneous effects of high-temperatures on performance, or the effects of long-run exposure to heat on learning. In the first group, estimates range from a decline of 1.3% to 2.9% standard deviations in high-stakes exams’ performance per a one-degree Celsius temperature increase, respectively in New York high schools (Park, 2018)2 and in China’s college entrance exams (Graff Zivin et al., 2018)3. Estimated effects on low-stakes and voluntary survey assessments fall within the same rage in the U.S. (Graff Zivin et al., 2017) and in India (Garg et al., 2017). The second strand, concerned with the effects
2 Reports an approximately linear decline of -0.2 percentiles per °F above 70°F (22°C), equivalent to a performance
reduction of 0.14 standard deviations for an exam day at 90°F, using exam data from 1 million public NY high school students from 1999-2011.
3 Reports that a one-standard-deviation increase in temperature (3.29°C) decreases the total test score by 1.12%
of long-run exposure to heat, is closest in spirit to this analysis. Goodman et al. (2018) use data from 10 million U.S. high school students and find that a 1°F (0.56°C) hotter school year prior to the exam lowers PSAT scores by 0.2% standard deviations4, with access to air conditioning completely offsetting this effect. We are similarly interested in the effects of long-run exposure to heat but focus on whether students remain enrolled and progress through K-12, offering insights on how weather directly affects the extensive margins of education, a salient and first order issue in developing countries.
The rest of the paper unfolds as follows. Section 2 provides contextual information on Northeast Brazil. Section 3 details data sources and methods. Section 4 presents this study’s empirical strategy and its results, including a series of robustness checks. Section 5 concludes.
2.
Context
Brazil is divided into five administrative regions, of which the Northeast (Nordeste) is the poorest. Northeast Brazil encompasses 18% of the country’s land area and about 28% of the population, including 15 million primary and secondary school students5. In 2017, the mean per capita income in the Northeast was 64% of the national average and its adult illiteracy rate, at 14.8%, was more than twice the Brazilian mean6.
4 Regression includes student-fixed effects, thus concerns only students from classes of 2001-2014 who took the PSAT
exam multiple times. The effect size is relative to a school year with an average of 60°F (15.6°C).
5 According to Brazil’s 2010 census, from the Brazilian Institute of Geography and Statistics (Instituto Brasileiro
de Geografia e Estatística, IBGE).
6 Brazil’s average monthly household per capita income (Rendimento nominal mensal domiciliar per capita, RDPC)
in 2017 was R$1,268 (~US$316) and R$806 in the Northeast region (~US$201), the lowest of the five regions. Adult illiteracy applies to Brazilians aged 15 and above. Data from IBGE household survey (Pesquisa Nacional por Amostra
Grade retention and dropout rates have recurrently been highest in the Northeast (versus the national average) at each grade level, particularly in rural areas7. However, current preschool enrollment rates are relatively high in the Northeast (94.1% for children aged 4 and 5, versus the national figure of 90.2%8), and primary school enrollment is close to universal. This suggests that ensuring regular grade advancement is a binding constraint to human capital accumulation in the Northeast.
Finally, the Northeast is the warmest region in Brazil, and one that experiences recurring draughts. When droughts hit, thousands of agricultural workers abandon their homes for the cities in search of work. Draughts may also affect human capital investment — with more students dropping out — helping to perpetuate economic deprivation (Shah and Steinberg, 2017).
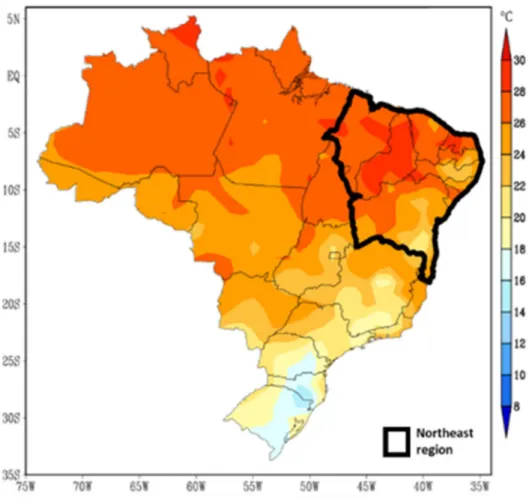
[Figure 1 – Brazil mean temperature]
3.
Data
Our analysis examines grade advancement in all primary and secondary schools in Brazil’s Northeast region in relation to temperatures at the county level during the school year. We first describe each of the data sources used.
3.1. Weather Data
7 See Figures A.1, A.2, A.3 for a comparison of grade promotion, grade retention and dropout rates in the Northeast
and national averages in recent years. See Gomes-Neto and Hanushek (1994) for early statistics and an exploration of the causes and consequences of high retention rates in the Brazilian Northeast.
We construct historical information on temperature by county using the ERA-Interim dataset produced by the European Centre for Medium-Range Weather Forecasts (ECMWF, Dee et al. 2011). This is a simulation of past worldwide weather conditions from 1979 onwards, based on the application of a four-dimensional variational analysis using satellite radiance data from observations every 12 h at a raw grid spacing of 0.75°, further interpolated for a 0.125° or 14 kilometer resolution. The dataset provides simulated maximum temperature at three-hourly intervals, and we calculate daily maximum temperature by taking the maximum of all eight intervals in a day for the 2007-2017 period. We performed a standard bias-adjustment9 procedure based on observational data, as proposed by Jones et al. (2017).
Following Goodman et al. (2018), we focus on daily maximum temperatures instead of mean daily temperatures, because schooling occurs during the daytime, when maximum temperatures usually are recorded. We allocate this information across counties by assigning the weather information of the pixel closest to the administrative headquarters coordinates of each county, according to the Brazilian Institute of Geography and Statistics (Instituto Brasileiro de Geografia e Estatística, IBGE)10.
We construct two county-by-year measures of cumulative heat exposure: the average daily maximum temperature during school days and the share of school days with maximum temperature within various temperature bins (below 27°C, 27-31°C, 31-35°C, 35-39°C and above 39°C). The distribution of the first measure is presented in Figure 2, a box plot of the mean of the
9 Bias correction consisted on a lump-sum adjustment per month (unique value for the whole dataset), to match
ERA-Interim monthly means to the National Meteorological Institute (Instituto Nacional de Metereologia, INMET) monthly means, when averaging the 95 pixels corresponding to all INMET’s weather stations in the Brazilian Northeast.
daily maximum temperature by county-year, weighted by number of students. The boxes include the counties in the 25th to 74th percentiles, and the horizontal line in each box represents the median county-year. The second measure is shown in Figure 3, in which the y-axis represents the average number of days in which maximum temperature falls into one of five bins in a year, weighted for the number of students. Both figures show that the most commonly occurring maximum temperatures, in Celsius, were in the low 30s, and daily temperatures above 39 were rare during this period.
[Figure 2 – Boxplot of county annual mean temperature during the school year] [Figure 3 – Share of school days by bins of maximum temperature]
Compared to settings of previous work examining the impacts of temperature in educational outcomes, Northeast Brazil is significantly warmer. The mean of maximum daily temperatures during the school year of 31.9°C (89.5°F) is not attained in any US county (the setting of Goodman et al. 2018).
3.2. Education data
The education data comes from the School Census (Censo Escolar), an annual survey of every school in Brazil made available by the National Institute for Research on Education (Instituto Nacional de Estudos e Pesquisas Educacionais Anísio Teixeira, INEP)11. We use information on all the K1-K12 enrollments reported in the School Census from 2007 to 2016 to
11 This is a reliable source of information because the federal government frequently checks and audits the
build a panel of over 3.4 million school-grade-year observations across 78 thousand schools in all 1,794 counties in the Brazilian Northeast12.
Our panel includes the following information: characteristics of the school (such as the quality of its infrastructure, whether the school is located in an urban or rural area and whether it is a public or private school), school-level teacher characteristics (such as share by gender, average age, and share by education attainment), school-grade-level enrollment figures and student characteristics (such as share by gender and whether they are older than the ideal age for their grade) and end-of-year grade progression results. This last measure is our main outcome variable, and is computed as share of students in a given school-grade-year that were promoted, retained or that dropout – thus, always adding to 100%.
+ + = 100% (Equation 1)
We also used the first and last day of classes declared by each school in the INEP Census. Since weather is observed at the county level, we averaged the valid dates of all schools in a county to construct a mask of school and non-school days for each year13.
Table 1 describes the dataset and Table 2 shows some descriptive statistics of the education data. The unit of observation in this table is a school-grade-year, unless otherwise noted. Most observations correspond to public schools in rural areas (57%), though enrollment is concentrated
12 Though we started with information on all enrollments, roughly 0.3% of enrollments occurred in singleton
observations in our panel, that is, in a school-grade that appeared only once in our ten-year window. Given that our identification strategy depends on temporal variation within a school-grade, those observations were discarded.
in public urban schools (65%), which have on average more students per grade. Private schools are overwhelmingly urban and represent 12% of enrollments and 14% of observations.
[Table 1 – Dataset description] [Table 2 – Summary Statistics]
4.
Empirical specification and results
To estimate the effect of cumulative heat exposure on student grade progression, we exploit both spatial and temporal variations in temperature for ten years. The main identification assumption is that unobserved determinants of shares of enrolled students by end-of-year grade progression results are uncorrelated with year-to-year variation in county weather. We implement this identification strategy with school-grade fixed effects regressions of the following form:
= + + + + (Equation 2)
where denotes the outcome variable of interest (share of grade promotion, grade retention or dropout) for students enrolled in school s, grade g, in year y. Inclusion of school-grade fixed effects implies that identification comes from within-school-grade comparisons of heat exposure and enrollment outcomes over multiple years. Grade-year by school-network14 fixed effects flexibly control for a variety of potential confounds, including time-evolving state educational policy and differential standards for grade promotion between public and private schools in any given state and year. We also include a set of school-grade-level controls X, including student demographics (average number of students per classroom, share of males, share of students who
are older than the ideal age for their grade, whether the classroom is a mixed-level grade) and school-level characteristics (infrastructure score15, average age of teachers, share of male teachers and share of teachers with tertiary education). Standard errors are clustered by county, the level of variation in our treatment variable, as usual in the literature (Bertrand, Duflo, and Mullainathan 2004; Abadie et al. 2017).
Our treatment variable , is the average of maximum temperature experienced in the county of school s during school days in year y, in which case the coefficient of interest can be interpreted as the impact on grade progression of students experiencing a one-degree Celsius hotter school year on average. Absent an analysis of the mechanisms through which heat may affect academic progress, is interpreted as both cognition and income net effects, including direct effects on children and indirect effects through teachers and principals.
In a more flexible specification, we replace average maximum temperature with a vector of shares of school days with maximum temperature falling into various bins (below 27°C, 27-31°C, 31-35°C, 35-39°C and above 39°C). In this specification, the vector of coefficients can be interpreted as the impact of experiencing 1% more days in each temperature bin, relative to a 1% less days below 27°C (the omitted temperature bin).
As noted, we include a rich set of fixed effects. In particular, we are identifying off within-school-grade, within-network temporal trends variation. Our identifying assumption is that once school-grade and network time trends are controlled for, the realization of temperature on any particular year is exogenous to unobserved determinants of students’ grade progression results.
One potential concern with this strategy is that grade promotion standards vary by year within a school, in a way not captured by network time trends. We believe this to be unlikely, for education policies education set at the state level are already factored in our school-network fixed-effects16.
4.1. Mean impacts
The base results are summarized in Tables 3 and 4. In both, Panel A shows the impact of the mean of daily maximum temperature and Panel B displays the impact of share of days in each temperature bin. The first column contains results for grade promotion (Table 3) or dropouts (Table 4), measured in percentage points, using our preferred specification (described in Equation 2), incorporating cohort demographic controls and analytical weights corresponding to the average number of enrolled students in a school-grade for ten years. Columns 2 to 4 present alternative specifications by omitting the cohort controls and/or weights.
[Table 3 – Grade promotion regression results] [Table 4 – Drop-out rate regression results]
On average in the Brazilian Northeast, enrolled K1-K12 students experiencing a 1°C hotter school year achieve 0.36 percentage points lower grade promotion and 0.26 higher dropout rates, results that are robust statistically significant. Given an average grade promotion of 81.08% in the sample, this implies a 0.43% decrease in grade promotion. Similarly, the effect on dropouts
16 The provision of public education in Brazil is the responsibility of both the municipality and state. Whereas the
municipality is in charge of the elementary and middle school grades (i.e., K1-K9), the state is responsible for high school (i.e., K10-K12). However, states have strong influence over K1-K9 policies, coordinating programs and overseeing
represent a 3.86% increase from the average rate of 6.73%. The impact on grade retention is not statistically significant (mean +0.09, s.d. 0.16)17.
Very hot days are particularly damaging to end-of-year grade promotion: replacing one school day (roughly 0.5% of 200 annual school days) below 27°C with a day above 39°C lowers grade promotion by 0.106 percentage points and increases dropouts by 0.081 percentage points. Panel B of Tables 3 and 4 shows the specification in which we consider the impacts of cumulative heat exposure as share of school days per temperature bins, with days below 27°C as the omitted category. Those coefficients suggest that the magnitude of the impact increases roughly linearly with the temperature, as represented in Figure 4 and 5, which exbibit graphically the coefficients in columns (1) of Tables 3 and 4.
[Figure 4 – Coefficients from 4°C temperature bins on grade promotion] [Figure 5 – Coefficients from 4°C temperature bins on drop-out rates]
Using the coefficients by temperature bins to calculate the impacts of a 2°C degree increase in every school day, in line with IPCC predictions (IPCC, 2014), yields an estimated 0.671 percentage points decrease in grade promotion and a 0.338 increase in dropouts.
4.2. Heterogeneity by school type
We now turn our attention to school characteristics that may justify heterogeneous effects of heat exposure. Though the physical mechanisms, should not differ between schools, private institutions have greater resources available to mitigate the effect of heat, e.g., with fans and air conditioning. In our setting, air conditioning prevalence is believed to be very small, but
unfortunately, we do not observe these mitigation technologies directly. Similarly, schools in urban areas tend to have better infrastructure than their rural counterparts. In section 4.4. we use existing data on rural schools’ water supply to further investigate this heterogeneity.
For this section we re-estimate the preferred specification (including a comprehensive set of controls and weighting by number of students) splitting the sample by school type: rural/urban and public/private. Results are presented graphically18 in figures 6 through 9.
[Figure 6 – Coefficients from 4°C temperature bins on grade promotion: heterogeneity rural/urban schools]
[Figure 7 – Coefficients from 4°C temperature bins on drop-out rates: heterogeneity rural/urban schools]
[Figure 8 – Coefficients from 4°C temperature bins on grade promotion: heterogeneity public/private schools]
[Figure 9 – Coefficients from 4°C temperature bins on drop-out rates: heterogeneity public/private schools]
Though the point estimates of the effects of heat on grade progression and drop-out rates are larger for rural schools, they are not statistically different from each other. There’s a noticeable contrast between private and public schools: they both exhibit statistically significant negative effects of heat on grade progression, however, dropouts only increase in public schools. While the “leakage” on regular progression caused by increased retention is significant both on private and
public schools, students who attend private schools are generally from higher-income families and less likely to drop-out.
4.3. Robustness checks
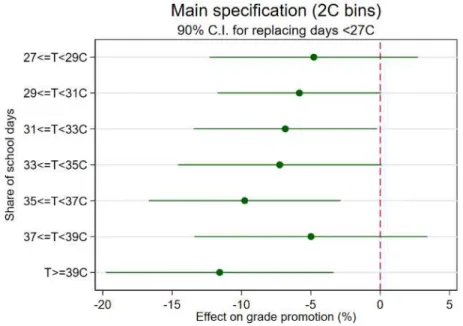
We repeat the estimation for narrower temperature bins, in 2°C increments, as a robustness check. Figure 10 shows results for grade progression: standard errors increase but the estimated coefficient on temperature retains sign for all and significance for most bins.
[Figure 10 – Coefficients from 2°C temperature bins on grade promotion: robustness check]
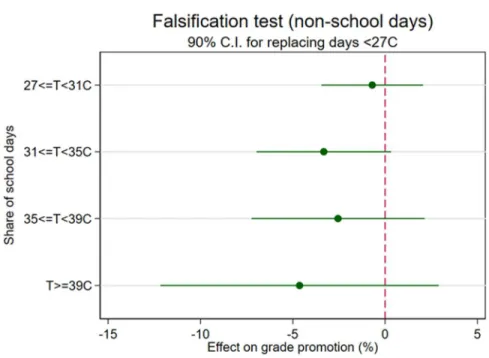
As falsification tests we perform two placebo exercises. First, we replace school days with non-school days when calculating the temperature bins for each county-year. Second, we replace the temperature of a given year with data from the following year in the same county. The results of these exercises on grade progression are reported in Figures 11 and 12. In each case the point estimate of the coefficients of interest are smaller and in no case these estimates are statistically significant. This makes it less likely that our results are driven by spurious correlations between temperature and schooling and is consistent with our interpretation of these impacts as causal19.
[Figure 11 – Coefficients from 2°C temperature bins on grade promotion: falsification test using non-school days]
[Figure 12 – Coefficients from 2°C temperature bins on grade promotion: falsification test using following year]
4.4. Water cisterns in schools
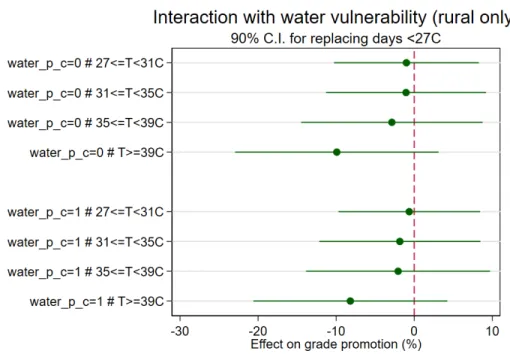
Constructing residential water cisterns in drought-prone areas of the Brazilian Northeast has been shown to reduce political clientelism, through a reduction in economic vulnerability (Bobonis et al. 2017). Likewise, we investigate whether school water cisterns could influence educational outcomes, particularly in rural areas, in which most schools are not connected to the public water network. Cisterns would attenuate the detrimental effects of droughts created by abnormal warm years. Weighted by enrollment, only 45% of rural public schools receive water through the public network, an additional 23% are not linked but have cisterns to store rain water, 27% access water through spring and wells and 6% don’t have a reliable water source.
[Table 5 – Water supply statistics]
We investigate whether the rural public schools that are most vulnerable to droughts – without access to the public water network nor a cistern – experience more intense effects from high temperatures. As Figures 13 and 14 show, we did not find any statistically significant difference between those subgroups. This suggests that the effects we capture above do not concern to access to water (droughts) caused by the heat, but from exposure to high temperatures.
5.
Conclusion
In this paper, we estimate the effects of high temperature on human capital accumulation, using enrollment outcomes from the Brazilian Northeast. We build on the existing research of impacts from long-run exposure to heat (e.g., Goodman et al., 2018) but unlike previous studies, we focused on extensive margins: whether students remain enrolled and progressing through K-12
We show that a one-degree Celsius increase in the daily temperature during the school year leads to an estimated 0.35 percentage points (0.43%) decrease in grade promotion and a 0.26 percentage points (3.86%) increase in dropouts. Using estimators by temperature bins and considering the predicted 2-degree Celsius warming by 2050 (IPCC, 2014), this would mean a 0.67 percentage points decrease in grade promotion and a 0.34 increase in dropouts. We also examined heterogeneity of effects across school characteristics, finding that rural and public schools seem to be more affected by heat. Water vulnerability (e.g., lack of cisterns and connections to public water supply) does not explain the effects of heat exposure on rural schools’ grade progression. Additional research is needed to disentangle the precise mechanisms that underlie the observed differences, for both income and cognition channels are plausible.
Understanding the relationship between cumulative heat exposure and grade progression is of policy relevance considering the accelerating warming in most parts of the world. Though our empirical setting is Brazil, our results have implications for other developing countries that, similarly, have a significant gap between enrollment and conclusion rates and a low access to air conditioning. Our findings suggest that heat exposure can further aggravate this gap, hindering skill formation and therefore potentially perpetuating poverty and reducing economic growth.
References
Abadie, Alberto, Susan Athey, Guido Imbens, and Jeffrey Wooldridge. 2017. “When Should You Adjust Standard Errors for Clustering?” w24003. Cambridge, MA: National Bureau of Economic Research. https://doi.org/10.3386/w24003.
Barro, Robert J. 1991. “Economic Growth in a Cross Section of Countries.” The Quarterly Journal of Economics 106 (2): 407–43. https://doi.org/10.2307/2937943.
Bertrand, Marianne, Esther Duflo, and Sendhil Mullainathan. 2004. “How Much Should We Trust Differences-In-Differences Estimates?” The Quarterly Journal of Economics 119 (1): 249– 75. https://doi.org/10.1162/003355304772839588.
Björkman-Nyqvist, Martina. 2013. “Income Shocks and Gender Gaps in Education: Evidence from Uganda.” Journal of Development Economics 105 (November): 237–53. https://doi.org/10.1016/j.jdeveco.2013.07.013.
Bobonis, Gustavo J, Paul Gertler, Marco Gonzalez-Navarro, and Simeon Nichter. 2017. “Vulnerability and Clientelism.” Working Paper 23589. National Bureau of Economic Research. https://doi.org/10.3386/w23589.
Card, David. 2001. “Estimating the Return to Schooling: Progress on Some Persistent Econometric Problems.” Econometrica 69 (5): 1127–60. https://doi.org/10.1111/1468-0262.00237. Dee, D. P., S. M. Uppala, A. J. Simmons, P. Berrisford, P. Poli, S. Kobayashi, U. Andrae, et al.
2011. “The ERA-Interim Reanalysis: Configuration and Performance of the Data Assimilation System.” Quarterly Journal of the Royal Meteorological Society 137 (656): 553–97. https://doi.org/10.1002/qj.828.
Garg, Teevrat, Maulik Jagnani, and Vis P. Taraz. 2017. “Human Capital Costs of Climate Change: Evidence from Test Scores in India.” In . http://purl.umn.edu/258018.
Gomes-Neto, João Batista, and Eric A. Hanushek. 1994. “Causes and Consequences of Grade Repetition: Evidence from Brazil.” Economic Development and Cultural Change 43 (1): 117–48.
Goodman, Joshua, Michael Hurwitz, Jisung Park, and Jonathan Smith. 2018. “Heat and Learning.” Working Paper 24639. National Bureau of Economic Research. https://doi.org/10.3386/w24639.
Graff Zivin, Joshua, Solomon M. Hsiang, and Matthew Neidell. 2017. “Temperature and Human Capital in the Short and Long Run.” Journal of the Association of Environmental and Resource Economists 5 (1): 77–105. https://doi.org/10.1086/694177.
Graff Zivin, Joshua S., Yingquan Song, Qu Tang, and Peng Zhang. 2018. “Temperature and High-Stakes Cognitive Performance: Evidence from the National College Entrance Examination in China.” 24821. NBER Working Papers. National Bureau of Economic Research, Inc. https://ideas.repec.org/p/nbr/nberwo/24821.html.
Groppo, Valeria, and Kati Kraehnert. 2017. “The Impact of Extreme Weather Events on Education.” Journal of Population Economics 30 (2): 433–72. https://doi.org/10.1007/s00148-016-0628-6.
IBGE. 2010. Censo Demográfico 2010 & 2000. Retrieved from http://www.ibge.gov.br/
IBGE. 2017. Pesquisa nacional por amostragem de domicilios. Retrieved October 20, 2018, from http://www.ibge.gov.br/
INEP. 2018. Censo Escolar 2007-2017. Retrieved from http://inep.gov.br/web/guest/microdados IPCC. 2014. "Climate Change 2014: Synthesis Report."
Jensen, Robert. 2000. “Agricultural Volatility and Investments in Children.” American Economic Review 90 (2): 399–404. https://doi.org/10.1257/aer.90.2.399.
Jones, Philip D., Colin Harpham, Alberto Troccoli, Benoit Gschwind, Thierry Ranchin, Lucien Wald, Clare M. Goodess, and Stephen Dorling. 2017. “Using ERA-Interim Reanalysis for Creating Datasets of Energy-Relevant Climate Variables.” Earth System Science Data 9 (2): 471–95. https://doi.org/10.5194/essd-9-471-2017.
Maccini, Sharon, and Dean Yang. 2009. “Under the Weather: Health, Schooling, and Economic Consequences of Early-Life Rainfall.” American Economic Review 99 (3): 1006–26. https://doi.org/10.1257/aer.99.3.1006.
Park, Jisung. 2018. “Hot Temperature and High Stakes Cognitive Assessments: Evidence from New York City Public Schools.”. Unpublished manuscript, available at http://rjisungpark.com/research/hot-temperature-and-high-stakes-exams/.
Romer, Paul M. 1986. “Increasing Returns and Long-Run Growth.” Journal of Political Economy 94 (5): 1002–37.
Seppanen, O., W. J. Fisk, and Q. H. Lei. 2006. “Room Temperature and Productivity in Office Work.” Article. Healthy Buildings 2006, Lisbon, Portugal, June4-8, 2006. July 1, 2006.
Shah, Manisha, and Bryce Millett Steinberg. 2017. “Drought of Opportunities: Contemporaneous and Long-Term Impacts of Rainfall Shocks on Human Capital.” Journal of Political Economy 125 (2): 527–61. https://doi.org/10.1086/690828.
Figures
Figure 2 - Boxplot of county annual mean temperature during the school year
Figure 4 - Coefficients from 4°C temperature bins on grade promotion (Column 1 in Panel B of Table 3)
Figure 5 - Coefficients from 4°C temperature bins on dropout rates (Column 1 in Panel B of Table 4)
Figure 6 - Coefficients from 4°C temperature bins on grade promotion: heterogeneity rural/urban schools
Figure 7 - Coefficients from 4°C temperature bins on dropout rates: heterogeneity rural/urban schools
Figure 8 - Coefficients from 4°C temperature bins on grade promotion: heterogeneity public/private schools
Figure 9 - Coefficients from 4°C temperature bins on dropout rates: heterogeneity public/private schools
Figure 10 - Coefficients from 2°C temperature bins on grade promotion: robustness check
Figure 11 - Coefficients from 4°C temperature bins on grade promotion: falsification test using non-school days
Figure 12 - Coefficients from 4°C temperature bins on grade promotion: falsification test using following year
Figure 13 - Coefficients from 4°C temperature bins on grade promotion: by water vulnerability (rural schools only)
Figure 14 - Coefficients from 4°C temperature bins on dropout rates: by water vulnerability (rural schools only)
Table 4 - Flow Regression Results (K1-K12, Brazilian Northeast, 2007-2016) dependent variable:
(1) (2) (3) (4)
(A) Avg of max temperature
Avg of tmax during school year (°C) 0.26 0.29 0.18 0.17 (0.10)**(0.10)***(0.09)** (0.09)* (B) Bins of max temperature
Share of days with 27°C ≤ t < 31°C 5.79 5.42 0.53 0.33 (1.83)***(1.96)*** (2.21) (2.21) Share of days with 31°C ≤ t < 35°C 4.88 4.40 -0.18 -0.48 (1.98)** (2.15)** (2.26) (2.26) Share of days with 35°C ≤ t < 39°C 7.89 7.94 1.93 1.79
(2.06)***(2.34)*** (2.33) (2.33)
Share of days with t ≥ 39°C 8.06 7.14 2.53 1.72
(3.33)** (3.48)** (3.54) (3.65) Specification
Cohort demographic controls Yes No Yes No
Analytical weights Yes Yes No No
N obs (school-grade-year)
Drop-out
3,405,517
Notes: Heteroskedasticity robust standard errors clustered by municipality are in parentheses (* p<.10; ** p<.05; *** p<.01). Coefficients in each column come from a regression of hundredths of share of enrolled students on the weather measure(s) shown. Controls include: student demographics (average number of students per classroom, share of males, share of students who are older than the ideal age for their grade, whether the classroom is a mixed-level grade) and school-level characteristics (infrastructure score , average age of teachers, share of male teachers and share of teachers with tertiary education). Analytical weights consider observations according to the average number of enrolled students in a school-grade. Temperature refers to the daily maximum observed in school days in that school year. All regressions include fixed effects for each combination of school network, grade and year and school-grade fixed effects.
Table 5 - Water Supply Statistics (K1-K12, Brazilian Northeast, 2007-2016) Public Rural (2) Public Urban (3) Private Rural (4) Private Urban (5) Student-weighted statistics (mean / sd)
Water supply: public network 0.83 0.45 0.94 0.43 0.92
0.38 0.50 0.24 0.49 0.26
Water supply: cistern 0.06 0.23 0.01 0.15 0.01
0.24 0.42 0.12 0.36 0.12
Water supply: spring / well 0.10 0.27 0.04 0.43 0.06
0.29 0.44 0.20 0.49 0.24
Water supply: none 0.01 0.06 0.00 0.00 0.00
0.12 0.23 0.06 0.04 0.02
All schools
(1)
By school type
Note: A few schools report relying in multiple water sources. In those cases, we considered them in the least vulnerable to drought category (public network > cistern > spring/well > none).
Appendix
Figure A.1 – Grade promotion in Brazil and Northeast Brazil (2007-2016). Source: INEP
Figure A.3 – Dropout rates in Brazil and Northeast Brazil (2007-2016). Source: INEP
Figure A.4 - Coefficients from 2°C temperature bins on dropout rates: robustness check
Figure A.5 - Coefficients from 4°C temperature bins on grade promotion: falsification test using non-school days
Figure A.6 - Coefficients from 4°C temperature bins on grade promotion: falsification test using following year
Table A.1 - Flow Regression Results (K1-K12, Brazilian Northeast, 2007-2016) dependent variable:
(1) (2) (3) (4)
(A) Avg of max temperature
Avg of tmax during school year (°C) 0.10 0.11 0.13 0.14 (0.16) (0.17) (0.17) (0.18) (B) Bins of max temperature
Share of days with 27°C ≤ t < 31°C 0.31 0.02 2.51 2.89 (2.56) (2.54) (2.91) (2.95) Share of days with 31°C ≤ t < 35°C 2.80 2.48 3.64 3.88
(2.75) (2.78) (3.20) (3.25) Share of days with 35°C ≤ t < 39°C 0.58 0.52 3.08 3.57
(3.27) (3.30) (3.59) (3.69)
Share of days with t ≥ 39°C 2.58 2.15 6.88 7.16
(4.00) (3.95) (4.34) (4.43) Specification
Cohort demographic controls Yes No Yes No
Analytical weights Yes Yes No No
N obs (school-grade-year)
Notes: Heteroskedasticity robust standard errors clustered by municipality are in parentheses (* p<.10; ** p<.05; *** p<.01). Coefficients in each column come from a regression of hundredths of share of enrolled students on the weather measure(s) shown. Controls include: student demographics (average number of students per classroom, share of males, share of students who are older than the ideal age for their grade, whether the classroom is a mixed-level grade) and school-level characteristics (infrastructure score , average age of teachers, share of male teachers and share of teachers with tertiary education). Analytical weights consider observations according to the average number of enrolled students in a school-grade. Temperature refers to the daily maximum observed in school days in that school year. All regressions include fixed effects for each combination of school network, grade and year and school-grade fixed effects.
Grade Retention
The consequences of chronic exposure to
community violence for children’s academic
progression in Rio de Janeiro, Brazil
Diana Goldemberg
FGV EPGE
Emily Hanno
Harvard University
January 16, 2019
AbstractThis paper explores the effects of cumulative exposure to urban violence on grade retention and on-time grade completion of children attending elementary schools in Rio de Janeiro, Brazil. Relying on longitudinal data on crime and educational outcomes for five cohorts of children attending municipal schools in the city (n = 256,961), we find that a one standard deviation increase in homicides rate in the school neighborhood raises the likelihood that a child will be retained in grades K1-K4 by 0.42 percentage points any given year. We further explore the consequences of continued exposure, over multiple years, to high violence rates. We estimate that a single year of exposure to high violence during the initial four years of elementary school leads to a 6.9 percentage points reduction in the probability of reaching fifth grade on time. The effect is roughly twice as large for children facing four continuous years of high violence, suggesting that the deleterious impacts of prolonged exposure to violence do not accrue linearly.
1.
Introduction
While violence is a threat facing many communities across the globe, certain regions are disproportionately affected. In 2017, Latin America was home to 41 of the 50 most violent cities in the world and Brazil, in particular, was home to 17 of these cities (Consejo Ciudadano para la Seguridad Pública y Justica Penal A.C., 2018). In one of Brazil’s most well-known metropolises, Rio de Janeiro20, rising violence levels motivated a rare takeover by the federal military in early 2018 (Lopes, 2018; BBC, 2018). Rio’s uptick in violence over the last several years has also resulted in frequent closures of schools due to shootouts in their surrounding communities (Londoño, 2017). It therefore stands to reason that children’s learning is likely an additional causality of Rio’s violence.
Indeed, a growing body of research conducted in Rio and elsewhere shows that exposure to community violence has adverse consequences for a host of child outcomes, including those related to schooling and academics (Molano, Harker, & Cristancho, 2018; Monteiro & Rocha, 2017; Sharkey, Schwartz, Ellen, & Lacoe, 2014). Beyond the effects of violence on the availability of education, insights from the biological sciences suggest that traumatic events activate the brain’s stress response system, and that repeat or sustained activation of that system negatively affects children’s cognitive and emotional functioning (Foster & Brooks-Gunn, 2009; National Scientific Council on the Developing Child, 2014; Sharkey, 2018).
Existing studies of the effect of violence on student outcomes fall into two categories. They analyze either the acute effects (i.e., direct exposure to singular violent events), or the chronic
effects of violence occurring within a set time span (i.e., one academic year). The potential impacts of prolonged exposure to violence (i.e., over multiple years) remains a less explored topic, which is the gap this paper aims to address. Descriptive evidence shows that children exposed to multiple risk factors or that endure prolonged socioeconomic adversity have lower academic outcomes, suggesting that prolonged exposure to violence might also be a relevant concern (Edwards, Holden, Felitti, & Anda, 2003; Jimenez, Wade, Lin, Morrow, & Reichman, 2016; Michelmore & Dynarski, 2017). However, two competing hypotheses are plausible: (i) continued exposure to community violence might compound to an even greater impact on children’s functioning than short-term exposure, or (ii) children may develop adaptive responses to chronic violence in such a way that continued exposure to violence causes diminishing marginal damage. We are particularly interested on the effects of violence on grade retention, for this is a salient issue in Brazil, where over 35% of 15-year old students assessed in PISA reported repeating at least one grade, the second highest rate of retention among the 72 participating countries (OECD, 2016).
To investigate the cumulative effects of exposure to violence, we rely on longitudinal data on crime and educational outcomes for five cohorts of children attending municipal schools in Rio de Janeiro. We construct a panel with students’ grade progress during their first four years in elementary school. From the 256,961 children in our sample, over 30% fail to reach fifth grade on time. We observe violence at the school-neighborhood level and use school- and flexible cohort- fixed effects to compare the academic progress of children attending the same schools but exposed to distinct amounts of violence over time. Our identification strategy relies on the assumption that unobserved determinants of grade progression in any specific school are uncorrelated with year-to-year variation in school-neighborhood violence.
During 2007-2016, the average violent crime rate in Rio was 33.6 deaths per 100,000 inhabitants21, with substantial variation across its neighborhoods (standard deviation of 33.7). We measure how many years a student attended school in violence neighborhoods, in which high-violence refers to standardized high-violence rates above certain thresholds (0.5, 1.0 or 1.5 SD above the sample mean). To put those numbers in perspective, in 2017, only 4 US cities with population above 250 thousand recorded homicide rates above Rio’s average, just 2 reached our lowest threshold of 0.5 SD above the mean, or 51.6 violent deaths per 100,000 inhabitants, and none reached the higher thresholds (FBI, 2018). In contrast, 47% of students in our sample have been exposed to high-violence at least one year, and 8% during all their four initial years of elementary school.
We find that a one standard deviation increase in violence raises the likelihood that a child will be retained in elementary grades (i.e., grades K1-K4) by 0.42 percentage points. We additionally explore whether violence seems to matter more in earlier years when children might be more sensitive to violence exposure. While we find that the point estimates of the impacts of violence across the elementary grades are similar, these estimates are less precisely estimated in the later grades. We also find evidence of a negative relationship between mean school-neighborhood violence rates and drop-outs in elementary school. Finally, we explore the consequences of continued exposure, over multiple years, to high violence rates for grade retention and the likelihood that children complete elementary school on time. Considering the threshold
21 Deaths from aggression. This indicator is composed of the following offenses: murder and nonnegligent
manslaughter, homicides resulting from police action, robbery or aggravated assault followed by death. Transportation fatalities are not included. Throughout this paper, the terms homicides, violent deaths and violent crimes, refer
for high violence as 1 standard deviation above Rio de Janeiro neighborhood mean, we find that a single year of exposure to high violence during the initial four years of elementary school leads to a 6.9 percentage points reduction in the probability of reaching fifth grade on time. The effect is approximately twice as large for children facing four years of high violence (i.e., these students were 14.9 percentage points more likely to be behind ideal grade than students never exposed to high violence). We cannot separate the mechanisms through which violence is affecting academic progress, and those results are interpreted as estimated net effects, including direct effects on children and indirect effects through teachers, principals and school climate. Our findings suggest that negative impacts from continued exposure to violence exceeds the effects from short-term exposure, while allowing us to reject the hypothesis of a linear relationship between violence exposure and educational outcomes.
The rest of the paper unfolds as follows. Section 2 presents the related literature. Section 3 provides contextual information and describes the data and sources. Section 4 presents this study’s empirical strategy and its results. Section 5 discusses implications and concludes.
2.
Related literature
2.1. Acute and chronic exposure to violence
The negative effects of acute violent incidences on children’s academic and cognitive outcomes is well documented (McCoy, Raver, & Sharkey, 2015; Sharkey, 2010; Sharkey et al., 2014). In particular, these studies compare the outcomes of children in the same or similar communities, some of whom were exposed to a violent incident immediately before the assessment
before the assessment (the “control”). This approach assumes that the timing of a crime relative to when the assessment took place is exogenous in order to make causal claims about the effect of individual incidents. Sharkey (2010) exploits the random timing of assessments and violent crimes to compare children living in the same communities in Chicago with different exposure to homicide right before the assessment. He finds that in the immediate aftermath of a violent crime (e.g., within a week) there is an adverse but temporal shock to the vocabulary and reading achievement of African American children of approximately 0.5 and 0.7 SD, respectively.
Another strand of literature has focused on the chronic effects of violence occurring within a set time span, though establishing a causal relation between community violence and academic outcomes poses important challenges. Work that explores the observed association between violence levels and academic achievement across different communities risks reporting spurious correlations, for violent incidents tend to occur in areas marked by poverty and other risk factors that could also drive the negative academic achievement. However, recent work exploiting data collected in the same communities over time allows researchers to circumvent this challenge, and has proven that exposure to violent incidents has adverse causal effects on academic outcomes (Monteiro & Rocha, 2017; Sharkey, 2010; Sharkey et al., 2014; Burdick-Will, 2016). Instead of studying the short-term effect of individual violent occurrences, these studies seek to understand the consequences of exposure to violence across a given time period. Burdick-Will (2016), for instance, uses student fixed-effects to estimate the medium-term effects of exposure to violent crimes (i.e., the number of violent crimes in the student’s census block group during a school year) on statewide exams conducted between third and eleventh grade in Chicago. She finds that early exposure has negative effects on math and reading achievement across grades, with these negative
impacts building on each other over time. Also using a fixed effects approach, Monteiro & Rocha (2017) exploit variation across three years in gang conflict in the neighborhoods surrounding schools in Rio de Janeiro. They find that in the years in which the school was exposed to at least two days of conflict in a favela within at least 250 meters of the school, children’s math and Portuguese achievement was 0.05 and 0.03 SD lower on average, respectively. Significantly negative results are also found on studies that analyze the long-term effects on human capital accumulation from civil wars (León, 2012; Chamarbagwala and Morán, 2011).
2.2. Mechanisms
Community violence may negatively impact children’s academic outcomes through a variety of mechanisms (Burdick-Will, 2016; Leventhal & Brooks-Gunn, 2000). In extreme situations like Rio, violence may have practical implications, preventing children or teachers from being able to attend school. Violence may also affect children’s academic functioning through its effect on children’s physiological and mental wellbeing (Burdick-Will, 2016; Shonkoff et al., 2012). Typically, the body’s stress response is a healthy protective reaction to danger but exposure to intense or multiple stressors elevates stress hormones to levels that can weather the body’s organs, including the brain (Gould, McEwen, Tanapat, Galea, & Fuchs, 1997; Shonkoff et al., 2012). These neurobiological changes are thought to then influence how children understand and interact with their surrounding environments (McCoy, 2013). While little work explicitly connects these biological processes to observable child behaviors, some work hypothesizes that such intensified stress responses affect children’s self-regulation and mental health (McCoy, Roy, & Raver, 2016; Molano et al., 2018). Regulatory-related skills are in turn thought to undergird children’s ability
Violence may also affect the schools and adults responsible for delivering education to children. School climate, or the nature of the school environment, may be one mechanism through which violence adversely affects student achievement (McCoy, Roy, & Sirkman, 2013). Additionally, educators themselves may experience adverse physiological and mental consequences of violence exposure, which in turn could have consequences for their work with students. Whereas less research has studied the consequences of violence on teachers, more recent work documenting the adverse consequences of community violence on parental wellbeing and behaviors suggest that violence could also affect teachers’ wellbeing and behaviors with students (Cuartas, McCoy, & Molano, 2018).
2.3. On-time grade progression
Most work estimating the effects of violence on academic outcomes has focused exclusively on student achievement (e.g., math or reading achievement). Less work has documented the consequences of violence for other academic outcomes like grade retention or on-time grade completion, additional indicators of academic success.
Retaining students in the same grade is costly in terms of additional per pupil spending and foregone earnings if, as a result of being held back, students spend an additional year in full-time education. Moreover, retention is found to increase the probability that children will drop out of school (Jacob & Lefgren, 2009; Manacorda, 2012). In Uruguay, Manacorda (2012) estimates that grade failure leads to dropout and lower educational attainment on the order of -0.8 school years. Several papers also suggest that grade repetition has adverse consequences for children’s long-term academic performance (Eide & Showalter, 2001; Gomes-Neto & Hanushek, 1994).
less by age 11 than their peers who had not been retained (Fruehwirth, Navarro, & Takahashi, 2016). Violence could plausibly affect retention and on-time grade progression through two primary mechanisms. First, violence could affect children academic achievement, making them academically unprepared for the next grade. Second, violence could prevent students from attending a sufficient amount of school required for promotion. These consequences on attendance could also exacerbate the effects on achievement.
3.
Context and Data
Our analysis examines children’s grade progression in municipal schools in Rio de Janeiro in relation to community violence around their school. We first describe the context and each of the data sources, sample and procedures used in more detail.
3.1. Violence in Rio de Janeiro: context
Rio de Janeiro is Brazil’s second largest city and considered the cultural hub of the country. Violent crime has been a problem in Rio for many decades (Couto, Ruediger, & Novis, 2017). Lethal violence disproportionately affects young black men living in slums (Soares & Ribeiro, 2018), and the victims of gun fights among the city’s warring gangs and police are often caught in the crossfire. Though the introduction of Pacifying Police Units was followed by a temporary reduction in violence, particularly of police violence (Magaloni, Franco, & Melo, 2015), the situation deteriorated in recent years, consistent with studies linking negative economic shocks with increased criminal activity (Dix-Carneiro, Soares, & Ulyssea, 2018).
The number of violent homicides in Rio de Janeiro rose by 22% between 2015 and 2016 and by 12% between 2016 and 2017 (ISP, 2018). In 2017, 2,131 individuals were violently killed in the city, 134 of whom were children under the age of 18 (ISP, 2018). To put this figure in perspective, the city of Rio de Janeiro has approximately 2.2 million or 25% fewer residents than New York City but experienced over seven times the number of homicides that took place in New York City in 2017 (Honan, 2018).
For those who live in the city, this violence has resulted in constant fear and anxiety for physical safety (Pearson & Magalhaes, 2018; Reuters, 2018). This recent rise in crime rates has motivated a federal military takeover of security in the city (Lopes, 2018). It has also affected schools, with nearly 200,000 of the city’s students missing at least some days of school in 2017 due to violence-induced closures (Londoño, 2017).
3.2. Violence Data
We construct a ten-year longitudinal dataset on neighborhood violence using information on all murders in Rio de Janeiro made available by the state agency for public safety (Instituto de Segurança Pública, ISP). The municipality is currently divided in 162 neighborhoods and 42 police service areas (PSA, Circunscrições Integradas de Segurança Pública). We consolidated the 162 official neighborhoods into 137 neighborhoods by merging some22, to accurately attribute the crime microdata received from ISP at the least aggregated possible level23. Each of those 137
22 The merging criteria and the resulting map of neighborhood is described in Appendix Figure A1.
23 For approximately 14% of the cases, the neighborhood information was not observed (9%) or could not be matched
to a valid neighborhood (5%), their PSA being the lowest-level geographic information available. We distributed those cases proportionally to all the neighborhoods contained in each PSA, preserving the share of cases each neighborhood
neighborhoods has, on average, 45.7 thousand inhabitants and an area of 8.8 square kilometers24. Then, we used annual population estimates25 to create a panel of neighborhood-level violent crime rates, the number of violent deaths per 100,000 inhabitants, observed yearly for 2007-2016.
Figure 1 presents the distribution of violent crime rates by neighborhood-year: the boxes include the neighborhoods in the 25th to 75th percentiles, the horizontal line in each box represents the median neighborhood-year and the circle represents the municipal average, weighted by population. This figure shows that across the included years, average violence rates were between approximately 24.3 and 53.8 deaths per 100,000 inhabitants. The number of outliers depicted in the box plots by dots above the 75th percentile also shows that there are many neighborhoods with high violence rates. Figure 2 displays Rio de Janeiro neighborhoods according to their average violent crime rate in the period.
In our analyses, our primary predictors of interest are the school-neighborhood violent crime rates, standardized for the average of 33.6 and standard deviation of 33.7 deaths per 100,000 inhabitants exhibited in 2007-2016. Alternatively, we measure how many years a student attended school in high-violence neighborhoods, in which high-violence refers to standardized violence rates above certain thresholds in each given year (0.5, 1.0 or 1.5 SD above the sample mean). Those thresholds correspond to rates of above 51.6, 69.8 and 88.0 violent deaths per 100,000 inhabitants.
[Figure 1: boxplot] [Figure 2: violence map]
24 Comparable to Chicago’s official 77 community areas, which average 37.6 thousand inhabitants and 7.9 km2. 25 Interpolating and extrapolating the 2000 and 2010 population census by the Brazilian Institute of Geography and