Study of retroanalysis of asphal c pavements
resilience modules with the use of ar ficial neural
networks
Alcidney Ba sta Celeste1, Francisco Heber Lacerda de Oliveira2 1Na onal Department of Transport Infrastructure, alcidney.ba sta@dnit.gov.br 2Federal University of Ceará, heber@det.ufc.br
Recebido:
13 de julho de 2018
Aceito para publicação:
14 de outubro de 2019 Publicado: 31 de dezembro de 2019 Editor de área: Kamilla Vasconcelos ABSTRACT
Knowledge of pavement Resilience Modules (RM) is an important element for the struc-tural assessment of exis ng infrastructures. One way to determine them is through dy-namic repeated load tes ng in the laboratory; another way is to use the technique of retroanalysis, which consists in obtaining the RM from the thickness of the layers and the deflec ons measured on the pavement surface. In this sense, this paper aims to present the RM retroanalysis through the technique of Ar ficial Neural Networks (ANN) as an alterna ve to the tradi onal retroanalysis. The results demonstrate that the ANN could predict the RM with results of coefficients of determina on (R²) above 99.9% be-tween the reference and predicted values. Thus, ANN are a poten al alterna ve to ob-tain this important mechanical property of paving materials compared to tradi onal methods.
RESUMO
O conhecimento dos Módulos de Resiliência (MR) de pavimentos é elemento impor-tante para a avaliação estrutural das infraestruturas existentes. Uma maneira de deter-miná-los é através de ensaios dinâmicos de carga repe da, em laboratório; outra forma, é u lizar a técnica de retroanálise, que consiste na obtenção dos MR a par r das espes-suras das camadas e das deflexões medidas na superJcie do pavimento. Nesse sen do, este ar go tem o obje vo de apresentar a retroanálise dos MR através da técnica de Redes Neurais Ar ficiais (RNA) como alterna va à retroanálise tradicional. Os resultados demonstraram que as RNA conseguem prever os MR com resultados de coeficientes de determinação (R2) acima de 99,9% entre os valores de referência e previstos. Desse modo, as RNA se apresentam como uma alterna va em potencial para a obtenção dessa importante propriedade mecânica dos materiais para pavimentação frente aos métodos tradicionais.
Keywords:
Asphalt pavements, Resilience module, Retroanalysis,
Ar ficial neural networks.
Palavras-chaves:
Pavimentos asfál cos, Módulo de resiliência, Retroanálise,
Redes Neurais Ar ficiais. DOI:10.14295/transportes.v27i4.1781
1. INTRODUCTION
In Brazil, since the mid-1960s, asphalt pavement highways have been designed using an empir-ical method that is based on the subgrade's carrying capacity through the California Bearing Ratio. Such method does not consider the in%luence of the mechanical properties of the constit-uent materials of the layers underlying the subgrade under the stresses and deformations caused by the loads acting on the surface of the pavement.
With the development of studies and research on new asphalt pavement design methods, the knowledge of the elastic characteristics of the materials used in road paving becomes indispen-sable. The Resilience Module (RM) is a mechanical property of the material whose knowledge is essential for the use of mechanistic-empirical methods of designing new pavements as well
as for the structural evaluation of existing pavements, when an evaluation of their lifespan is required.
Material RM has been increasingly used in the country with the purpose of using mechanis-tic-empirical pavement design methods (Bernucci et al., 2006). The RM is determined by dy-namic repeated load testing in laboratory. However, due to the limited number of laboratories specialized in this type test in the country, the technique called “retroanalysis” has been used, which, combined with the concepts of elasticity theory, obtain the RM from the thickness of the layers and the de%lections measured in the surface of the pavement.
Traditional retroanalysis is an iterative process; it does not generate a single solution and its results can be highly in%luenced by initial conditions and other variables. In order to overcome these constraints, it is possible to use Arti%icial Neural Networks (ANN), which are relatively new techniques, widely used to solve nonlinear problems and that apply to several areas of knowledge, including pavement engineering, with satisfactory results.
Given the situation described above, this paper aims to present a study on the RM retroanal-ysis of paving materials using ANN as an alternative to traditional retroanalretroanal-ysis. The study was conducted on 130 km of the BR-304 highway in the state of Rio Grande do Norte, with about 3,200 %ield-measured de%lection basins.
2. RETROANALYSIS
Retroanalysis is a process that is based on the interpretation of the shape and magnitude of the displacement of the pavement surface (de%lectometric basin) when it is subjected to loads (Al-bernaz et al., 1995 and Nóbrega, 2003). From the concepts of the Boussinesq and Burmister elasticity theory and the de%lectometric basins, it is possible to obtain a more accurate diagnosis of the structural conditions of the pavement by obtaining its elastic characteristics, for example, the resilience modules of the constituent materials of each layer. (Rocha Filho and Rodrigues, 1996, Nóbrega, 2003).
2.1. Retroanalysis methods
Currently retroanalysis methods fall into two groups: iterative and simpli%ied. The iterative methods are those whose determination of the elastic and geometrical characteristics of the pavement layers are performed by comparing the de%lectometric basin obtained in %ield and the theoretical of a series of structures. The process ends until the %ield de%lections are the same as those obtained for theoretical basin or has a permissible residue which is de%ined at the begin-ning of the process. However, because iterative processes are used in the convergence of its own solution, they require a lot of processing time and, depending on the number of analysis pas-sages, this process can take hours or even days to complete (Albernaz et al., 1995 and Nóbrega, 2003).
In turn, the simpli%ied methods are characterized by using equations, tables and graphs, among other simpli%ications of the theory of elasticity applied to homogeneous, isotropic and linearly elastic media. According to Albernaz (1997), these methods generally convert the mul-tilayer structures into simpler one-, two- or three-layer structures, already considering the sub-grade. They lose accuracy due to simpli%ication; however, they gain in processing time calcula-tions of the elastic parameters of the structure.
Given the limitations of the methods described before, ANN have been applied in various %ields of pavement engineering, including the retroanalysis of paving materials, with favorable results between actual and predicted values.
Coutinho Neto (2000) applied ANN into retroanalysis, composed of an input layer with arti-%icial de%lection basin, radius of curvature and the thickness of the pavement layers. The exit layer consisted of the RM of the pavement layers. Six ANN were implemented: two simulating the two-layer procedure (one simulating the Benkelman Beam test and the other the Falling Weight De%lectometer - FWD), two for the three-layer pavement (simulation with the same de-vices) and two for the four-layer pavement (simulating the tests described above). Through lin-ear regressions between the real RM and those predicted by the ANN, coef%icients of determi-nation (R²) that demonstrated a good linear correlation between the real RM were obtained. (Zanetti, 2008).
Macedo (2003) developed statistical analysis and ANN in the comparison of retroanalyzed RM from basins obtained with Benkelman Beam and FWD with real RM. The results showed that the R² obtained by ANN analysis were, in general, higher than the R² obtained by statistical analysis. Even in cases whose R² obtained in the statistical analysis was better than in the ANN analysis, the correlations obtained by the latter, unlike the statistical correlations, allow its ex-trapolation.
In turn, Zanetti (2008) used the ANN to obtain the RM of the three- and four-layer pavement layers, from the retroanalysis of simulated theoretical basins in a mechanistic analysis program, as well as deformation stresses on the underside of the wearing course and the tension at the top of the subgrade for predicting the pavement lifespan. The results obtained were very satis-factory, with a correlation level between real and predicted ANN variables of at least 97.6%.
3. ARTIFICIAL NEURAL NETWORKS (ANN)
ANN is one of the branches of arti%icial intelligence that seeks to develop computational models inspired by the functioning of the human brain (Zanetti, 2008). Such models are a simple com-position of processing units (neurons) interconnected by connections known as “arti%icial syn-apses” (Haykin, 2001 and Godoy et al., 2013).
The working principle of ANN is its ability to learn from examples, the so-called “supervised learning”, which initially consists of presenting a suf%icient set of samples to the network, called a “training set”, which includes all inputs and their respective desired outputs. Thus, through a learning algorithm, the network uses this set for self-training, adjusting, at each iteration, the weights of its layer neurons until the network response approaches the known desired output. The algorithm-stopping criterion is de%ined by the mean square error between the network re-sponses and the desired output.
Ribeiro (2016) made use of ANN techniques in the generation of models to estimate soil RM, so that they can be used in pavement design methods. The results showed that the ANN are able to predict with good accuracy, with a coef%icient of correlation of 0.984, the soil RM values, showing promising use of neural models to predict the RM for the mechanistic-empirical design of soil. For the author, this technique allows the use of the models generated in the pavements design, in the absence of information or scarcity of %inancial resources for road projects.
An ANN extracts its maximum computational potential through its structure and its ability to learn and generalize. Such networks produce adequate outputs even if they receive inputs that were not in the training process, so they can even interpret false readings without altering
results. ANN can be employed for pattern classi%ication, time series analysis, data mining, data grouping, and result estimation based on previously acquired knowledge and its generalizabil-ity of situations (Haykin, 2001 and Godoy et al., 2013).
3.1. Mul layer Perceptron Network (MLP)
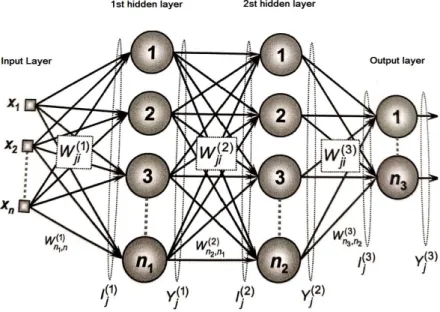
According to Zanetti (2008), Multilayer Perceptron ANN (MLP) are the most widely used ones today because they are very versatile and capable of solving problems from the simplest to the most complex. In MLP-like networks, shown in Figure 1, the intermediate layers are inserted between the input and output layers. The %irst layer of an MLP network consists of input units with independent variables (xi). The last layer contains output units, associated with the de-pendent variables (yi). All other units in the model are called “hidden units” and constitute the intermediate layers.
The structure presented in Figure 1 is proposed in a wide range of applications and can be used as universal function approximator, pattern classi ication, system identi
ication, optimiza-tion, process control and others (Haykin, 2001 and Godoy et al., 2013). Their training is
super-vised, enabling the network to properly adjust the weights through an algorithm called
Back-propagation (retroerror Back-propagation) to better meet the objectives. (Godoy et al., 2013).
Figure 1. MLP Network (Silva et al., 2010)
3.2. Levenberg - Marquardt Method
The Backpropagation algorithm adjusts the values of the MLP network weight matrices in the opposite direction of the quadratic error function; however, the use of this algorithm tends to converge very slowly, requiring high computational effort. To circumvent the problem, various optimization techniques have been incorporated into the Backpropagation algorithm to reduce its convergence time and decrease the computational effort required. The Levenberg-Mar-quardt algorithm is a second order gradient method based on the least squares method for non-linear models that can be incorporated into the Backpropagation algorithm to enhance training process ef%iciency (Silva et al., 2010).
The implementation of these changes by the Levenberg-Marquardt method in the conven-tional Backpropagation algorithm can conduct network training 10 to 100 times faster than the traditional algorithm (Hagan and Menhaj, 1994 and Silva et al., 2010).
4. MATERIALS AND METHODS
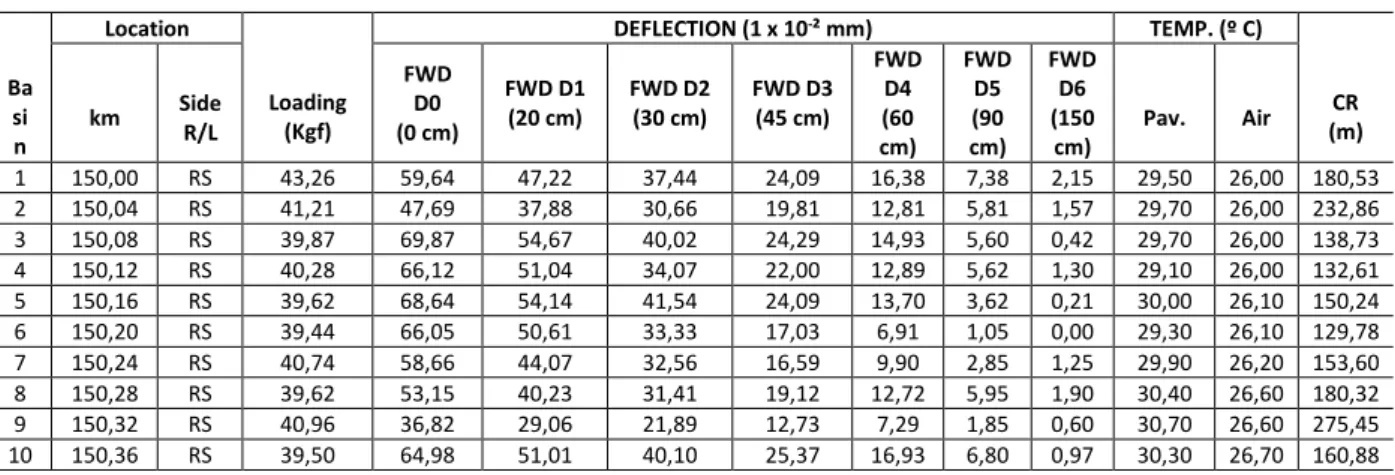
Initially, a highway that had de%lection data measured in the %ield had to be found. The highway chosen was BR-304, in Rio Grande do Norte, between Km 15 and Km 280. In this section, the National Department of Transport Infrastructure has %ield measurements of 3,232 de%lectomet-ric basins made with the FWD. Table 1 shows the database model provided by the FWD assay that was used in this paper. The data correspond to the measurement station location, applied load, de%lections at distances of 0, 20, 30, 45, 60, 90 and 150 cm from the point of application of the load, pavement and air temperature and radius of curvature of the de%lectometric basins.
Table 1 – FWD Assay Database Model - BR-304 / RN Highway
Ba si n Location Loading (Kgf) DEFLECTION (1 x 10-² mm) TEMP. (º C) CR (m) km Side R/L FWD D0 (0 cm) FWD D1 (20 cm) FWD D2 (30 cm) FWD D3 (45 cm) FWD D4 (60 cm) FWD D5 (90 cm) FWD D6 (150 cm) Pav. Air 1 150,00 RS 43,26 59,64 47,22 37,44 24,09 16,38 7,38 2,15 29,50 26,00 180,53 2 150,04 RS 41,21 47,69 37,88 30,66 19,81 12,81 5,81 1,57 29,70 26,00 232,86 3 150,08 RS 39,87 69,87 54,67 40,02 24,29 14,93 5,60 0,42 29,70 26,00 138,73 4 150,12 RS 40,28 66,12 51,04 34,07 22,00 12,89 5,62 1,30 29,10 26,00 132,61 5 150,16 RS 39,62 68,64 54,14 41,54 24,09 13,70 3,62 0,21 30,00 26,10 150,24 6 150,20 RS 39,44 66,05 50,61 33,33 17,03 6,91 1,05 0,00 29,30 26,10 129,78 7 150,24 RS 40,74 58,66 44,07 32,56 16,59 9,90 2,85 1,25 29,90 26,20 153,60 8 150,28 RS 39,62 53,15 40,23 31,41 19,12 12,72 5,95 1,90 30,40 26,60 180,32 9 150,32 RS 40,96 36,82 29,06 21,89 12,73 7,29 1,85 0,60 30,70 26,60 275,45 10 150,36 RS 39,50 64,98 51,01 40,10 25,37 16,93 6,80 0,97 30,30 26,70 160,88
In addition to pavement de%lections, layer thicknesses were made available from the execu-tive design of the highway under construction. The highway has layers whose average thickness is 5 cm of Asphalt Concrete, 19.4 cm of granular base and 20 cm of granular base. The sub-grade for calculation purposes is considered as a semi-space of in%inite thickness.
For the case under study, the ANN training sample set has, as input data, the thickness of the pavement layers and the de%lection basins measured on the surface. On the other hand, the de-sired outputs were the respective RM of each pavement layer for each de%lection measuring station performed. In this sense, due to the dif%iculty of obtaining these RM through repeated load triaxial tests and the large number of de%lectometric basins, a traditional backanalysis was initially used to obtain the RM set of all 3,232 basins measured by FWD. For this, the subroutine Retroanalysis of the SISPAV program was used (Franco, 2007).
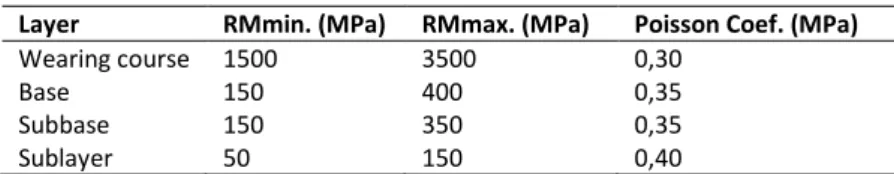
The program performs the backanalysis of the RM from the layer thicknesses and the de%lec-tometric basins measured in the %ield. It also performs the back analysis of the Poisson's ratio values of the materials that compose each layer, the pavement temperature, the applied load and the variation interval between the layers of minimum and maximum values of the RM. All these data are available in the FWD results, except for Poisson's coef%icients and minimum and maximum RM values. For these, values recommended in the established given material litera-ture were used. The values are presented in Table 2.
Table 2 – Maximum and Minimum Resilience Modules and Poisson's Coefficients
Layer RMmin. (MPa) RMmax. (MPa) Poisson Coef. (MPa)
Wearing course 1500 3500 0,30
Base 150 400 0,35
Subbase 150 350 0,35
Sublayer 50 150 0,40
After providing the data, the program performs several iterations with the %ield-obtained basins in order to %it with any of the theoretical structure basins previously calculated in the program database that already have their respective RM.
It was not the objective of this paper to %ine-tune the FWD %ield-measured basins and the program-calculated theoretical basins in order to minimize the error between the measured and calculated de%lection values. With the Retroanalysis, it was only attempted to obtain the set of RM values corresponding to each theoretical basin provided. Therefore, the theoretical basins and their respective RM were taken as input and output data, respectively, for the implemented RNA training. The theoretical basins were considered as real basins of pavement surface de%lec-tions and the corresponding RM were also considered as the reference pavement RM. These reference values, therefore, were compared with the RM values analyzed by the RNA in the training phase.
For the implementation of the ANNs, the MATLAB software was used. There are two ways to build ANN in MATLAB, one is by writing the algorithm code using the ANN toolboxes inserted into the program. The other way is to use the NNtool tool, which is an easy-to-use user-friendly graphical interface, where the user is provided with the desired input and output data for neural network training, the choice of training algorithm, the activation function, the number of neu-rons in each layer, training parameters and stopping criteria.
Four arti%icial neural networks were created for the wearing course, base, base and sub-layer sub-layers to predict, from the inputs provided, the respective RM. The characteristics of each of the implemented networks are shown in Table 3.
Table 3 – Characteristics of implemented RNAs
CARACTERÍSTICA WEARING COURSE BASE SUB-BASE SUBLAYER
ARCHITECTURE MLP MLP MLP MLP
No. INTERMEDIATE LAYERS 2 2 2 2
Nº 1st LAYERS NEURONS 18 15 20 10
Nº 2nd LAYERS NEURONS 9 10 16 5
TRAINING ALGORITHM LM LM LM LM
1st LAYER ACTIVATION FUNCTION TANSIG TANSIG TANSIG TANSIG 2nd LAYER ACTIVATION FUNCTION TANSIG TANSIG TANSIG TANSIG EXIT LAYER ACTIVATION FUNCTION TANSIG TANSIG TANSIG TANSIG
STOPPING CRITERION MSE MSE MSE MSE
EPOCH NUMBER 10.000 10.000 10.000 10.000
The set samples division for subsets training, validation, and test was randomized. From the total of samples, 70% were used for the training phase, 15% for the validation phase and 15% for the test phase. The weights of the ANN-adjusted neurons in the training phase were vali-dated and tested using their respective sample sets, different from those used in training. The predicted values (calculated modules) by the ANN were compared with the reference RM
obtained in the Retroanalysis. Finally, the percentage error between the predicted and the ref-erence RM, the mean square error, the regression lines and the correlation between these values were obtained.
5. RESULTS
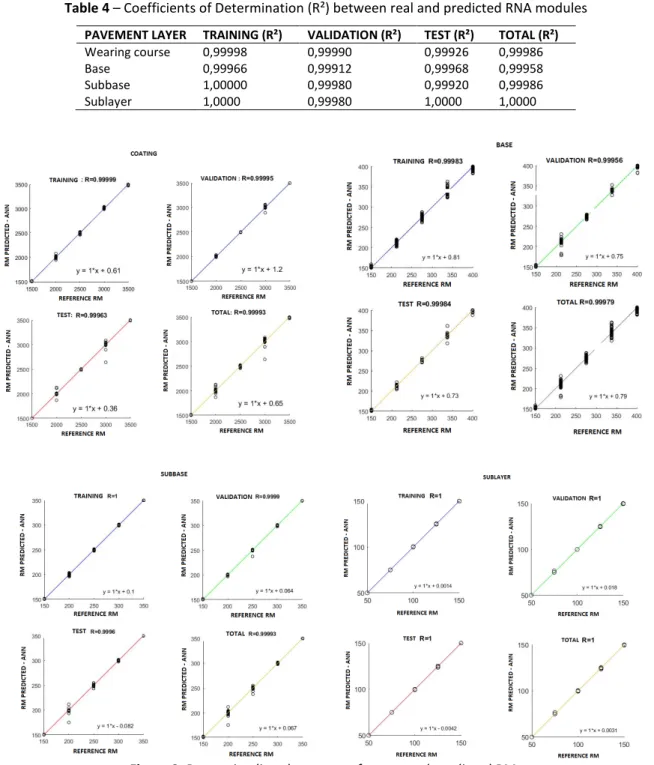
Before presenting the numerical results of the pavement RM analyzed by the ANN, Table 4 and Figure 2 present the statistical results of the considered three-layer pavement. They also pre-sent the coef%icients of determination (R²) and the regression lines relating the reference and predicted RM by the ANNs for each of the training, validation and testing phases, as well as for the total sample set.
Table 4 – Coefficients of Determination (R²) between real and predicted RNA modules
PAVEMENT LAYER TRAINING (R²) VALIDATION (R²) TEST (R²) TOTAL (R²)
Wearing course 0,99998 0,99990 0,99926 0,99986 Base 0,99966 0,99912 0,99968 0,99958 Subbase 1,00000 0,99980 0,99920 0,99986 Sublayer 1,0000 0,99980 1,0000 1,0000
Wearing course
Base
Sub-base
Sub-grade
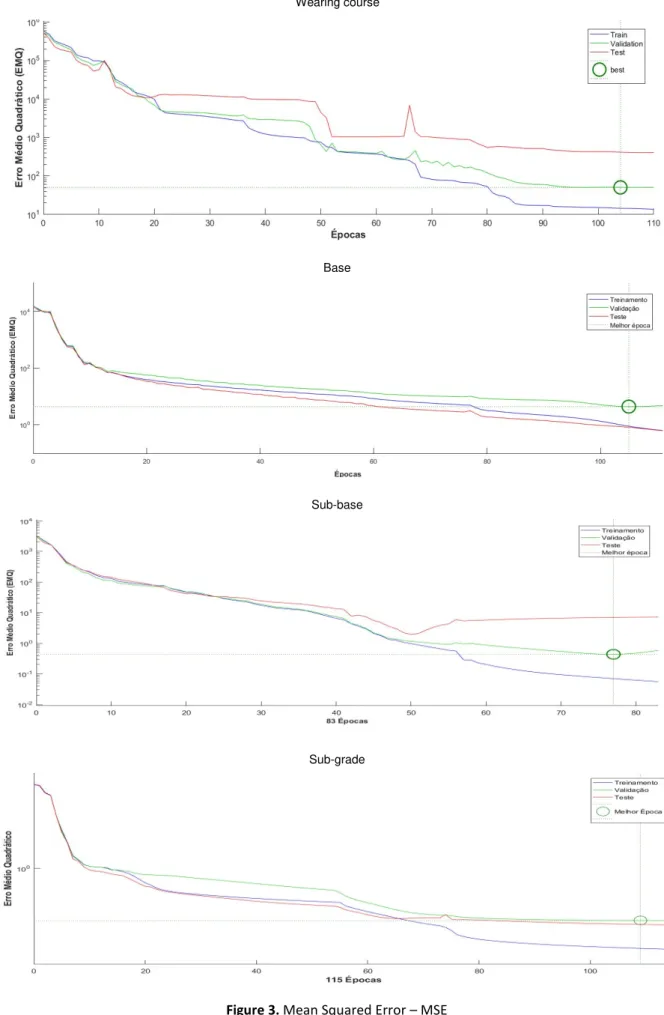
Figure 2 shows the strong linear relationship between reference and predicted RM. The co-ef%icients of determination (R²) in the order of 0.999 to 1.000 between the reference and pre-dicted RM for the constituent pavement layers, in all phases (training, validation and tests), con-%irm the prediction capacity of the implemented ANN. Figure 3 shows the performance of the networks (Mean Squared Error – MSE) between the reference and predicted values in the training, validation and testing phases for all pavement layers.
Analyzing the graphs in Figure 3, one can observe that the stopping criterion of the training algorithm was exactly the times when the validation phase MSE began to increase compared to the training phase MSE, in order to avoid the Over itting phenomenon of the synaptic weights.
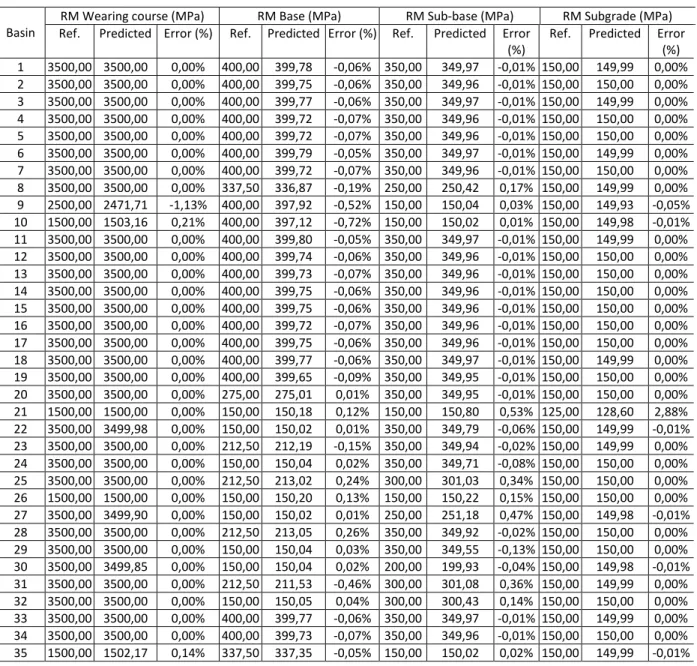
The MSE corresponding to the observed downtime were considered acceptable, since, ac-cording to Table 5, which shows the results of basins 1 to 35, the numerical values of the pre-dicted RM were practically equal to the values of the reference modules. Percentage errors in more than 93% of cases were less than 1% when comparing the reference and predicted RM.
Table 5 – Reference and Predicted RM values by ANN
Basin
RM Wearing course (MPa) RM Base (MPa) RM Sub-base (MPa) RM Subgrade (MPa) Ref. Predicted Error (%) Ref. Predicted Error (%) Ref. Predicted Error
(%)
Ref. Predicted Error (%) 1 3500,00 3500,00 0,00% 400,00 399,78 -0,06% 350,00 349,97 -0,01% 150,00 149,99 0,00% 2 3500,00 3500,00 0,00% 400,00 399,75 -0,06% 350,00 349,96 -0,01% 150,00 150,00 0,00% 3 3500,00 3500,00 0,00% 400,00 399,77 -0,06% 350,00 349,97 -0,01% 150,00 149,99 0,00% 4 3500,00 3500,00 0,00% 400,00 399,72 -0,07% 350,00 349,96 -0,01% 150,00 150,00 0,00% 5 3500,00 3500,00 0,00% 400,00 399,72 -0,07% 350,00 349,96 -0,01% 150,00 150,00 0,00% 6 3500,00 3500,00 0,00% 400,00 399,79 -0,05% 350,00 349,97 -0,01% 150,00 149,99 0,00% 7 3500,00 3500,00 0,00% 400,00 399,72 -0,07% 350,00 349,96 -0,01% 150,00 150,00 0,00% 8 3500,00 3500,00 0,00% 337,50 336,87 -0,19% 250,00 250,42 0,17% 150,00 149,99 0,00% 9 2500,00 2471,71 -1,13% 400,00 397,92 -0,52% 150,00 150,04 0,03% 150,00 149,93 -0,05% 10 1500,00 1503,16 0,21% 400,00 397,12 -0,72% 150,00 150,02 0,01% 150,00 149,98 -0,01% 11 3500,00 3500,00 0,00% 400,00 399,80 -0,05% 350,00 349,97 -0,01% 150,00 149,99 0,00% 12 3500,00 3500,00 0,00% 400,00 399,74 -0,06% 350,00 349,96 -0,01% 150,00 150,00 0,00% 13 3500,00 3500,00 0,00% 400,00 399,73 -0,07% 350,00 349,96 -0,01% 150,00 150,00 0,00% 14 3500,00 3500,00 0,00% 400,00 399,75 -0,06% 350,00 349,96 -0,01% 150,00 150,00 0,00% 15 3500,00 3500,00 0,00% 400,00 399,75 -0,06% 350,00 349,96 -0,01% 150,00 150,00 0,00% 16 3500,00 3500,00 0,00% 400,00 399,72 -0,07% 350,00 349,96 -0,01% 150,00 150,00 0,00% 17 3500,00 3500,00 0,00% 400,00 399,75 -0,06% 350,00 349,96 -0,01% 150,00 150,00 0,00% 18 3500,00 3500,00 0,00% 400,00 399,77 -0,06% 350,00 349,97 -0,01% 150,00 149,99 0,00% 19 3500,00 3500,00 0,00% 400,00 399,65 -0,09% 350,00 349,95 -0,01% 150,00 150,00 0,00% 20 3500,00 3500,00 0,00% 275,00 275,01 0,01% 350,00 349,95 -0,01% 150,00 150,00 0,00% 21 1500,00 1500,00 0,00% 150,00 150,18 0,12% 150,00 150,80 0,53% 125,00 128,60 2,88% 22 3500,00 3499,98 0,00% 150,00 150,02 0,01% 350,00 349,79 -0,06% 150,00 149,99 -0,01% 23 3500,00 3500,00 0,00% 212,50 212,19 -0,15% 350,00 349,94 -0,02% 150,00 149,99 0,00% 24 3500,00 3500,00 0,00% 150,00 150,04 0,02% 350,00 349,71 -0,08% 150,00 150,00 0,00% 25 3500,00 3500,00 0,00% 212,50 213,02 0,24% 300,00 301,03 0,34% 150,00 150,00 0,00% 26 1500,00 1500,00 0,00% 150,00 150,20 0,13% 150,00 150,22 0,15% 150,00 150,00 0,00% 27 3500,00 3499,90 0,00% 150,00 150,02 0,01% 250,00 251,18 0,47% 150,00 149,98 -0,01% 28 3500,00 3500,00 0,00% 212,50 213,05 0,26% 350,00 349,92 -0,02% 150,00 150,00 0,00% 29 3500,00 3500,00 0,00% 150,00 150,04 0,03% 350,00 349,55 -0,13% 150,00 150,00 0,00% 30 3500,00 3499,85 0,00% 150,00 150,04 0,02% 200,00 199,93 -0,04% 150,00 149,98 -0,01% 31 3500,00 3500,00 0,00% 212,50 211,53 -0,46% 300,00 301,08 0,36% 150,00 149,99 0,00% 32 3500,00 3500,00 0,00% 150,00 150,05 0,04% 300,00 300,43 0,14% 150,00 150,00 0,00% 33 3500,00 3500,00 0,00% 400,00 399,77 -0,06% 350,00 349,97 -0,01% 150,00 149,99 0,00% 34 3500,00 3500,00 0,00% 400,00 399,73 -0,07% 350,00 349,96 -0,01% 150,00 150,00 0,00% 35 1500,00 1502,17 0,14% 337,50 337,35 -0,05% 150,00 150,02 0,02% 150,00 149,99 -0,01%
An effective prediction of the retroanalyzed RM by the basins of de%lections and thicknesses of the studied pavement layers is also due to the treatment, quantity and quality of these data. The thicknesses of the wearing course, base and sub-base layers were the actual thicknesses performed during the highway implementation, obtained from the executive project. According to Albernaz (1997), the %inal RM of the structure is highly in%luenced by the thickness of its layers, because if the thickness adopted for a layer is smaller than the actual thickness, the ret-roanalyzed RM may be signi%icantly larger than the correct layer RM to compensate the value of the equivalent stiffness (RM and thickness function) of the layer. The opposite would happen if the thickness adopted were larger than the actual one.
The de%lection basins and the respective RMs of the set of samples used for ANN training proved to be consistent and adequate for adjusting the weights of the hidden layers of the ANN, since, applying them to the validation and testing set, they predicted satisfactorily the reference RM of the pavement layers of the analyzed highway. A possible presence of inconsistent thick-ness data, de%lection and RM could contribute to poor network performance in the training phase and, consequently, an unsatisfactory prediction of pavement layer RMs in subsequent phases.
It is important to emphasize the difference in the processing time veri%ied between the two retroanalysis methodologies. The traditional method, through the retroanalysis program, re-quired hours to retro analyze the RM of all 3,232 FWD %ield-measured de%lection basins. The ANN required seconds or a few minutes, at most, to perform all network training, which used 70% of the 3,232 raised de%lection basins, i.e., 2,262 basins.
6. CONCLUSION
The responses of Arti%icial Neural Networks (ANN) against the objective of predicting the Resil-ience Modules (RM) of paving materials from the de%lection basins and the thickness of their layers, proved their ef%icacy and applicability in the retroanalysis process. In addition to the processing time gain compared to traditional retroanalysis, stands out the power of generaliza-tion and predicgeneraliza-tion of ANN.
Generalization capacity was veri%ied by analyzing the results of the coef%icients of determi-nation (R² > 0.999) between the actual and predicted RM obtained for the test subset. Thus, it can be stated that the RM can be retroanalyzed for any structure using the weights adjusted in the training phase, if the maximum and minimum values of the RM of these structures are within the data/subset universe used in the training network.
Percentage errors of less than 1% in at least 93% of cases demonstrated the predictability of the implemented arti%icial neural networks. It is noteworthy that the good performance of the ANN, especially in the training phase, depends on the consistency, quantity and quality (mini-mum noise) of the available sample data set, because using a very small sample set, especially in the training phase, can compromise the proper adjustment of neuron weights during pro-cessing, which may impair the network's ability to learn. On the other hand, however, having a large amount of data, with a large number of inconsistencies, affects the quality of the network result.
In addition to the consistency, quality and quantity of samples available, the number of hid-den layers and the respective numbers of neurons in%luence neural network performance. Be-fore de%ining the %inal architecture of the networks implemented in this paper, several attempts were made to obtain satisfactory topologies, that is, the appropriate number of neurons and
layers to obtain a good %it. However, one cannot state that the chosen topology is the best of several possible combinations, as better or worse results can be obtained by trying to choose other combinations of number of neurons and hidden layers.
Along these lines, considering the results of this paper for the section under study, it can be stated that the applicability of ANN in the retroanalysis process proved to be very effective and ef%icient, depending on the predicted RM values and the observed processing time, in the hases of training, validation and testing during backanalysis.
REFERENCES
Albernaz, C. A. V. (1997) Simpli ied Method of Retro itting Flexible Pavement Resilience Modules from the De lection Basin. Mas-ter's Thesis, Coppe – The Alberto Luiz Coimbra Institute for Graduate Studies and Research in Engineering, Federal Uni-versity of Rio de Janeiro, Rio de Janeiro.
Albernaz, C. A. V.; L. M. G. Motta and J. Medina (1995) Retroanalysis: A Useful Tool in Structural Pavement Evaluation. Proceed-ings of the 29th Annual Paving Meeting. Cuiabá, v. 1, p. 399 - 417.
Bernucci, L. B.; L. M. G. Motta; J. A. P. Ceratti and J. B. Soares (2006) Asphalt Paving: basic training for engineers. 1st ed. Petro-bras: Abeda, Rio de Janeiro.
Coutinho Neto, B. (2000) Arti icial neural networks as a procedure for lexible pavement retroanalysis. Master's Thesis. São Carlos School of Engineering. University of Sao Paulo, Sao Carlos. Available in: <https://www.teses.usp.br/teses/dis-poniveis/18/18137/tde-01022018-122501/pt-br.php> (access in 23/12/2019).
Franco, F. A. C. P. (2007) Method of Mechanical-Empirical Dimensioning of Asphalt Pavements - SisPav. Doctoral Thesis. Coppe – The Alberto Luiz Coimbra Institute for Graduate Studies and Research in Engineering, Federal University of Rio de Janeiro, Rio de Janeiro. Available in: <http://www.coc.ufrj.br/pt/teses-de-doutorado/151-2007/1107-%ilipe-augusto-cinque-de-proenca-franco> (access in 23/12/2019).
Godoy, W. F.; I. N. Silva; W. S. Gongora; A. Goedtel and R. H. C. Palaces (2013) Failure Classi%ication in Three-Phase Induction Motor Bearings using Arti%icial Neural Networks. Proceedings of the XI Brazilian Symposium on Intelligent Automation, For-taleza. Available in: <http://www.sbai2013.ufc.br/pdfs/4788.pdf> (access in 23/12/2019).
Hagan, M.T. and M. B. Menhaj (1994) Training Feedforward Networks with the Marquardt Algorithm. IEEE Transactions on Neural Networks, v. 5, n. 6, p. 989 - 993. DOI: 10.1109/72.329697.
Haykin, S. (2001). Neural Networks: Principles and Practices. 2nd edition. Bookman, Porto Alegre.
Macedo, F. N. (2003) Retroanalysis of real and theoretical de lection basins obtained by static and dynamic methods. Master's Thesis. University of Brası́lia, Brası́lia, DF.
Nóbrega, E. S. (2003) Comparison Between Asphalt Pavement Retroanalysis Method. Master's Thesis. Coppe – The Alberto Luiz Coimbra Institute for Graduate Studies and Research in Engineering, Federal University of Rio de Janeiro, Rio de
Janeiro. Available in: <http://www.coc.ufrj.br/pt/dissertacoes-de-mestrado/103-msc-pt-2003/1835-eduardo-suassuna-nobrega> (access in 23/12/2019).
Ribeiro, A. J. A. (2016) A prediction model of resilient modulus of soils in the state of Ceará for the purpose of paving. Doctoral Dissertation, Federal University of Ceará, Fortaleza. Available in: <http://www.repositorio.ufc.br/handle/riufc/18958> (access in 23/12/2019).
Rocha Filho, N. R. and R. M. Rodrigues (1996) Structural Evaluation of Pavements through De%lectometric Surveys. Proceed-ings of the
30th Annual Paving Meeting. Salvador, v. 3, p. 1119 - 1146.
Rosenblatt, F. (1958). The Perceptron: A Probabilistic Model for Information Storage and Organization in the Brain. Physiologi-cal Reviews, v. 65 (3), p. 386-408. DOI: 10.1037/h0042519.
Silva, I. N.; D. H. Spatti and R. A. Flauzino (2010) Arti icial neural networks for engineering and applied sciences, Artliber, 1st edition, São Paulo, SP.
Zanetti, F. S. (2008) The Use of Arti icial Neural Networks as a Tool to Assist in Determining the Life of Flexible Pavements. Mas-ter's Thesis. São Carlos School of Engineering. University of São Paulo, São Carlos, SP. Available in: