Serhiy Moskovchuk
No42010Video Metadata Extraction in a VideoMail System
Dissertação para obtenção do Grau de Mestre em Engenharia Informática
Orientador : Doutor Nuno Manuel Robalo Correia, Prof. Catedrático, Faculdade de Ciências e Tecnologia da UNL - Departa-mento de Informática
Júri:
Presidente: Doutor Pedro Manuel Corrêa Calvente Barahona,
Prof. Catedrático, Faculdade de Ciências e Tecnologia da UNL Departamento de Informática
Arguente: Doutora Maria Teresa Caeiro Chambel, Profa Auxiliar, Faculdade de
Ciências, Universidade de Lisboa - Departamento de Informática
iii
Video Metadata Extraction in a VideoMail System
Copyright c Serhiy Moskovchuk, Faculdade de Ciências e Tecnologia, Universidade Nova de Lisboa
Acknowledgements
First of all I wish to express my sincere thanks to my advisor Dt. Nuno Manuel Robalo Correia, for providing me with all the necessary facilities for the research, scientific guid-ance, participation in the discussions, continuous support and of course his enormous patience.
I am also grateful to the Faculty of Science and Technology, New University of Lisbon and the WeWoW company for providing working conditions, required materials and facilities. Specially to WeWoW for the creation of this project and the team who supported me all the time.
In addition, a thank to my friends and colleagues André Grossinho, Pedro Santos, Rui Madeira, André Sabino, Flávio Martins, André Mourão, Bruno Cardoso, Ana Figueiras, Filipa Peleja and Inês Rodolfo for helping me during the work and for everything else.
Abstract
Currently the world swiftly adapts to visual communication. Online services like YouTube and Vine show that video is no longer the domain of broadcast television only. Video is used for different purposes like entertainment, information, education or com-munication.
The rapid growth of today’s video archives with sparsely available editorial data cre-ates a big problem of its retrieval. The humans see a video like a complex interplay of cognitive concepts. As a result there is a need to build a bridge between numeric values and semantic concepts. This establishes a connection that will facilitate videos’ retrieval by humans.
The critical aspect of this bridge is video annotation. The process could be done man-ually or automatically. Manual annotation is very tedious, subjective and expensive. Therefore automatic annotation is being actively studied.
In this thesis we focus on the multimedia content automatic annotation. Namely the use of analysis techniques for information retrieval allowing to automatically extract metadata from video in a videomail system. Furthermore the identification of text, peo-ple, actions, spaces, objects, including animals and plants.
Hence it will be possible to align multimedia content with the text presented in the email message and the creation of applications for semantic video database indexing and retrieving.
Resumo
Atualmente o mundo rapidamente adapta-se à comunicação visual. Serviços online como YouTube e Vine mostram que o vídeo já não é somente de domínio da TV. O ví-deo começou a ser usado para objetivos diferentes como o entretenimento, informação, educação ou comunicação.
O crescimento rápido dos arquivos de vídeo atuais com dados parciais oferecidos pelo editor cria o grande problema da sua obtenção. Os humanos olham o video como um conjunto complexo de conceitos cognitivos. O resultado disto é a necessidade de construir a ponte entre valores numéricos e conceitos semânticos. Isso estabelecerá uma ligação permitindo obtenção fácil dos mesmos.
O aspeto crítico desta ponte é anotação do video. O processo de anotação pode ser realizado manualmente ou automaticamente. A anotação manual é muita demorada, subjetiva e cara. Assim a anotação automática está a ser ativamente estudada.
Este trabalho foca-se em anotação automática dos conteúdos multimédia, especial-mente no uso das técnicas de análise para obtenção da informação possibilitando extrac-ção automática dos metadados do vídeo num sistema videomail. Foi assim realizada identificação do texto, pessoas, espaços e objetos.
Assim será possível alinhar o conteúdo multimedia com o texto presente na mensa-gem email e a criação das aplicações para indexação e acesso semântico à base de dados.
Contents
1 Introduction 1
1.1 Motivation . . . 2
1.2 Problem Description . . . 2
1.3 Realized Solution . . . 4
1.4 Main Contributions . . . 4
1.5 Document Organization . . . 5
2 Related Work 7 2.1 Video Annotation Systems . . . 8
2.1.1 The basics of the automatic annotation process . . . 8
2.1.2 AV Portal of the German National Library of Science and Technology 13 2.1.3 INHA Video Annotation Tool . . . 15
2.1.4 ViewProcFlow Annotation Tool . . . 15
2.2 Scene Text Detection and Recognition . . . 19
2.2.1 Text Localization Techniques . . . 20
2.2.2 Optical Character Recognition . . . 33
2.3 People Identification and Recognition . . . 39
2.4 Concepts and Object detection . . . 46
2.5 Action Identification and Recognition . . . 49
2.5.1 Single-layered Approaches . . . 49
2.5.2 Hierarchical Approaches . . . 51
2.5.3 Existing Methods . . . 52
3 Solution 55 3.1 Design . . . 56
3.1.1 Use cases. . . 56
3.1.2 VeedMee architecture . . . 58
3.1.3 VeedMind architecture . . . 60
xiv CONTENTS
3.3 Results . . . 71 3.3.1 Discussion . . . 71 3.3.2 Performance . . . 72
4 Conclusions and Future Work 75
List of Figures
1.1 Example of VeedMee’s user interface . . . 3
1.2 Diagram of VeedMee’s communication process workflow . . . 3
2.1 Image representation in computer vision . . . 7
2.2 Color features . . . 10
2.3 Visual features 1 . . . 10
2.4 Visual features 2 . . . 11
2.5 INHA-VAT Architecture . . . 16
2.6 VideoProcFlow Architecture . . . 18
2.7 C. Shi’s method workflow . . . 22
2.8 Flow chart of the [113] method . . . 24
2.9 MSER bounding boxes from three channels . . . 25
2.10 Q. Ye’s method workflow . . . 26
2.11 Neumann’s component tree . . . 27
2.12 Flow chart of the [22] SWT method . . . 28
2.13 Gradient Vector Flow examples . . . 29
2.14 Tesseract OCR baselines . . . 37
2.15 Tesseract spacing example . . . 38
2.16 Haar features . . . 40
2.17 Face detection process workflow . . . 40
2.18 Integral images examples . . . 46
2.19 SURF keypoints examples . . . 47
2.20 SURF descriptor . . . 48
2.21 Human action recognition approach-based taxonomy . . . 50
2.22 The classification accuracies of human action detection systems tested on the KTH dataset. . . 53
3.1 VeedMind use case diagram . . . 57
xvi LIST OF FIGURES
3.3 VeedMind component diagramm . . . 61
3.4 Face detection and normalization . . . 62
3.5 Text detection and normalization . . . 63
3.6 VeedMind workflow diagram . . . 65
3.7 Segmentation XML file . . . 68
List of Tables
2.1 Performance comparison of the C.Shi et al. method (%) . . . 21
2.2 Performance comparison of Q.Ye et al. 2005 method . . . 24
2.3 Performance comparison of the Q.Ye et al. 2014 method (%) . . . 26
2.4 Performance comparison of the SWT algorithm . . . 29
2.5 Performance comparison of the GVF algorithm . . . 30
2.6 Performance comparison of P. Shivakumara et al. method in (%) . . . 31
2.7 Test recognition accuracy on ICDAR 2003 character sets in (%) . . . 35
2.8 Word recognition rates of C. Shi et al. method . . . 36
3.1 Segmentation results of testing videos . . . 71
3.2 Concept detection results. . . 72
Listings
1
Introduction
Communication is the process of conveying information. It started with spoken word stories, evolved through cave paintings, carrier pigeons, morse code, telephone, email, instant messaging, social media and networking. The main reason of this evolution is a technological progress. Every innovation brings some changes or even new abilities to communication.
The telephone extended geographical limits of verbal communication, computers brought non-verbal communication into the digital era improving its temporal disad-vantages. Smartphones made the full spectrum of verbal and non-verbal communication and even visual. As a result technology has brought more communication options.
All these different communications need some channels to work. The Internet is one of these main channels and now it overpassed three billions of users [93]. It offers many services and one of them is an electronic mail system. Its appearance gave people a new way to communicate which was quickly accepted and became widely used. Mail systems grew to tremendous number of users and now it is being projected to 2.5 billion users [28]. Such number of users generates a huge amount of data and that is an increasing problem as people are more connected to email through the pervasiveness of smart phones and tablets, the ever-increasing availability of Internet connectivity, and the wider spread of social networking [73]. Email is present in all facets of daily life: personal (communi-cation with friends and family, manage bills and juggle between groups and activities) and work (communication between coworkers) and there is a need of understanding its behavior and deal with it [26].
1. INTRODUCTION 1.1. Motivation
the closest to be physically present, either in a meeting with your co-workers or loved ones [99].
VeedMee is an email system that uses video to communicate and this leads to the aim of our project: developing techniques for multimedia information search to offer a possibility of multimedia content alignment with the text presented in the email message.
1.1
Motivation
Today we observe a huge increase of mobile devices, capable to receive and transmit large amounts of data. The number of internet access points and the capability of the network is also increasing. The amount of internet traffic coming from non-computer devices is quite significant and is growing [73].
The system we are dealing with, videomail, has support on computers and smart-phones, so we must expect a huge amount of data to deal with, namely video. This results in a problem of overloading the user with it. The study made by Topkara et al [96] showed us that email messages including thumbnails drove significantly higher the click through rates and surveys show that users found thumbnail views more appealing and novel. Apart from this we can reach better results even, offering more information about video: who appears, where it is filmed, what objects are present. This information will help the user to better management of their videomails, allowing to select the most suit-able materials and finding them faster.
1.2
Problem Description
This work is integrated within the project VeedMind, in partnership with the company WeWoW, funded by QREN (Quadro de Referência Estratégico Nacional), with the aim of
de-veloping multimedia information search capabilities in the videomail system VeedMee. Like other standard email systems, VeedMee probably will suffer the same problems, namely email overload, that means receiving a large volume of incoming email and hav-ing emails of different status types (to do, to read, etc) [26]. In our case a large volume of incoming email is even more difficult, since we deal with text and multimedia data. The huge amount of incoming correspondence will complicate the user’s life, so it is crucial to offer the possibility of searching within the video content and align it with the email’s text content.
The VeedMee system is designed to be simple to learn and to use. Figure1.1shows the user interface that is very similar to other widely used email clients. The workflow of creating and sendingveedmeesis also quite simple. It is described in Figure1.2that shows
1. INTRODUCTION 1.2. Problem Description
Figure 1.1: Example of VeedMee’s user interface
1. INTRODUCTION 1.3. Realized Solution
1.3
Realized Solution
The realized solution consists in the use of techniques that automatically extract metadata from video, namely: the identification of text, people, spaces, objects.
Videos are stored in MP4 format, that is widely used and is supported by many de-vices. The system gets a video and analyzes it in the following order:
1. Segmentation - a process of detecting cuts. The video is transformed into a list of key-frames, each key-frame characterizes a part of video from what it is cut.
2. Face detection - the system checks a presence of human faces. If those are found it stores information about them.
3. Face recognition - having a list of frames where human faces are present, the system tries to recognize those faces.
4. Text detection - each key-frame is checked for a presence of text, if the text is found, it is registered in the system for future recognition.
5. Text recognition - the system recognizes previously detected text. The Tesseract OCR is employed for that.
6. Object detection - a feature descriptor is extracted from each key-frame. Then they are stored for future searching process.
7. Concept detection - the system has a set of previously trained concepts like: beach, car, airplane. Each key-frame is checked for a presence of those concepts.
Extracted metadata will be integrated with the VeedMee database, so it could be used in the future to offer users new functionalities like searching the video content, describe video before it is visualized and marketing.
1.4
Main Contributions
1. INTRODUCTION 1.5. Document Organization
1.5
Document Organization
In addition to this introductory chapter, the remainder of the document is organized as follows:
• Chapter 2:Related Work overview addressing the topics of:
– Video Annotation Systems (Section 2.1) Review of existing video annotation systems.
– Scene Text Detection and Recognition (Section 2.2)
Existing techniques of text detection and its recognition with OCR.
– People Identification and Recognition (Section 2.3)
Explains how people are detected and recognized by computer.
– Concepts and Object detection (Section 2.4)
Discusses concepts and object detection on images (video frames).
– Action Identification and Recognition (Section 2.5)
Discusses human actions/activities recognition techniques.
• Chapter 3:Solution, presentation of realized solution:
– Design (Section 3.1)
Explains the design of the realized solution.
– Implementation (Section 3.2)
Describes a solution implementation.
– Results (Section 3.3)
Discusses tests and results on the realized system.
• Chapter 4:Conclusions and Future Work:
– Conclusions (Section 4.1)
Presents final conclusions of this work.
– Future Work (Section 4.2)
2
Related Work
This dissertation focuses on multimedia material manipulation. As a result it is related to the area of Computer Vision. Authors of [39] defineComputer Visionby the transfor-mation of data from 2D/3D stills or videos into either a decision or a new representation, that is done for achieving some particular goal. In a machine vision system, a computer receives an array of numbers from the camera or from disk and this is the type of data that we deal with, Figure2.1. As a result our task becomes to turn this array of numbers into the perception we need.
2. RELATEDWORK 2.1. Video Annotation Systems
Hence the main focus of this chapter is to explain some concepts, present previously developed projects and studies relevant to this dissertation. It is divided into five sec-tions:
Video Annotation Systems
Review of existent video annotation systems, as well as, used techniques for multi-media metadata extraction.
Scene Text Detection and Recognition
Existing techniques and methods to detect text localization within a scene.
People Identification and Recognition
Review of face detection and recognition approaches, its classification, benefits and drawbacks.
Concepts and Object Detection
Fast review of the existing techniques for object and concept automatic detection.
Action Identification and Recognition
Classification and discussion of existing approaches and methods for action detec-tion in videos.
2.1
Video Annotation Systems
The rapid growth of today’s video archives with sparsely available editorial data de-mands some work to facilitate its retrieval. Facilities to access to the complete video documents are already implemented and work well, a good example of it is YouTube. However, a solution for retrieval of specific segments are still in a nascent stage.
To provide specific content retrieval, video should be semantically perceived by the computer. This process requires labeling (annotation), where specific frames of video are semantically marked with the presence of known semantic concepts. Two types of semantic annotation are wed: manual, human made and automatic (machine-driven) [92].
Instead of expensive and ambiguous manual annotation, we should process to the au-tomatic annotation tools. As a result an auau-tomatic metadata extraction becomes a crucial ingredient for semantic-level video browsing, search and navigation. Subsection below explains the basics of the automatic annotation process.
2.1.1 The basics of the automatic annotation process
2. RELATEDWORK 2.1. Video Annotation Systems
them compare successive frames, filtering them with some static or dynamic threshold. Various techniques such as pixel-based, histogram, edge, motion and even mean and deviation intensities have been proposed. As a result the segmentation process yields a list of key-frames. In this context key-frames are the frames that represent a related sequence segment.
Then a concept-detection phase is employed. Essentially it is a machine learning problem. Given an n-dimensional feature vector xi of a key-framei, the aim is to
ob-tain a measure, which indicates whether semantic concept wj is present in shoti[92].
Basically there are three stages: feature extraction, concept learning and classification. This sequence of stages builds an actual bridge that solves a semantic gap problem, the lack of connection between digital data and semantic concepts.
The aim of feature extraction is to take an original key-frame and extract a descriptive representation of the pattern of interest, computing ann-dimensional feature vector. The
last one could be described using text, audio and visual features or their combination. In this thesis we focus only on visual features. These features have different illumination variations, different viewpoints. As a result a sensory gap arises, the gap between the object in the world and the information in a computational description derived from a scene [91]. Thus there is a need to find some type of invariance that will establish solid features, insensitive to changes caused by visual properties. C. Snoek and M. Worring consider visual features along two dimensions: their type (color, texture and shape) and their spatial scale on which they are computed (global, region, key-point and temporal extensions) [92]. Below we will discus some principles related with each one.
Color: Each frame originally is represented by an array of pixels, where each element
has a color. Color could be represented in various modes, the most known are: RGB, HSV, L*a*b* and Black and White. The first one, is a additive color model which combines Red, Green and Blue to represent the other colors. Generally in this model, a pixel is represented by three 8-bit numbers in a range of [0-255]. Figure 2.2(a)depicts it. The
HSVindicates how much certain wavelength is present. It has three components: Hue,
the dominant wavelength in the color spectrum,Saturation, an amount of white andValue
, an intensity of the color. Figure2.2(b)shows it. TheL*a*b*, Lab color space, is based on
the Opponent-Color Theory1and includes all perceivable colors. L*is similar to theVin
HSV, in other words: Lightness,a*andb*represent redness or greenness and yellowness
or blueness respectively [71]. Figure2.2(c)illustrates it.
Texture: Instead of color features, texture relies on a local groups of pixels and could
be defined as an organized pattern of quite regular sub-elements. It is a very useful fea-ture in detection of repetitive pattern concepts like: a brick wall, forest or zebra. There are statistical approaches [33] or more known methods like an application of Gabor fil-ters [34] and wavelet features [61]. The combination of texture and color properties can deliver good results in general concept detection, for example: indoor vs outdoor, beach,
1This theory assumes that the receptors in the human eye perceive color as pairs of opposites (Light vs
2. RELATEDWORK 2.1. Video Annotation Systems
(a) RGB (b) HSV (c) L*a*b*
Figure 2.2: Color features
forest. Figure2.3(b)shows an example of texture.
Shape: It is a set of connected pixels that share a specific property,V. Two pixels, p
andq, are connected if there is a path fromptoqof pixels with propertyV. A path is an ordered sequence of pixels such that any two adjacent pixels in the sequence are neigh-bors [78]. Figure2.3(a)depicts an example. Connected component could be characterized by moments, including an area, centroid or orientation of the region. These moments are related to computational geometry, the subarea of algorithms design that deals with the design and analysis of algorithms for geometric problems, threads this feature extraction and matching problems, a good review is made in [100]. These features are good, but they have some drawbacks due to their direct visual data dependence when changing a point of view or a scene extremal changes.
(a) Connected components (b) Texutre
Figure 2.3: Visual features 1
Global:These type of features works directly on a full frame and generally represented
2. RELATEDWORK 2.1. Video Annotation Systems
in Figure2.4(a).
Region: We can split a frame into regular partitions, called regions. This partitioning
process could use different combination of rectangles or even just one. J. Van et al. divide an image in overlapping regions which are uniformly sampled across the image, with a step size of half a region [98]. Example of regions could be seen in Figure2.4(b).
Key-point:This is a local type feature. A local feature is an image pattern which differs
from its immediate neighborhood [97]. Generally we work with them in a form of key-points: the information-rich pixels in the image. But they can be represented as edges, corners or junctions. A good study of local invariant feature detectors is made in [97] and [82]. Also there is a large study of a combination with codebooks [107], [13], [51]. Figure2.4(c)depicts an example.
(a) Histogram (b) Regions (c) Keypoints
Figure 2.4: Visual features 2
Temporal: Since we work with video data, that is an ordered sequence of frames, we
should consider it’s temporal properties. C. Snoek references some examples: analyzing motion pattern to find the camera motion, track regions or points of interest through the sequence and describe their tracks, derive general measures of the activity in the scene [92]. Another study for event detection and recognition for semantic annotation of video where temporal features play a big role is made by L. Ballan et al. [7].
There is a an ISO/IEC standard developed by Moving Pictures Expert Group for metadata representation: MPEG-7 [14]. MPEG Group aims to define a standard for set of descriptors that could be used to describe various types of multimedia information. MPEG-7 already contains a set of audio-visual descriptors, as well as, ways to define other descriptors, structures and relations between. J. Laaksonen et al. present a system for an image retrieval that uses the MPEG-7 features [44].
The next step after the feature extraction is classification. Classification will yield an existence or an absence of a concept. It is divided into two big phases: Training (Learn-ing) and Classification. As the name describes, the first phase will train a classifier for a semantic concept wj and a second indicates whether wj is present in shot i. Both,
training and classification, demand a feature extraction, computing of ann-dimensional
2. RELATEDWORK 2.1. Video Annotation Systems
Classifiers training methods have two main approaches: SupervisedanUnsupervised
learning. The first one is highly used in concept detection stages of semantic annotation systems that we are discussing here. Hence we will discuss it in more details. The main difference between these two approaches is a training data labeling. Supervised learning needs labeled data, it is marked as positive or negative examples (true or false). Unsu-pervised approaches receive a big amount of unlabeled data and then try to find clusters (groups) with similar features. This type of learning is very computationally expensive and demand much time to yield state of the art results [15]. Quoc V. Le et al. investigate the feasibility of building high-level features from only unlabeled data. Experimental results confirm that it is possible and show that the learned detector is invariant to trans-lation and even to out-of-plane rotation and scaling [46].
S. Kotsiantis et al. define that a goal of supervised learning is to build a concise model of the distribution of class labels in terms of predictor features. The resulting classifier is then used to assign class labels to the testing instances where the values of the pre-dictor feature are known, but the value of the class label is unknown [42]. Also S. Kot-siantis makes an overview of Supervised Machine Learning Classification Techniques in the same paper. In other words, the goal of supervised learning is to define a model, used by the classifier, which will indicate the learned label of unknown input concept basing on extracted features. In order to train a good classifier, training examples should be bal-anced as well as a number of used features [33]. The most known supervised learning machine in this area is a Support vector machine.
ASupport Vector Machine, SVM, is a learning method used for binary classification.
It aims to find a hyperplane which separates the d-dimensional data perfectly into its
two classes. Since the training data is often not linearly separable, SVM introduces a
notion of "kernel induced feature space" which transforms the data fromd-dimensional input vector into a (usually higher)d′-dimensional vector. Thus it is allocated in a higher
dimensional space, where it turns separable [11]. To improve classification of theSVM
classifier, we should provide a good parametrization. There are two parameters: Cand
K.Cindicates an optimization of a hyperplane of a machine whenC=∞, the algorithm tries to completely separate data, for a finite values, the problem reduces into finding a "soft-margin" classifier. The K,Kernel functionis a mapping function that indicates how to separate data into a higher dimensional space. Since each case is different, different parameters are needed. Thus, a standard way of selection is an iterative search on a large number parameters values selecting the best whose yielded better results.
2. RELATEDWORK 2.1. Video Annotation Systems
paradigm is a merge of the first two ones. It simultaneously models both the individ-ual concepts and their correlations in a unifying formulation. It is also proposed in pa-per [77]. Another way to improve video annotation is to merge metadata from different sources, for example speech transcript and the visual content, called multimodal fusion. S. Ayache et al. present in a study and comparison between three fusion schemes. The first merges collected features before classification, second, adds a normalization process which balances features weights, the last one, performs a fusion at a concept level, af-ter classification [6]. The study concluded that any fusion presented above perform in average better. Selection of the scheme depends of a nature of the concepts.
After a classification phase, video annotation systems enable a content retrieval which is the main propose. Thus, system should return the most relevant material queried by user. User can demand a different type of data (entire video, frame, temporal instant or tags) and a different type of querying it. Hence queries could be separated into types: query-by-keyword (searches an associated text around video, likeYouTube),
query-by-example (searches for similarities, like Google search by image) and query-by-concept (searches for identified concepts from classification phase). Querying mechanism could be very complex. It can combine results from different sources as well as interpret user query and transform it into another listing of words (text mining). At the end results are presented to the user. We do not discuss querying methods and user interface because this dissertation focuses only on extraction of semantic data from the video.
2.1.2 AV Portal of the German National Library of Science and Technology
This video annotation system was designed for an automatic annotation of scientific video material based on visual concepts. The need was created by the rapid growth of video archives and difficulties associated to its retrieval. A lack of tools to search for a specific visual concepts semantically was identified in studies during design stage of the AV Portal provided by German National Library of Science and Technology.
In 2013, the German National Library of Science and Technology holds approximately 2,000 hours of video data with an approximated growth of 1,000 hours every year [29]. This multimedia material is not indexed as standard textual data. Thus a major focus of this project was the exploitation of techniques for automatic indexing of the visual content depicted in video recordings. Thus it will be possible provide to user a semantic search and specific content retrieval.
As we mentioned before, the video archive is huge and includes multimedia material from a vast number of scientific areas. Thus, designers created categories and made a survey to find a specific visual categories interesting to the user in specific category. To-gether with subject experts and survey results subject-specific and cross-subject concepts were established. Also label names were aligned with labels provided by the German Authority FileGemeinsame Normdatei (GND)used for cataloging in library context.
2. RELATEDWORK 2.1. Video Annotation Systems
Each key-frames was selected and described by the subject expert in order to guarantee best quality of training data and concept mutual exclusion. The process started with a selection of 80 different videos per subject with varying time. As a result an average amount of 100 key frames per visual concept have been annotated. Obtained training data then feeds the Support Vector Machine classifier. Key-frames which depict a concept are labeled as positive, alternatively, negative are obtained by assembling all key frames of the respective subject that do not depict the concept.
The content-based classification stage begins with the segmentation, which is based on successive frames comparison on luminance histograms and edge energy features. The middle frame of each segment is selected as a key-frame. Feature extraction is char-acterized by the SIFT (Scale-Invariant-Feature-Transform, [57]) features at a fixed grid 6 x 6 pixels on each channel of a key frame in RGB color space. Thus, extraction yields a 384-dimensional feature vector at each grid point. Then a visual vocabulary, a Bag-of-Words representation of a key-frame, is computed via k-means clustering. k = 4,0000cluster were previously computed from a particular subject. By assigning each feature vector of a key-frame to its most similar cluster center, a normalized histogram (Bag-of-Words) of the key-frame is computed. This combination becomes invariant to visual distortions like rotation, occlusion, lighting and intra-class variation but rich enough to carry enough in-formation to be discriminative at the category level [18]. Computed Bag-of-Words is used as a feature vector of a key-frame used as input into classifier. In this system, a stan-dard Kernel-based Support Vector Machine is employed. Selected parameters of machine were a Gaussian kernel based on theχ2distance with aγ= average distance between all
training key-frames BoW-histograms. The classification task follows a one-against-all approach, with oneSVMper concept trained to solve a binary classification problem.
Accordingly to the context of the system, evaluation was done with the subject-specific testing data. Evaluation showed that not all cross-subjects concepts have an equal promi-nence for all subjects. The worst result, was seen in the concepts that had a small number of training samples which do not have sufficient visual difference. On the other hand, some high classification results should be doubted, there is a possibility of small vari-ance in comparison with a training data. Some concepts need more features to be distin-guishable. In general a big consideration yielded by evaluation was a big importance of dimensions of the training set and it’s quality as well.
2. RELATEDWORK 2.1. Video Annotation Systems
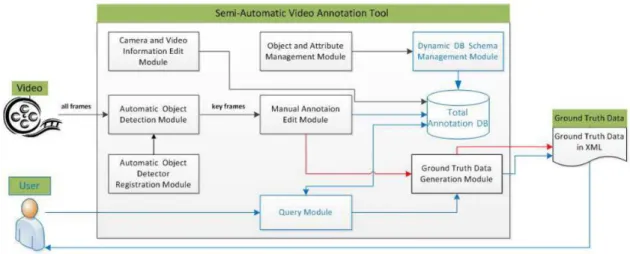
2.1.3 INHA Video Annotation Tool
The INHA-VAT video annotation system is defined as a user-friendly tool to annotate videos efficiently and accurately [40]. The main goal of the system is to turn possible a generation of a large amount of ground truth data. As seen before, the training data set is crucial for classification phases. It has a tremendous influence in the accuracy and precision of the classifier. The lack of qualified ground truth data may conduct to very poor classification results.
Manual annotation is very tedious, labor intensive and time consuming [106], [92], [64]. Hence there is a need of an automatic process. An automatic process is not always secure and may produce wrong results. Depending on the context, different requirements are needed. Thus there is a need to find a trade off between quality and time. INHA-VAT offers a semi-automatic annotation tool that support automatic annotation of the video and human annotators checking and validation.
The system is divided into various modules. The workflow begins with input of the standard video information like: camera info, recording purpose, location, date and so in Camera and Video Information Management Module. Objects and their attributes to be
annotated stay inObject and Attribute Management and Dynamic DB Schema Management Modules. The last one manages a Total Annotation DB which represents the dynamic
changeability of the annotation objects and their attributes. It can store various objects and their related attributes and offers an efficient search for specific frame, place and other attributes. The system support external object detection modules. These modules generate the initial annotation and should be registered inAutomatic Object Detector Reg-istration Moduleaccordingly to pre-defined interface. Then, a human annotator should verify the automatically annotated data. Manual Annotation Edit Moduleis designed for
it. Also the annotator can modify and add some annotations. The module offers specific tools to improve user productivity, like copying annotation data, moving ROI (Region of Interest) defining annotated objects and others. At the end, user can generate the ground truth data in XML format using aGround Truth Data Generation Module. Figure2.5depicts
an architecture of the system.
The system offers the best of two approaches: manual and automatic annotation. An automatic annotation module could be substituted or updated at any time. The user has friendly tools to manually verify and correct results as well as add new ones.
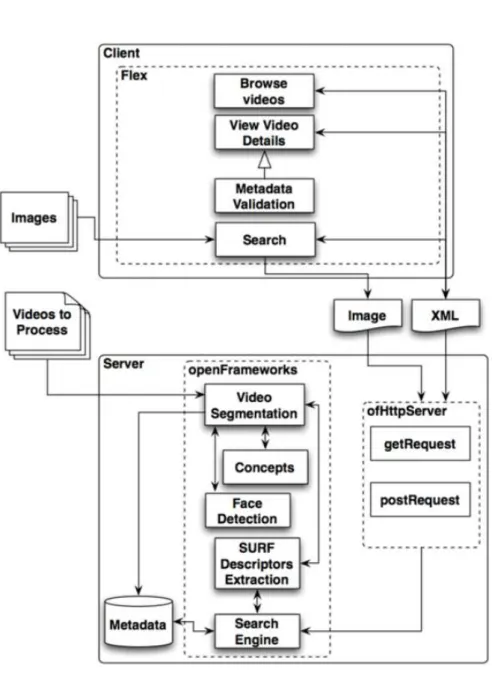
2.1.4 ViewProcFlow Annotation Tool
2. RELATEDWORK 2.1. Video Annotation Systems
Figure 2.5: INHA-VAT Architecture
introduction of the sound recognition into annotation process [64], [65].
The ViewProcFlow video annotation system was developed in cooperation with Du-video, a multimedia content production company. Thus the authors had a direct contact with the video production professionals as well as the real data what provides a good understanding of the problem. The system is divided into a Server-side application and a Web Client-side interface. The global architecture is shown in the Figure2.6.
Client
The client-side application is used to search, browse, visualize the video archive and metadata associated with it and includes mechanisms to validate the extracted content. Users can search and filter the obtained results. Search could be done by text or image. To improve search results, the user can specify the precision and desired area in the image search. The system offers the possibility of creating new classifiers. The user defines a new classifier by uploading new images or selecting existing ones. Since it is a web-application it is accessible from an internet browser with an internet connection.
Server
The main logic behind the server is supported by the openFrameworks library. The server waits for new videos to be processed and when the process starts it creates the XML-file with metadata related to the video. The metadata file contains infor-mation: title, status, date, duration, description, config and Thesaurus. Status reflects
if the video was validated by the user or not. Configdefines a threshold used in
segmentation and the number of frames jumped after a cut. Thesaurus contains EUROVOC2identifiers of detected concepts. Metadata extraction process relies on
separated components witch extract related features.
2EuroVoc is a multilingual, multidisciplinary thesaurus covering the activities of the EU, the European
2. RELATEDWORK 2.1. Video Annotation Systems
The segmentation, a process of division of the video into segments using a specific condition, is done with a simple difference of histograms [19]. Basically it is an absolute difference of the sum of each pixel from the extracted frames. If it is higher than a threshold we have a new cut what indicates a new key-frame.
Face detection is done with the algorithm presented in [37]. With previously trained classifier algorithms it allows objects on the image to be detected in a real time. It produces good results but misses occluded faces.
The system supports query-by-example queries. The mechanism behind it is char-acterized with a visual features, an image key-points that are invariant to scale and rotation with computed descriptor. This descriptor is used for matching purposes between images. The used technique was SURF [9] and SIFT [57] available in the OpenCV framework.
Then concept detection relies on two types of features: visual and audio. User can choose one of the two. Visual features are represented by Marginal HSV Color Moments and features obtained by applying a bank of Gabor Filters along with a Regularized Least Squares classifier [36]. Audio features are characterized by spectrograms and non-negative matrix factorization (NMF) which feeds a k-NN
classifier. Each sound sample is cut into 0.2 seconds intervals. Longer segments will overlap. If the concept is detected, its id is added to the XML file that describes a scene.
2. RELATEDWORK 2.1. Video Annotation Systems
2. RELATEDWORK 2.2. Scene Text Detection and Recognition
2.2
Scene Text Detection and Recognition
Text in videos is a rich and very important source of information for content-based re-trieval, since it is usually related with the video content. A majority of text extraction ap-proaches are designed for image documents but since video is a sequences of the images, methods could be adopted. As a result text extraction process from video documents presents more challenges over images such as low resolution, low contrast and distor-tion [119]. The text could be separated into two groups: Caption textandScene text[86].
Generally the first one is manually added into the scene overlaying it (e.g. subtitles, sports scores, etc). Scene textnaturally exists in the image and could be seen in different
conditions, orientations, sizes and fonts (e.g bill boards, sign boards on roads, addresses, businesses, etc). Since caption text is edited manually, it is easy to process and detect it while scene text is unpredictable, hence scene text detection is much more complex an challenging [89].
Therefore text recognition becomes a good font of information for automatic video an-notations. In combination with its temporal information it could offer even more event-related information. Since the context of this thesis is event-related to the video, we will focus on methods designed for extraction of the scene text.
D. S. Guru et al. [27] broadly classify text detection techniques in three categories: 1) Connected Component, 2) Gradient and Edge based and 3) Texture based, but many other scientists classify just into two: Region based, same as Texture based, Sliding win-dow, and Connected Component [105], [87], [112], [114]. Connected Componentmethods
often use color and region features to localize text components. Then these components are aggregated into candidate text regions for further processing. Region selection nor-mally is accompanied with heuristics in order to eliminate false positives. These ap-proaches have a weak performance in frames with small fonts and cluttered backgrounds due to its assumptions that text characters should have the same intensity values and ge-ometrical properties and text color bleeding. Recently the Maximally stable extremal re-gions - MSER method was developed and promise a good performance, but the problem of producing many false positives requires more study. The extraction phase is followed by grouping character candidates into text lines/paragraphs, additional filtering may be performed on top of groups. Gradient and Edge basedhas better results in detection but
produces more false positives. These approaches are based on the observation that gradi-ents of text pixels are higher than gradigradi-ents of non-text pixels. They are fast, efficient and accurate but constant and adaptive thresholds create problems of false positives specially in complex backgrounds.Region basedmethods attempt to extract features in sliding
2. RELATEDWORK 2.2. Scene Text Detection and Recognition
classifiers. The image has to be processed in multiple scales. They have very high com-putation loads. In sum they are good in false positive elimination, but expect higher contrast for text than its background.
2.2.1 Text Localization Techniques
In this section we will describe three types of text localization techniques.
2.2.1.1 Connected Component
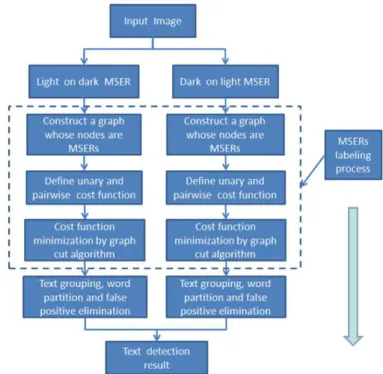
C. Shi et al. proposd scene text detection approach using graph model built upon Max-imally Stable Extremal Regions (MSERs) [87]. This model was introduced in 2002 by J. Matas et al. It is a new type of image elements useful in wide-baseline matching: Maxi-mally Stable Extremal Regions. These regions are defined solely by an extremal property of the intensity function in the region and on its outer boundary [63]. Detection of MSER is also related to thresholding and every extremal region is a connected component of a thresholded image. Maximally Stable Extremal Regions are the core of the proposed approach of C. Shi. Due to it’s robustness against view point, scale and lighting changes as well as text properties it was a natural selection. Furthermore MSERs computation is quite efficient:O(lognlogn). The flowchart of the algorithm is illustrated in Figure2.7.
At the start two kinds of MSERs are detected: light areas on dark and the dark areas on light background. To eliminate their mutual influence they are handled separately. At this stage, regions with too big or too small size are discarded as non-text. Besides this filtering, many false positive persist. Thus a next phase of labeling MSERs as text or non-text areas is employed.
As mentioned before, scene text presents a high degree of intraclass variation due to illumination conditions, fonts and distortions. Since classifiers approach is limited by a training set and heuristics by thresholds, C.Shi et al. explores a way to combine as much information as possible into one framework. The proposed framework start with a construction of undirected graph G = (V, E), where each MSER is a node and
the neighboring nodes are those ones that satisfy the distance between components and its size criteria. Each edge is assigned a nonnegative weight as the cost of cutting the edge. The cost function calculation is based on the unary and the pairwise cost of the neighborhood. The unary cost measures the individual penalties for labeling node as foreground or background. It focuses on the texture regularity, stroke width, occupation of the bounding box and Histogram of Oriented Gradients (HOG) [20]. The pairwise cost reflects the penalties for discontinuity between neighboring nodes. The main idea behind it is to explore the distance of color and geometric characteristics. As a result the target of the labeling problem is to find a segmentation that minimizes the cost function. To solve it, the max-flow/min-cut algorithm is used to optimize the cost function and get a binary image of the text.
2. RELATEDWORK 2.2. Scene Text Detection and Recognition
lines. Grouping is controlled by the rules: merge two adjacent or overlapping compo-nents if their distance, size and color are below threshold or if one area is contained in another area, keep the larger one. The process ends when no components could be merged. Final filtering is done with a weighted sum of the classification results of the sub-image scanned on the text image. Text blocks are normalized and a trained Random Forest classifier [12] with histograms of oriented gradients features [20] classifies the 24 x 24 pixels sub-images. The ICDAR 2011 training dataset was used as a ground truth [84].
The described approach was evaluated with the challenging ICDAR 2011 text local-ization competition dataset [84]. The dataset has 485 images containing text in a variety of colors and fonts on many different backgrounds and orientations, 255 of those are used for testing purposes. The ICDAR standard metrics was used. The output of algorithm is a set of rectangles designating bounding boxes for detected words, namedestimate. The
other set,targets, is a set of ground truth. Thus, the match, mp, between two rectangles
is defined as the area of intersection divided by the area of the minimum bounding box containing both rectangles. For each rectangle from the estimation set the closest match is found in the set of targets, and vice-versa. Hence, the best matchm(r; R) for rectanglerin
a set of rectanglesRis defined by:m(r; R) =max{mp(r; r0) | r0∈R}. Derived definitions
from it are the following, whereT andEare sets of targets and estimates:
• Precision=
P re∈E
m (re,T)) |E|
• Recall=
P rt∈T
m (rt,E)) |T|
• Standard f measure= α 1
P recision+ 1− α Recall
,αis a relative weight betweenP recisionand Recall, equal to0.5.
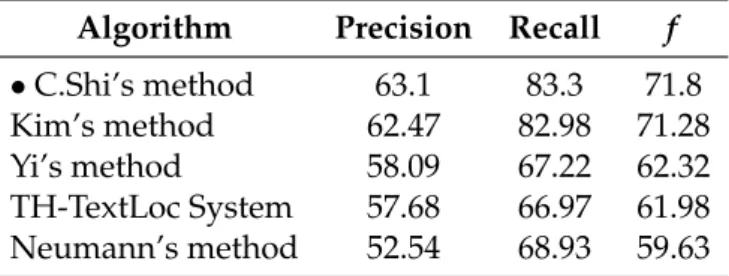
In order to evaluate the power of the proposed approach, various experiments with different combination of features were made. Results showed that even without MSERs labeling the results are quite good, ranked as the sixth place in the ICDAR 2011 compe-tition results, which proves suitability of MSER for text detection. Besides this, the ap-proach was compared with other ICDAR 2011 competition apap-proaches. Table2.1shows the results. This approach slightly outperforms the winner. Since ICDAR competition did not report the speed of participant methods, there is no possibility to directly compare the method in terms of computational load.
Table 2.1: Performance comparison of the C.Shi et al. method (%) Algorithm Precision Recall f
•C.Shi’s method 63.1 83.3 71.8
Kim’s method 62.47 82.98 71.28
Yi’s method 58.09 67.22 62.32
2. RELATEDWORK 2.2. Scene Text Detection and Recognition
Figure 2.7: C. Shi’s method workflow
In 2005, Q. Ye et al. published [113] a coarse-to-fine algorithm for text detection even under complex background. The given term, coarse-to-fine, appears due to the algo-rithm workflow. Firstly, it detects possible text candidates and then more sophisticated techniques analyze regions using more precise and computationally expensive features. The coarse detection phase serves to find all possible text lines in an image. It is divided in four steps:
1. Multi-scale wavelet decomposition
2. Candidate text pixels detection
3. Density-based region growing
4. Getting candidate text lines
In the first pass an image is decomposed by wavelet transformation, which gives us new representations with various depths and resolutions, as well as wavelet coefficients obtained by bandpass filtering 3 which contain the intensity variety information.
Can-didate text pixels detection takes an advantage of the dense intensity variety around the text pixels, thus the wavelet coefficients around the pixels should have large values. Here appears a new feature, called wavelet energy, that reflects the intensity variety around a pixel in a specific level. A pixel will be a candidate text pixel if its wavelet energy feature is larger than a dynamic threshold, which is calculated manually with experiments (value proved to be the minimum value that a text pixel can be perceived by a human from
2. RELATEDWORK 2.2. Scene Text Detection and Recognition
its background) or calculated by energy histogram to ensure that pixels from shadow areas will be detected as candidates. In the third pass, density-based region growing, text regions are formed from text pixels candidates. It defines a seed pixel (pixel with the percentage of candidate pixels in its neighborhood, 16x19 template, larger than the specific threshold), defines a label for it and collects unlabeled candidate pixels that are density-connected with a seed until the seed pixels are over. Then it labels each region as a text region and merges the other pixels with the background. To get text with different orientations, the template used in the neighborhood phase is rotated by 30 degrees six times for each seed pixel. This is the last pass of the coarse phase. Getting candidate text lines, separates text regions into text lines, using projection profile operation (vector of the sums of the pixel intensities over each column/row) [54]. Candidates with height smaller than 8 pixels or width/height < 1.0 are discarded as context.
Many textures with abrupt intensity variation, such as window curtains, leaves, could be classified as text regions resulting in false positives. Thus, a fine detection phase was developed to identify true text. This phase is composed by four passes: 1) Feature extrac-tion in suitable scale, 2) Feature selecextrac-tion, 3) Training and classificaextrac-tion and 4) Multi-scale (orientation) merging.
In the proposed algorithm, text is represented by a combination of four kinds of fea-tures, three of which are extracted in the wavelet domain and one in the gradient image. In the first pass wavelet features are extracted at the suitable scale (in the level where the candidate text lines are located) and gradients from original image. 225 features of differ-ent types could be exacted from the image. These features take advantage of frequencies behavior at various scales, intensities variances and spatial grey values distributions, his-tograms, correlations among adjacent pixels, crossing count histograms that reflects the distribution of the crossing counts of all scan lines and then coarsely reflect the periodic-ity of gradient projection maps. Feature selection serves to define a small set of the most powerful and relevant features that will be extracted. This is a very important pass be-cause of the fact that a large set of features will decrease the generality of a classifier and increase the time of extraction and classification. Testing showed that the best number of features is 41. The third pass, training and classification, uses a support vector machine due to its easiness, smaller training samples and better generalization ability. Multi-scale (orientation) merging merges text line that were detected in more than one orientation or scale. Selections are made by rating given from classification pass and properties of width overlapping. Figure2.8shows the workflow of the proposed algorithm.
Q. Ye et al. [113] use two test sets for experiments. One is their own and other is from Microsoft. The last one contains 44 images with a 400x328 resolution. The test sets consist of a variety of text samples in different fonts, sizes, colors, directions, languages and quality.
2. RELATEDWORK 2.2. Scene Text Detection and Recognition
Figure 2.8: Flow chart of the [113] method
method some metrics are calculated, namely:
• Recall rate- Number of correctly detected text / Number of text.
• False alarm rate- Number of falsely detected text / Number of detected text
• Speed- images / second
Results can be seen in the table below.
Table 2.2: Performance comparison of Q.Ye et al. 2005 method
Algorithm Recall rate (%) False alarm rate (%) Speed (images/s)
•[113] Algorithm 94.2 2.4 8.3
[53] Algorithm 91.4 5.6 1.5
[54] Algorithm 94.3 8.1 2.2
In 2014, Q.Ye & D. Doermann proposed a similar approach to detect and localize scene text. Like a previous one, it uses MSER based component extraction. In each channel (luminance, chrominance and gradient), the MSER algorithm yields components that are either darker or brighter than their surroundings. In order to get better contrast of the small text, a Gamma correction ofγ = 1.0was previously applied.
2. RELATEDWORK 2.2. Scene Text Detection and Recognition
(a) Luminance channel (b) Chrominance channel
(c) Gradient channel (d) Detected text objects
Figure 2.9: MSER bounding boxes from three channels
vector represents each sample. After this, samples are partitioned with aK-means
clus-tering algorithm in the HOG feature space. Samples that have an aspect ratio larger then 5.0 are discarded. Remaining samples along with negative group consequently are used to train the dictionary classifier that contains K linear SVMs for the multi-class train-ing. An one-against-all strategy is adopted. Since text could be divided into various segments, pairwise relations and holistic variance are analyzed to check isolated compo-nents. This analysis, component consensus feature extraction, includes color differences, spatial distances and alignment features. If a component is below previously defined thresholds, it is merged with the corresponding text. At the end, it yields the variance of color mean values of components. Merging two of described below processes, we obtain an integrated discriminative model. This model is based on the formula2.1.
F(X) =e F(X∪x) =e Wt· ψ(X)
φ(X,x)e !
−B (2.1)
ψ(X)denotes a response from the dictionary classifier andφ(X,x)e is the component con-sensus extraction response. Wtis a weight vector related to importance of each
dimen-sion andBis a threshold for text classification. Thexeis a component being considered for inclusion intoX. Finally the output ofF(X)e is a positive value meaning that component
is a text or negative if not.
2. RELATEDWORK 2.2. Scene Text Detection and Recognition
Since MSER generates a big number of components (hypotheses), authors decided to filter and merge them before the actual text detection process. Filters are based on some properties from component consensus features extraction, namely spatial distances and vertical overlap. Then the algorithm selects a random text hypothesis and tries to extend and test if it is a text (uses model formula2.1). When no hypothesis can be extended, text objects that overlap each other are merged and bounding boxes are yielded. The general work flow diagram is shown in Figure2.10.
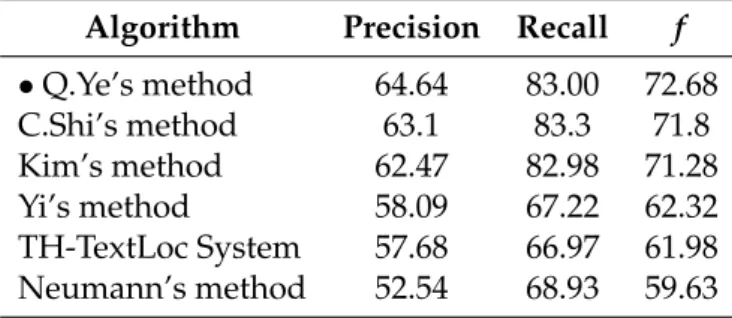
Evaluation was done with two different datasets: ICDAR 2011 [84] and Street View Text (SVT) [103]. The first one was previously described, the SVT dataset contains text objects from Google street video frames where most of the text object are captured at middle distances. The SVT dataset is not so popular as ICDAR, so we will not discuss results from it. The ICDAR 2011 comparison table is shown on the table below2.3. The computational cost of method on the Intel Core i5 CPU was near 0.45 and 1.6 images per second depending on the range of intensities of the MSER algorithm (∆).
Figure 2.10: Q. Ye’s method workflow
Table 2.3: Performance comparison of the Q.Ye et al. 2014 method (%) Algorithm Precision Recall f
•Q.Ye’s method 64.64 83.00 72.68
C.Shi’s method 63.1 83.3 71.8
Kim’s method 62.47 82.98 71.28
Yi’s method 58.09 67.22 62.32
TH-TextLoc System 57.68 66.97 61.98 Neumann’s method 52.54 68.93 59.63
In 2012 L. Neumann et al. [69] proposed a real-time scene text localization methods, that achieved state of the art on the ICDAR 2011 dataset [85]. The real-time performance is achieved by posing the character detection problem as an efficient sequential selection from the set of Extremal Regions (ERs)4.
The main idea of the algorithm is that the selection of suitable ERs is done by a se-quential classifier trained for character detection. It constructs a component tree of an
2. RELATEDWORK 2.2. Scene Text Detection and Recognition
image by thresholding, increasing the value step-by-step from 0 to 2555and linking
ob-tained connected components from successive levels in a hierarchy by their inclusion relation. Figure2.11shows an example component tree.
Figure 2.11: Neumann’s component tree
An experimental validation showed that up to 85.6% characters are detected as ERs in a single channel and that 94.8% characters are detected within a combination of all channels, hence the algorithm performs on different channels to increase the character localization recall.
In the first stage, ERs are described by area, bounding box, perimeter, Euler number and horizontal crossings which are used to estimate the class-conditional probabilityP.
This value is tracked using the inclusion relation of ER across all thresholds and only ERs which correspond to local maximum of the probability are selected. The classifier used at this stage is Real AdaBoost [48].
The second stage processes ERs that passed the first one. At this stage they are clas-sified into character and non-character classes using more informative and computation-ally expensive features such as hole area ratio, convex hull ratio and the number of outer boundary inflection points. Classification is done with SVM with the RBF Kernel using all previously calculated features and the new ones.
After ER filtering is done and characters candidates identified, they should be grouped in high-level text blocks (words, text lines). To realize it the algorithm proposed by Lluis Gomez and Dimosthenis Karatzas [24] was used. The algorithm consists in finding mean-ingful groups of regions using a perceptual organization based on clustering analysis.
2.2.1.2 Gradient and Edge Based
Algorithms in this category use gradient properties of the image to detect edges. Having a transformed image that contains only edges, distances between edges are computed and searched for some type of pattern. The best known one is the similarity of distances in neighbor pixels within a horizontal or vertical orientation.
In 2010, Epstein B. et al. proposed a definition of the new image operator called SWT [22]. Stroke Width Transform transforms image from color range into stroke widths, thus every pixel contains a value of distance to the corresponding pixel on the other side of the stroke (stroke width).
2. RELATEDWORK 2.2. Scene Text Detection and Recognition
The SWT Transformation produces an image of the same size as the original. The initial value of each element is set to∞and strokes are recovered by computing edges in the image using the Canny edge detector. The algorithm defines a gradient direction to each edge pixel and follows the defined ray until finding another edge pixel. The same direction is applied to the found pixel and if it is roughly opposite, each element of the path between two pixels is assigned to the width of the ray unless it already has a lower value. If an opposite pixel was not found or the direction was not opposite, the ray is discarded. Values situated in corner areas will not be true stroke widths, therefore the algorithm passes along each non-discarded ray again, computing the median SWT value and all pixels with value above median will be normalized to it.
The next step serves to find letter candidates. The proposed algorithm groups neigh-boring pixels using the classical Connected Component algorithm with changed associ-ation rule. In this case it is a predicate that compares the SWT values. This grouping method allows pixel with smoothly varying width to be grouped, thus regions with the text in more elaborated fonts and perspectives will be grouped. The algorithm is applied twice with different directions due to different gradients of the text (white on black or black on white). Now, with groups of connected components, the algorithm performs identification of text candidates. It computes the variance of the stroke width within each group and rejects the ones whose variance is too large. Another filters limit aspect ratio, diameter and median stroke width. At the last step, candidates that are too big or too small are discarded. Thresholds used in these steps were learned from the annotated training set, ICDAR 2003 [59]. The whole workflow of the algorithm could be seen in Figure2.12.
Figure 2.12: Flow chart of the [22] SWT method
To increase algorithm reliability, letters should be grouped into words. Text candi-dates are grouped by properties of text lines, namely stroke width, letters width and height, spaces between letters and words and their color. The process ends when no groups can be merged. Finally text is broken into separate words by heuristics of his-togram based on thresholds of intra-word and inter-word letter’s distances. The algo-rithm’s performance was assessed on a ICDAR 2003 [59] and ICDAR 2005 [58] competi-tion sets. Table2.7below shows results.
2. RELATEDWORK 2.2. Scene Text Detection and Recognition
Table 2.4: Performance comparison of the SWT algorithm Algorithm Precision Recall f Time (sec.)
•[22] Algorithm 0.73 0.60 0.66 0.94
Hinnerk Becker 0.62 0.67 0.62 14.4
Alex Chen 0.60 0.60 0.58 0.35
Ashida 0.55 0.46 0.50 8.7
Qiang Zhu 0.33 0.40 0.33 1.6
The process starts with GVF to detect local symmetries identifying characters candi-dates. Then it groups characters into text lines and removes false positives with a texture analysis.
Text candidate identification takes advantage of the symmetry properties of the text, namely: intra-characterandinter-character. The first symmetry is based on the inner and
outer contours of the same character, while the second is between the outer contour of the left and that of the character on the right. Accordingly to these symmetries text regions are extracted with the GVF, Figure2.13. The Gradient Vector Flow technique propagates the gradient information (the magnitude and direction) from nearby regions into homo-geneous regions. To compute the GVF field algorithm uses a minimizing function with the edge map of the input image. The most important property of the GVF field is that starting from any point, we can reach a nearby edge just by following the GVF directions. Thus the regions where two neighboring GVF arrows are opposite of each other indicate a presence of local symmetry points. T. Phan proposes conditions where vectors should be opposite and and the angle between should be greater thanπ/6. To find edges authors use the Sobel and the Canny edge map. The combination of two maps improves recall of the truly text candidates. The combination consists in the intersection of two edge maps with defined threshold, non-text symmetry components are removed.
(a) GVF field (b) Zoomed-in GVF field
Figure 2.13: Gradient Vector Flow examples
At this stage the remaining symmetry components are horizontally grouped. In each iteration a new group is created which contains the first unassignedSC(symmetry
com-ponent). The order is from top left to bottom right. If near current groups some unas-signed SC exists and it satisfies similarity constraints it is added into the groups and
2. RELATEDWORK 2.2. Scene Text Detection and Recognition
overlapping groups are merged and the union of two bounding boxes is yield.
Even though symmetry and grouping constraints, some background text-like pat-terns appear. Thus authors perform local texture analysis for text verification purposes. Texture analysis is done with the HOG features [20] and SVM. The training data set counts 11,600 positive and 14,100 negative samples. Each patch has a size of 48 x 48 and is divided into three vertical parts. The division is done because of ascender and descender text that have texture slightly different to the middle. Experiments showed that division of the patch improves false positive elimination. The classification phase normalizes each region to 48-pixel height then a window slides across. At each position SVM estimates the confidence score, then the overall score is computed by a weighted average follow-ing Gaussian distribution. If the score is non-negative, the region is considered as a text containing one.
Authors performed experiments on two public datasets: ICDAR 2013 [60] and Mi-crosoft Text Detection dataset (MS) [22]. The proposed approach was able to identify text even with the stylish fonts, blurring, partial occlusion and complex background. On the ICDAR 2005 (dataset from 2003) competition it outperformed an existing state-of-the-art methods in terms off-measure. In addition, experiments were done with and without
HOG-features and proved that the use of it improve the precision. Table below shows these results.
Table 2.5: Performance comparison of the GVF algorithm Algorithm Precision Recall f
•[76] Algorithm with HOG 0.70 0.69 0.69 •[76] Algorithm without HOG 0.63 0.69 0.66
[22] Algorithm 0.73 0.60 0.66
Alex Chen 0.60 0.60 0.58
As a conclusion and future work, technique shows a good performance and possibil-ity of use in general for objects, contour reconstruction and shape matching.
2.2.1.3 Texture Based
Texture based methods treat text as a special texture. They apply various transforms (such as Fast Fourier, DCT, Wavelet or Gabor filters) and classify text relying on its prop-erties extracted from these transformations.
P. Shivakumara et al. [90] proposed robust wavelet, statistical features and central moments based method with k-means clustering for detecting text in video images.
2. RELATEDWORK 2.2. Scene Text Detection and Recognition
mean, second-order and third-order central moments. These calculations are made on a sliding window for each sub-band image. Each sub-band image has 7 features and since authors use 3 sub-bands, we have 21 features extracted at all, that are normalized into the range from 0 to 1 and passed into feature vector for every pixel in the frame.
At the final phase, classification, the K-means algorithm is applied. It classifies previ-ously obtained feature vectors into two clusters: text and background candidates. The ar-eas of both are calculated and the one with the smallest is defined to be the text cluster. To discard small objects, morphological operations (opening and dilatation) are performed. Then average imageAV is calculated from horizontal, vertical, diagonal sub-band
im-ages and imim-ages from a morphological result. At the end of this phase we have text blocks detected in the form of boundary boxes.
Obtained results may contain some false positives, and that is why the algorithm per-forms some heuristics, based on height, width, and area of the text blocks. Some texture properties are used in the proposed heuristics too: Sobel and Canny edge components. Text blocks that do satisfy any of the proposed heuristics are marked as false positives, hence are eliminated.
To experiment with this method, the authors created their own set of variety of video images taken from movies, news clips and others. The total set was constructed by 101 images with 491 actual text blocks.
The experimental results of [90], show that the proposed method was better leader throw the competition in terms of detection rate, false positive rate and missed detection rate. Experiments were made even on non-text images, where the algorithm returned 32 false positives on 28 images out of 100. The metrics proposed by the paper were:
• DR- Detection Rate - Number of detected blocks that contains text fully or partially, truly detected (TDB) / Number of Actual Text Blocks (ATB) (manually calculated).
• FPR- False positive rate - Number of detected blocks that does not contain text, falsely detected (FDB) / Number of (TDB+FDB)
• MDR- Misdetection rate - Number of truly detected text blocks that miss some characters, (MDB)/ Number ofTDB.
Results could be seen on the table below.
Table 2.6: Performance comparison of P. Shivakumara et al. method in (%)
Method DR FPR MDR
•[90] Algorithm 96.7 4.2 5.6
[56] Edge based Algorithm 80.0 18.3 20.1 [109] Gradient based Algorithm 71.0 12.0 10.0


![Figure 2.8: Flow chart of the [113] method](https://thumb-eu.123doks.com/thumbv2/123dok_br/16530480.736286/44.892.263.584.138.446/figure-flow-chart-of-the-method.webp)

![Figure 2.12: Flow chart of the [22] SWT method](https://thumb-eu.123doks.com/thumbv2/123dok_br/16530480.736286/48.892.264.587.719.857/figure-flow-chart-swt-method.webp)
