UNIVERSIDADE DA BEIRA INTERIOR
Ciências da Saúde
Feasibility of Near Infrared Spectroscopy in
Stroke Patients
Daniel André Gonçalves Torres
Dissertação para obtenção do Grau de Mestre em
Medicina
2º ciclo de estudos
Orientador: Prof. Doutor Miguel Castelo Branco
Co-Orientador: Prof. Doutora Sara Nunes
Acknowledgements
I take this opportunity to acknowledge the people who helped me through the course of my thesis.
First, I express my sincere gratitude to Dr. Miguel Castelo Branco for thinking me capable, and providing me with the opportunity to work on this project. He has been a source of constant inspiration for me.
I would also like to thank Prof. Sara Nunes for helping me with all the statistical data management and giving me all the information and support that was required.
Especial thanks to Lígia Barbosa, my colleague and partner for helping me with the patient data retrieval, and for helping me to get through the daily adversities. I could not have done it without you.
To my sister, although we are apart I want you to know that you are always on my mind.
Finally, I would like to thank my parents who have been a constant support and inspiration at all times. Their love and encouragement gave me the strength I needed to accomplish my goals. Thank-You!
Feasibility of Near Infrared Spectroscopy in Stroke Patients
Resumo
Near Infrared Spectroscopy (NIRS) é uma forma não invasiva de medir em tempo real a perfusão cerebral. Devido ao seu rápido e recente desenvolvimento existem ainda poucos dados concretos acerca das suas áreas de aplicação. O Acidente Vascular Cerebral (AVC) é um evento de início súbito, de origem isquémica ou hemorrágica, que pode evoluir para rápida perda de funções neurológicas, deixando graves sequelas ou mesmo causando a morte do paciente. O atual diagnóstico de pacientes com AVC é clínico, sendo o diagnóstico definitivo imagiológico (TC/RM). Os objetivos do estudo são portanto:
1) Determinar se, utilizando a tecnologia NIRS, é possível detetar valores de hipóxia num hemisfério cerebral responsáveis pela clínica do AVC, comparativamente com o hemisfério saudável;
2) Determinar se durante o seguimento de pacientes com AVC agudo a utilização de NIRS contribui para a modificação da terapêutica;
3) Comparar o rSO2 cerebral obtido através da tecnologia NIRS e a SpO2 periférica
obtida com um oxímetro de pulso;
4) Medir os valores de “area under the curve” (AUC), utilizando uma baseline de 60
rSO2, pois valores abaixo deste estão associados a mau prognóstico;
5) Investigar a possibilidade de aplicação da tecnologia NIRS como nova forma de diagnóstico e seguimento de pacientes com AVC agudo em unidades de cuidados intensivos (UCI).
Palavras-chave
Acidente Vascular Cerebral, AVC, Near-Infrared Spectroscopy, NIRS, rSO2, SpO2, Oliguémia,
Hiperémia, Circulação vicariante, Oxímetro de pulso, Oxímetro regional, Oximetria em pacientes com AVC,
Summary
Introduction
Stroke is the main cause of death in Portugal. It is a severe pathology with a sudden onset and with a very high demand in both time and money from the families of the affected patients and from health organizations and social services. Inexpensive and practical diagnostic tools that will assist in early detection and treatment are the source of numerous studies.
The physiology behind a stroke is a sudden ischemic event in the brain. Near infrared spectroscopy (NIRS) is a non-invasive mean of measuring cerebral perfusion in real time. Due to its rapid and recent development few data exists about its applicability. Since NIRS detects oxygen levels that are supposedly low due to oligemia in infarcted areas, our study tried to ascertain the significance of NIRS measurements in stroke patients.
Objectives
-Determine which systemic factors influence rSO2values.
-Determine NIRS viability in diagnosing and monitoring stroke patients by comparing
their values with those of healthy individuals using the reference value of 60 rSO2.
-Determine if NIRS is capable of influencing therapeutical changes in those monitored.
Methodology
This is a prospective study where we used NIRS EQUANOX® technology with 4 sensors:
2 Frontal 2 supra-auricular to compare cerebral oxygen values of rSO2 in a control sample of
60 healthy persons from two retirement homes from the geographical area of Covilhã, Portugal and compared them with 128 stroke patients hospitalized in the Centro Hospitalar Cova da Beira (CHCB). We also collected data consisting of: risk factors, imagiological studies and vital signs. The hospitalized patients were monitored twice on the first day and then once daily during the following four consecutive days for a total of five days.
The results were analyzed using SPSS ® software - version 17 for Windows ® and were considered significant at p < 0.05. We resorted to the tests of independence Chi-square and Mann Whitney U to analyze the relationships between variables.
Results
Our study revealed that the hospitalized stroke patients had higher rSO2 values than
healthy individuals from retirement homes, and that these higher values decreased along the week they were hospitalized. We also found that the lesion side diagnosed by CT scan had
Feasibility of Near Infrared Spectroscopy in Stroke Patients
higher rSO2 values than the contralateral healthy side. We did not find any association
between: stroke risk factors and rSO2 readings, use of thrombolysis and rSO2 measurements,
the imagiological exams and rSO2readings (CT, TU and CU) and no association between age or
gender with rSO2levels.
Key words
Stroke, Near-Infrared Spectroscopy, NIRS, rSO2, SpO2, oligemia, hyperemia, vicarious
Abstract
Background: The physiology behind a stroke is a sudden ischemic event in the brain. Near
infrared spectroscopy (NIRS) is a non-invasive means of measuring cerebral perfusion in real time. Due to its rapid and recent development, hardly any data exists about its applicability. Since NIRS detects oxygen levels that are altered due to oligemia in infarcted areas; hence
the basis of our study. Methods and materials: We used NIRS NONIN Equanox sensors to
measure 128 stroke individuals from a stroke unit during a five-month period and compared
their readings with 60 healthy individuals from a retirement home.Results: Using 60 rSO2 as
reference values to diagnose a stroke, NIRS achieved a Sensibility of 54.22% and a specificity of 74.77%. No association was found between risk factors and rSO2 readings, but it correlated well with peripheral systemic oxygenation(SpO2) drops(p<0.05). Higher rSO2 readings(4 points) were found on the start of the hospitalization and then declined throughout the week
towards the levels of the control group.Conclusions: With our study we concluded that NIRS
technology does not allow ischemic stroke diagnosis. Nevertheless, we found that NIRS
detects higher rSO2 levels in those with acute strokes, probably detecting the acute
hyperemia that surrounds oligemic areas.
Keywords
Stroke; Near-Infrared Spectroscopy; NIRS; rSO2; SpO2; oligemia; hyperemia; vicarious
Feasibility of Near Infrared Spectroscopy in Stroke Patients
Index
ACKNOWLEDGEMENTS ... ii
RESUMO ... iii
PALAVRAS CHAVE ... iii
SUMMARY ... iv KEY WORDS... v ABSTRACT ... vi KEYWORDS ... vi LIST OF FIGURES ... ix LIST OF TABLES... xi
LIST OF ACRONYMS ...xiii
INTRODUCTION ... 1
Cerebral Vascular Accident ... 1
Definition ... 1
Epidemiology ... 1
Etiology... 2
Symptomatology ... 3
Diagnosis ... 3
Near Infrared Spectroscopy ... 4
History... 4
Mechanism ... 4
NIRS versus others oxymeters ... 4
NIRS Equanox technology ... 5
NIRS reference values ... 5
Fieldwork ... 6 METHODOLOGY ... 7 1. Study design ... 7 2. Population ... 7 3. Means of Investigation ... 7 4. Data Recovery... 8
5. Data statistical treatment ... 9
RESULTS ...10 Descriptive analysis ...10 Statistical inference...11 DISCUSSION...30 STUDY LIMITATIONS...35 FINAL CONSIDERATIONS ...36 FUTURE PROSPECTS ...36
BIBLIOGRAPHY ...37 ATTACHMENTS...41
Feasibility of Near Infrared Spectroscopy in Stroke Patients
List of Figures
Figure 1 – Graphic representation of INEM medical emergency dispatches for acute strokes in
Portugal throughout the years...2
Figure 2 – Image representing NIRS NONIN equanox technology ... 5
Figure 3 – Graphic representation of age in the stroke unit population ... 10
Figure 4 – Graphic representation of age in the control group. ... 10
Figure 5 – Graphic representation of gender distribution in the stroke unit population ... 11
Figure 6 – Graphic representation of gender distribution in the control group... 11
Figure 7 – Graphic representation of the prevalence of the major risk factors among the stroke unit population ... 12
Figure 8 – Graphic representation of the percentage of individuals from the stroke unit who had undergone thrombolysis ... 12
Figure 9 – Graphic representation of the arterial pressure variations along the week in stroke patients ... 13
Figure 10 – Graphic representation of the percentage of individuals of the stroke unit with their Glasgow result ... 13
Figure 11 – Graphic representation of the percentage of individuals of the stroke unit with their NIHSS results ... 14
Figure 12 – Graphic representation of the results of a CT scan divided by the brain area affected in the stroke unit population ... 14
Figure 13 – Graphic representation of the results of a TU exam divided by the brain area affected in the stroke unit population ... 15
Figure 14 – Graphic representation of the results of a CU exam divided by the brain area affected in the stroke unit population ... 15
Figure 15 – Graphic representation of the percentage of individuals of the stroke unit affected by leukoariosis and difuse bilateral Stenosis ... 16
Figure 16 – Graphic representation of the average rSO2 values at different times of the day ... 16
Figure 17 – Graphic representation of the percentage of individuals of the stroke unit with values higher and lower than 60 rSO2 ... 17
Figure 18 - Graphic representation of the percentage of individuals of the control group with values higher and lower than 60 rSO2 ... 17
Figure 19 – Graphic representation of the average rSO2values from the first measurement in the stroke patients distributed by age ... 18
Figure 20 – Graphic representation of the rSO2 values in stroke patients with and without Heart failure ... 20
Figure 21 – Graphic representation of the SpO2 values in stroke patients with and without Heart failure ... 20
Figure 22 – Graphic representation of the average rSO2 measurements in the stroke
unit patients along the week ... 23
Figure 23 – Graphic representation of right and left lesions on CT and their respective rSO2
levels... 24
Figure 24 – Graphic representation of the weekly variation in rSO2 levels and blood pressure
measurements ... 25
Figure 25 – Graphic representation of the rSO2 levels in those with blood pressure levels
higher and lower than 100 systolic and 50 diastolic in the stroke unit population ... 27
Figure 26 – Graphic representation of the rSO2and SpO2measurements along the week ... 27
Figure 27 – Graphic representation of the rSO2 levels in the stroke unit individuals with SpO2
Feasibility of Near Infrared Spectroscopy in Stroke Patients
List of Tabels
Table 1. Representation of NIRS specificity, sensitivity and positive and negative predictive
values, using 60 rSO2as reference ... 18
Table 2. Statistical inference between age and rSO2 measurements, done in the stroke unit
population ... 19 Table 3. Statistical inference between the age in the control group and the age of the stroke unit population ... 19
Table 4. Statistical inference between the relation of the rSO2 values in each gender in the
stroke unit population ... 19
Table 5. Statistical inference between rSO2 values and the different risk factors in the stroke
unit population ... 20
Table 6. Statistical inference of rSO2values in the stroke unit population between those who
underwent thrombolysis and those who did not ... 21
Table 7. Statistical inference of rSO2values in the stroke unit population between those who
had Leukoariosis and diffuse bilateral stenosis and those who did not suffer from these pathologies... 21
Table 8. Statistical inference of rSO2values in the stroke unit population between those who
had reported pathologies on CU and TU and those who did not ... 21
Table 9. Statistical inference of the rSO2levels and the different lesions sites reported on CT
CU and TU exams done in the stroke unit population ... 22
Table 10. Statistical inference between the Glasgow and NIHSS and the rSO2 levels in the
stroke unit population ... 22
Table 11. Statistical inference of the different average rSO2levels along the week ... 23
Table 12. Statistical inference of the different average rSO2levels between the control group
and the first measurement of the stroke patients ... 23
Table 13. Percentage of individuals with higher RSO2 levels on one side of the brain when
compared to the contralateral side in those with a right or left sided lesion detected by a CT scan ... 24
Table 14. Statistical inference between the difference in rSO2 values in right lesions detected
by CT ... 25
Table 15. Statistical inference between the difference in rSO2 values in left lesions detected
by CT ... 25
Table 16. Statistical inference between the rSO2 levels along the week and arterial pressure
measurements in the stroke unit population ... 26
Table 17. Statistical inference between the difference in rSO2 levels in those with blood
pressure levels higher and lower than 100 systolic and 50 diastolic in the stroke unit population... 27
Table 18. Statistical inference between rSO2 values and SpO2 values in the stroke unit
population along the week ... 28
Table 19. Statistical inference between the rSO2levels in the stroke unit individuals with SpO2
Feasibility of Near Infrared Spectroscopy in Stroke Patients
List of Acronyms
AUC Area Under the Curve
AVC Acidente Vascular Cerebral
CBC Complete Blood Count
CHCB Centro Hospitalar Cova da Beira
CT Computed Tomography
CTA Computed Tomography Angiography
CU Carotid Ultrasonography
CVA Cerebrovascular Accident
DM Diabetes Mellitus
DVT Deep Vein Thrombosis
ECG/EKG Electrocardiogram
Hb Deoxyhemoglobin
HbO2 Oxyhemoglobin
INEM Instituto Nacional de Emergência Médica
LF Left Frontal Sensor
LS Left Supra Auricular Sensor
MI Myocardial Infarction
MRI Magnetic Resonance Imaging
NIHSS National Institutes of Health Stroke Scale
NIRS Near Infrared Spectroscopy
PE Pulmonary Embolism
RF Right Frontal Sensor
RM Ressonância Magnética
RS Right Supra Auricular Sensor
rSO2 Regional Oxymetry
SpO2 Pulse Oxymetry
SPSS Social Sciences Statistical Package
TC Tomografia Computadorizada
TIA Transient Ischemic Attack
TU Transcraneal Ultrasonography
Introduction
Definition
The interruption of blood flow can cause cell death or cell lesion due to lack of oxygen and other nutrients and to excess of cellular metabolic waste.
Brain cells are especially susceptible since they, unlike other cells, do not have much regenerative capabilities. The resulting neurological lesion is called a cerebrovascular accident (CVA), or stroke. There are three types of strokes:
Ischemic stroke: a clot or other blockage within an artery leading to or within the
brain, by far the most common, accounting for 80% of all events.
Hemorrhagic stroke: has its origin in the rupture of one of the arteries supplying the
brain thereby releasing blood and compressing brain structures.
Subarachnoid hemorrhagic stroke: is also caused by the sudden rupture of an artery,
but here, the blood instead of being released inside the brain, fills the space surrounding it. If a person with typical symptomatology of an ischemic stroke has no symptoms after 24hrs, then the event is called a transient ischemic attack (TIA). This frequently precludes a major stroke in 35% of the cases, 50% of which occur within the first year. Prompt treatment and life changing behaviors are needed in order to obtain better results.(2)
Epidemiology
The annual incidence is declining due to more control with anti-hypertensive treatment and dyslipidemia. However, the overall rate of stroke remains high due to the aging of the population.
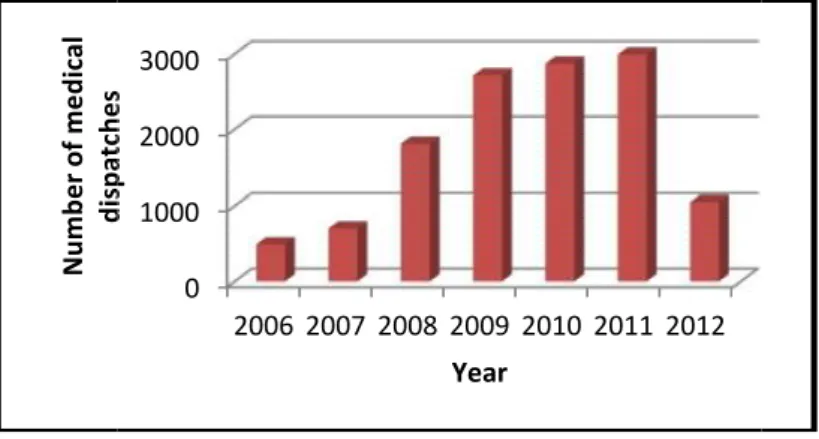
Although the global incidence of strokes is decreasing, Portugal still has the highest incidence in Europe. According to the Portuguese Stroke society, this pathology is the first cause of death in the country and according to charts from the National Institute of Medical Emergencies (INEM), the number of medical emergency dispatches to attend stroke victims has been on the increase since 2006. The year 2011 was the worst with 2995 cases (figure 1).
Feasibility of Near Infrared Spectroscopy in Stroke Patients
Figure 1. Graphic representation of INEM medical emergency dispatches for acute strokes in Portugal throughout the years(1).
Etiology
The most common problem is narrowing of the arteries caused by atherosclerosis and gradual cholesterol deposition. If the arteries become too narrow, blood clots may be formed. These blood clots can block the artery where they are formed – thrombosis, or they can be dislodged from the vascular wall and become trapped in another smaller artery – embolism (mainly from the heart).
These two phenomenon form the two etiologies of an ischemical Stroke. A thrombosis in-situ can be divided into small vessel thrombosis or large vessel thrombosis (carotid arteries). Small vessel thrombosis is also called a lacunar stroke.
Every area of the brain receives blood supply from specific arteries and it is very rare for stroke patients not to have their cerebral blood flow compromised. Stroke victims may have a rare predisposing condition such as; severe anemia, leukemia, policitemia and exposure to carbon-monoxide. The uncontrollable risk factors are: age 55 or older, gender, race, family history, previous stroke or TIA and Fibromuscular dysplasia. The major controllable risk factors are: high blood pressure, atrial fibrillation, obesity, high cholesterol, diabetes, atherosclerosis, cigarette smoking or exposure to secondary smoke, alcohol abuse, use of birth control pills or replacement hormone therapies, use of illicit drugs such as cocaine and methamphetamines, physical inactivity and cardiovascular disease (heart failure and abnormal heart rhythm).
Many studies have been done to find out what really happens to the brain area that suffered the stroke. It is obvious that this area is ischemic due to oligemia and will evolve into necrosis if circulation is not reestablished. The body’s response to this oligemic event is a compensatory hyperemia in the vicarious circulation. In 1981(3) by the use of cerebral angiography and by measurements of the regional cerebral blood flow it was first documented
N um be r o f m ed ic al di sp at ch es
Feasibility of Near Infrared Spectroscopy in Stroke Patients
Figure 1. Graphic representation of INEM medical emergency dispatches for acute strokes in Portugal throughout the years(1).
Etiology
The most common problem is narrowing of the arteries caused by atherosclerosis and gradual cholesterol deposition. If the arteries become too narrow, blood clots may be formed. These blood clots can block the artery where they are formed – thrombosis, or they can be dislodged from the vascular wall and become trapped in another smaller artery – embolism (mainly from the heart).
These two phenomenon form the two etiologies of an ischemical Stroke. A thrombosis in-situ can be divided into small vessel thrombosis or large vessel thrombosis (carotid arteries). Small vessel thrombosis is also called a lacunar stroke.
Every area of the brain receives blood supply from specific arteries and it is very rare for stroke patients not to have their cerebral blood flow compromised. Stroke victims may have a rare predisposing condition such as; severe anemia, leukemia, policitemia and exposure to carbon-monoxide. The uncontrollable risk factors are: age 55 or older, gender, race, family history, previous stroke or TIA and Fibromuscular dysplasia. The major controllable risk factors are: high blood pressure, atrial fibrillation, obesity, high cholesterol, diabetes, atherosclerosis, cigarette smoking or exposure to secondary smoke, alcohol abuse, use of birth control pills or replacement hormone therapies, use of illicit drugs such as cocaine and methamphetamines, physical inactivity and cardiovascular disease (heart failure and abnormal heart rhythm).
Many studies have been done to find out what really happens to the brain area that suffered the stroke. It is obvious that this area is ischemic due to oligemia and will evolve into necrosis if circulation is not reestablished. The body’s response to this oligemic event is a compensatory hyperemia in the vicarious circulation. In 1981(3) by the use of cerebral angiography and by measurements of the regional cerebral blood flow it was first documented
0 1000 2000 3000 2006 2007 2008 2009 2010 2011 2012 N um be r o f m ed ic al di sp at ch es Year
Feasibility of Near Infrared Spectroscopy in Stroke Patients
Figure 1. Graphic representation of INEM medical emergency dispatches for acute strokes in Portugal throughout the years(1).
Etiology
The most common problem is narrowing of the arteries caused by atherosclerosis and gradual cholesterol deposition. If the arteries become too narrow, blood clots may be formed. These blood clots can block the artery where they are formed – thrombosis, or they can be dislodged from the vascular wall and become trapped in another smaller artery – embolism (mainly from the heart).
These two phenomenon form the two etiologies of an ischemical Stroke. A thrombosis in-situ can be divided into small vessel thrombosis or large vessel thrombosis (carotid arteries). Small vessel thrombosis is also called a lacunar stroke.
Every area of the brain receives blood supply from specific arteries and it is very rare for stroke patients not to have their cerebral blood flow compromised. Stroke victims may have a rare predisposing condition such as; severe anemia, leukemia, policitemia and exposure to carbon-monoxide. The uncontrollable risk factors are: age 55 or older, gender, race, family history, previous stroke or TIA and Fibromuscular dysplasia. The major controllable risk factors are: high blood pressure, atrial fibrillation, obesity, high cholesterol, diabetes, atherosclerosis, cigarette smoking or exposure to secondary smoke, alcohol abuse, use of birth control pills or replacement hormone therapies, use of illicit drugs such as cocaine and methamphetamines, physical inactivity and cardiovascular disease (heart failure and abnormal heart rhythm).
Many studies have been done to find out what really happens to the brain area that suffered the stroke. It is obvious that this area is ischemic due to oligemia and will evolve into necrosis if circulation is not reestablished. The body’s response to this oligemic event is a compensatory hyperemia in the vicarious circulation. In 1981(3) by the use of cerebral angiography and by measurements of the regional cerebral blood flow it was first documented
that acute cerebral infarcts are associated with hyperemic areas; hyperemia being the vascular body’s response, which includes dilation and increased blood flow to a hypoxic area. It can be physiological due to physical stress or it can be pathological if it is in response to a disease like a stroke.
A stroke with hyperemic areas has their vascular reactivity impaired and is thought that treatment aimed at reducing blood flow in hyperemic areas might improve prognosis(3).
Symptomatology
The symptomatology depends on the type of stoke, and the size and location of the area affected. Symptoms are usually higher at the beginning and slowly recover through time, although in some cases the deficits are permanent.
At discharge from the hospital, usually 50 % of the initial symptoms have disappeared. The most common symptom of stroke is sudden weakness of the face, arm or leg, most often on one side of the body.
Other warning signs can include:
Sudden confusion, trouble speaking or understanding speech;
Sudden difficulty seeing in one or both eyes;
Sudden trouble walking, dizziness, loss of balance or coordination;
Sudden severe headache with no known cause.
Diagnosis
The gold standard for diagnosing a stroke is a CT scan. This exam quickly differentiates a hemorrhagic from an inchemical etiology. An MRI can also be conducted to assist in discerning the amount of damage to the brain, which will be beneficial in predicting recovery.
Other recommended tests are: Electrocardiogram (ECG, EKG), blood tests, such as a complete blood count (CBC), blood sugar, electrolytes, liver and kidney function, and prothrombin time. A carotid ultrasound(CU) scan and a computed tomographic angiography (CTA) can evaluate blood flow through the arteries, searching for plaques that may be in the origin of the stroke(4).
If it is suspected that the stroke may have been caused by a heart problem, then an echocardiogram or Holter monitoring or telemetry test may be done.
In the acute state some strokes may not demonstrate a pathological view in the computed tomography exam, this happens when a stroke is in the in the isodense state. This will later on become visible on the typical hyperdensity image on CT. An imagiological study that is thought to be in the isodense state should not delay prompt treatment (5).
Feasibility of Near Infrared Spectroscopy in Stroke Patients
Another result given by the CT scan is Leukoariosis, which is associated with benign aging "white matter disease", as well as strokes and dementia. The mechanisms by which leukoariosis impacts on clinical and cognitive functions are not yet fully understood and studies continue to try to give answers to these changes(6, 7).
There are various stroke scales that can play important roles in prognosis and treatment of stroke patients; such as the Glasgow scale and the National Institutes of Health Stroke Scale (NIHSS). The most commonly used is NIHSS(8). It has implications in whether or not a patient should undergo the main treatment strategy, Thrombolysis, which is the breakdown of blood clots by pharmacological means.
Near Infrared Spectroscopy
History
Initially described in the literature in 1939, Near-Infrared Spectroscopy (NIRS) was first applied to agricultural products in 1968 by Karl Norris and co-workers to help determine the quality of various products. Nowadays we’re using (NIRS) as a non-invasive technology that relies on the relative transparency of biological tissues to near infrared light (700-900 nm) to determine tissue oxygenation by using a modified Beer-Lambert Law.
Mechanism
By monitoring absorption at wavelengths where oxy- and deoxy- hemoglobin and cytochrome aa3 differ, it is possible to determine the concentrations of oxyhemoglobin, deoxyhemoglobin, total hemoglobin and oxy-deoxy cytochrome aa3. By calculus, we can
determine hemoglobin-O2saturation. For the brain, the light absorbing compounds are mainly
oxyhemoglobin (HbO2) and deoxyhemoglobin (Hb), and to a much lesser extent, water and
cytochrome aa3.
NIRS versus others oxymeters
Cerebral oximetry and NIRS are identical technologies, except that the former focuses
on the measurement of O2saturation whereas the latter focuses on the concentrations of
NIRS may also be applied to assess the oxygenation of other organs, such as extremity (muscle), liver, and kidney. In these situations, it is referred to as tissue oximetry or muscle oximetry.
When compared with pulse oximetry (SpO2), rSO2has potential advantages:
• Reflecting a predominately venous measure, rather than arterial only, to evaluate the balance between oxygen delivery and consumption
• Measuring oxygenation specific to the brain beneath the sensor (end-organ perfusion), as opposed to a global measure of oxygenation in the periphery as does
SpO2
• Eliminating the need for pulsatility and flow, as are required with SpO2
NIRS Equanox technology
The main difference from the recent NIRS equanox technologies and other devices is that equanox technology, by using tree different wave-lengths, can successfully negate the effects of three different biological barriers: skin, bone and Meningis (9, 10). This supposedly makes it far more useful in acquiring correct measurements than their predecessors.
Figure 2. Image representing NIRS NONIN equanox technology.
NIRS reference values
In previous studies (9) patients with SavO2 values bellow 60% had poorer outcomes.
Since Equanox sensor measures the same values as SavO2, values below 60% indicate that the
patient is already in a state of limited oxygen reserve, and the physician should consult other parameters immediately to avoid profound desaturation that might lead to cerebral injury. Until this date no studies directed at finding reference values for NIRS in stroke patients have been done.
Feasibility of Near Infrared Spectroscopy in Stroke Patients
Fieldwork
There are a lot of new studies emerging supporting the use of NIRS technology, in adults(11) in neonates(12, 13) and during a cardiovascular surgery(14); but the use of NIRS in stroke patients has few noteworthy works published.
In stroke individuals, little work has been done and much more is needed until NIRs is an established clinical practice tool. Of note, the work developed by Keller et al(15) with the use of indocyanine green at the bedside of stroke individuals and the work of Fabrizzio Vernieri et al(16) with the use of transcranial ultrasonography and nirs in stroke individuals, are good examples . Articles such as “Cerebral NIRS: How Far Away From a Routine Diagnostic
Tool?”(17), prompted this study whose main objective is to determine the applicability of
Methodology
1.Study design
We conducted a transversal/prospective study with descriptive and analytic components. Preference was given to quantitative analysis so that we could respond to the objectives of the study with valuable statistical information and with less bias.
2. Population
The sample is composed of individuals between the ages of 42 to 97 years residing in the area serviced by the CHCB hospital. We took measurements in the stroke unit during 5 consecutive months with a population size of 128 patients.
In order to participate in the study the patients had to have been admitted to the stroke unit with an ischemical stroke or TIA diagnosis.
Since there are no reference values from previous studies, we needed a control group that had the same age values and that never had a stroke or TIA. Our control sample consists of 60 healthy persons from two retirement homes in the area of Covilhã older than 56 years.
The reason that we have only taken samples from retirement homes is that many of our stroke unit patients come from these institutions and they have populations that are older than at any other locations where we could have performed NIRS measurements.
The participants in the control group had no history of stroke or TIA and were all in a retirement home.
3. Means of Investigation
We used Near Infra red spectroscopy using Nonin Model 7600 regional oximeter and 8000CA sensor with dual emitter and dual detector technology.
Two sensors for each individual were used, two at the frontal cortex comprising of the right and left forehead (RF and LF) and then the same two on each side on the temporal lobe above the ears so we could access a close measure of the middle cerebral artery (RS and LS).
Feasibility of Near Infrared Spectroscopy in Stroke Patients
The sensors were reused in different patients since the manufactors state that reutilization in different patients accounts for only 1% variability difference in the measurements taken(2).
4. Data Recovery
Data was collected from July to December 2011. Measurements of both rsO2and SPO2
were taken simultaneously. Two different readings were taken on the first day of admittance and then one reading daily for the next four consecutive days, for a total of six different sets
of rSO2 measurements. Each set of measurements consists of one set of readings of rSO2
values, one spo2 and one arterial pressure measurement. The rso2 values are comprised of
four different measures: 2 at the forehead (right and left (RF,LF)) and 2 above the temporal lobe (right and left(RS,LS)). Since we can only plug in two sensors at a time, we did the
frontal readings first followed by the temporal measurements. All rSO2 and SpO2 readings
were taken by the same two professionals. In all, we collected 3072 instant measurements of
rSO2 and 768 measurements of SpO2 and blood pressure. The two readings from the first day
were taken 8 to 12 hours apart. If there was a fluctuating value, three different measurements would then be taken, 10 seconds apart, in order to obtain a medial reading.
Nurses took the arterial pressure measurements and their values were acquired at the
computer stations. The values used never deviated more than 30 minutes from when the rso2
and SpO2readings were taken.
Standard monitoring included measurements with a 5-lead continuous
electrocardiograph, heart rate, peripheral oxygen saturation, and arterial pressure. The device used to acquire these measurements was the Datex-Ohmeda Patient Monitors. For our study and as part of our unit routine we also obtained the following information for each patient: gender, age, NIHSS and Glasgow scale results, transcranial ultrasound (TU) report, carotid ultrasonography (CU) report and a computed tomography (CT) report. We documented if a patient had experienced Fibrinolysis and if any of the following risk factors were present: dyslipidemia, atrial fibrillation, alcoholism, obesity, diabetes mellitus, if he is a smoker, if the patient is hypertensive and if he had a previous: stroke, heart failure, pulmonary thromboembolism, deep venous thrombosis or a acute myocardial infarction. For our study, we also searched the CT and CU reports to find the following pathologies: Diffuse bilateral stenosis and Leucakariosis.
5. Data statistical treatment
The obtained data was analyzed using both Microsoft Excel ® and software Statistical Package for Social Sciences® (SPSS - Windows version 17.0). At the start, we used a
descriptive analysis of absolute frequencies, median and mean (absolute and relative
frequencies, and standard deviation). We then tested the normality using Kolmogorov-Smirnov for sample higher than fifty (n > 50) and Shapiro-Wilk test for samples under fifty ( n < 50). If the sample followed a normal distribution we used the Chi-Square test, but since most of our results didn’t followed a normal distribution we used the Mann–Whitney–Wilcoxon non parametric test. The null hypothesis" was rejected when the p-value was less than the significance level α of 0.05.
Feasibility of Near Infrared Spectroscopy in Stroke Patients
Results
1. Descriptive analysis
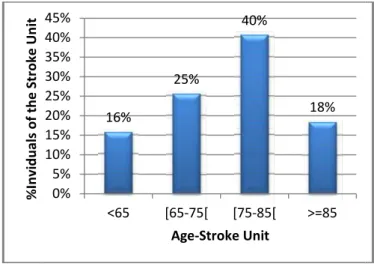
Figure 3. Graphic representation of age in the stroke unit population .
We studied 128 stroke patients during a five month period. The average age was 75 years, with 95% of the population being older than 50 years. In Figure 3, we can see that the most representative age groups are the ones between 65 to 85 years old, comprising 65% of the population.
Figure 4. Graphic representation of age in the control group.
Since we had the need for reference values we also conducted measurements on 60 healthy individuals from two retirement homes with an average age of 74 years. On figure 4 we can see that the most representative age classes are the ones between 65 to 85 years comprising 51% of the population.
0% 5% 10% 15% 20% 25% 30% 35% 40% 45% % In vi du al s of t he S tr ok e U ni t 0% 5% 10% 15% 20% 25% 30% 35% % In di vi du al s of t he C on tr ol G ro up
Feasibility of Near Infrared Spectroscopy in Stroke Patients
Results
1. Descriptive analysis
Figure 3. Graphic representation of age in the stroke unit population .
We studied 128 stroke patients during a five month period. The average age was 75 years, with 95% of the population being older than 50 years. In Figure 3, we can see that the most representative age groups are the ones between 65 to 85 years old, comprising 65% of the population.
Figure 4. Graphic representation of age in the control group.
Since we had the need for reference values we also conducted measurements on 60 healthy individuals from two retirement homes with an average age of 74 years. On figure 4 we can see that the most representative age classes are the ones between 65 to 85 years comprising 51% of the population.
16% 25% 40% 18% 0% 5% 10% 15% 20% 25% 30% 35% 40% 45% <65 [65-75[ [75-85[ >=85 Age-Stroke Unit 23% 30% 21% 18% 0% 5% 10% 15% 20% 25% 30% 35% <65 [65-75[ [75-85[ >=85 Age-Control Group
Feasibility of Near Infrared Spectroscopy in Stroke Patients
Results
1. Descriptive analysis
Figure 3. Graphic representation of age in the stroke unit population .
We studied 128 stroke patients during a five month period. The average age was 75 years, with 95% of the population being older than 50 years. In Figure 3, we can see that the most representative age groups are the ones between 65 to 85 years old, comprising 65% of the population.
Figure 4. Graphic representation of age in the control group.
Since we had the need for reference values we also conducted measurements on 60 healthy individuals from two retirement homes with an average age of 74 years. On figure 4 we can see that the most representative age classes are the ones between 65 to 85 years comprising 51% of the population.
Figure 5. Graphic representation of gender distribution in the stroke unit population
Figure 6. Graphic representation of gender distribution in the control group.
Figure 5 shows us that the gender distribution is similar for the stroke unit, but on the control group (figure 6), we have a female preponderance of 70%.
51% 49% Male Female 30% 70% Male Female
Figure 5. Graphic representation of gender distribution in the stroke unit population
Figure 6. Graphic representation of gender distribution in the control group.
Figure 5 shows us that the gender distribution is similar for the stroke unit, but on the control group (figure 6), we have a female preponderance of 70%.
Feasibility of Near Infrared Spectroscopy in Stroke Patients
Figure 7. Graphic representation of the prevalence of the makor risk factors among the stroke unit population.
Figure 7 depicts the percentage of individuals from the stroke unit affected by each risk factor. We can see that the most common risk between all individuals was hypertension with 69%. Diabetes, dyslipidemia, previous stroke/DVT/MI/PE and atrial fibrillation were present in one fifth of the population (23-28%). Heart failure was found in 15% of the individuals, 8% of the individuals smoked, and alcoholism and type 3 obesity were found on 5% of the individuals.
Figure 8. Graphic representation of the percentage of individuals from the stroke unit who had undergone thrombolysis.
Alcoholism Obesity Type III Smoke Heart Failure Atrial Fibrillation Previous Stroke/DVT/MI/PE Dyslipidemia Diabetes Mellitus Hypertension
Feasibility of Near Infrared Spectroscopy in Stroke Patients
Figure 7. Graphic representation of the prevalence of the makor risk factors among the stroke unit population.
Figure 7 depicts the percentage of individuals from the stroke unit affected by each risk factor. We can see that the most common risk between all individuals was hypertension with 69%. Diabetes, dyslipidemia, previous stroke/DVT/MI/PE and atrial fibrillation were present in one fifth of the population (23-28%). Heart failure was found in 15% of the individuals, 8% of the individuals smoked, and alcoholism and type 3 obesity were found on 5% of the individuals.
Figure 8. Graphic representation of the percentage of individuals from the stroke unit who had undergone thrombolysis.
5% 5% 8% 15% 23% 25% 27% 27% 0% 10% 20% 30% 40% 50% 60% Alcoholism Obesity Type III Smoke Heart Failure Atrial Fibrillation Previous Stroke/DVT/MI/PE Dyslipidemia Diabetes Mellitus Hypertension
%Individuals of the Stroke Unit
5%
95%
Thrombolysis
Feasibility of Near Infrared Spectroscopy in Stroke Patients
Figure 7. Graphic representation of the prevalence of the makor risk factors among the stroke unit population.
Figure 7 depicts the percentage of individuals from the stroke unit affected by each risk factor. We can see that the most common risk between all individuals was hypertension with 69%. Diabetes, dyslipidemia, previous stroke/DVT/MI/PE and atrial fibrillation were present in one fifth of the population (23-28%). Heart failure was found in 15% of the individuals, 8% of the individuals smoked, and alcoholism and type 3 obesity were found on 5% of the individuals.
Figure 8. Graphic representation of the percentage of individuals from the stroke unit who had undergone thrombolysis.
69%
60% 70% 80%
%Individuals of the Stroke Unit
As we can see from figure 8, only a 5% of our patients were submitted to Thrombolysis.
Figure 9. Graphic representation of the arterial pressure variations along the week in stroke patients.
Figure 9 depicts the blood pressure variations of stroke patients along the week . We can see that the values are higher at the beginning and then slowly decrease along the week.
Figure 10. Graphic representation of the percentage of individuals of the stroke unit with their Glasgow result.
By observing figure 10 we can see that 80% of the studied population had a glasgow of ]12-15], corresponding to minor brain injury, 12% had a glasgow of ]8-12] corresponding to a moderate brain injury and only 9% had a severe brain injury with a glasgow scale under 8.
65 75 85 95 105 115 125 135 145 155 165 Bl oo d Pr es su re m m /H g 0 0,1 0,2 0,3 0,4 0,5 0,6 0,7 0,8 0,9 % In di vi du al s of t he st ro ke u ni t
As we can see from figure 8, only a 5% of our patients were submitted to Thrombolysis.
Figure 9. Graphic representation of the arterial pressure variations along the week in stroke patients.
Figure 9 depicts the blood pressure variations of stroke patients along the week . We can see that the values are higher at the beginning and then slowly decrease along the week.
Figure 10. Graphic representation of the percentage of individuals of the stroke unit with their Glasgow result.
By observing figure 10 we can see that 80% of the studied population had a glasgow of ]12-15], corresponding to minor brain injury, 12% had a glasgow of ]8-12] corresponding to a moderate brain injury and only 9% had a severe brain injury with a glasgow scale under 8.
Sistolic Diastolic 9% 12% 80% ≤ 8 ]8-12] ]12-15] Glasgow results
As we can see from figure 8, only a 5% of our patients were submitted to Thrombolysis.
Figure 9. Graphic representation of the arterial pressure variations along the week in stroke patients.
Figure 9 depicts the blood pressure variations of stroke patients along the week . We can see that the values are higher at the beginning and then slowly decrease along the week.
Figure 10. Graphic representation of the percentage of individuals of the stroke unit with their Glasgow result.
By observing figure 10 we can see that 80% of the studied population had a glasgow of ]12-15], corresponding to minor brain injury, 12% had a glasgow of ]8-12] corresponding to a moderate brain injury and only 9% had a severe brain injury with a glasgow scale under 8.
Sistolic Diastolic
Feasibility of Near Infrared Spectroscopy in Stroke Patients
Figure 11. Graphic representation of the percentage of indiv iduals of the stroke unit with their NIHSS results.
By observing figure 11, we can see that 56% had a mild pathology with NIHSS values under 5, 15% had mildly severe pathology with NIHS between 5-14, 21% had severe pathology with NIHSS scores of 14-25 and 9% had a very severe pathology wih NIHSS values above 26.
Figure 12. Graphic representation of the results of a CT scan divided by the brain area affected in the stroke unit population.
On figure 12 we can see the results of the CT scan for site of lesions. The lesions on the right and left side had the highest incidence values with 35% of the population each, followed by billateral lesions usually more severe with 23% and finally 5% with normal imagiological scans. Most of the Normal imagiological studies were patients with small strokes that had the sympthology but were on the acute isodense state and therefore with no pathological image. 0 0,1 0,2 0,3 0,4 0,5 0,6 % In di vi du al s of t he st ro ke u ni t 0% 5% 10% 15% 20% 25% 30% 35% 40% % in di vi du al s fr om t he st ro ke u ni t
Feasibility of Near Infrared Spectroscopy in Stroke Patients
Figure 11. Graphic representation of the percentage of indiv iduals of the stroke unit with their NIHSS results.
By observing figure 11, we can see that 56% had a mild pathology with NIHSS values under 5, 15% had mildly severe pathology with NIHS between 5-14, 21% had severe pathology with NIHSS scores of 14-25 and 9% had a very severe pathology wih NIHSS values above 26.
Figure 12. Graphic representation of the results of a CT scan divided by the brain area affected in the stroke unit population.
On figure 12 we can see the results of the CT scan for site of lesions. The lesions on the right and left side had the highest incidence values with 35% of the population each, followed by billateral lesions usually more severe with 23% and finally 5% with normal imagiological scans. Most of the Normal imagiological studies were patients with small strokes that had the sympthology but were on the acute isodense state and therefore with no pathological image. 56% 15% 21% 9% 0 0,1 0,2 0,3 0,4 0,5 0,6 5< ]5-14] ]14-25] >26 NIHSS results 23% 35% 36% 5%
Bilateral Right Left Normal
Ictus Site
Feasibility of Near Infrared Spectroscopy in Stroke Patients
Figure 11. Graphic representation of the percentage of indiv iduals of the stroke unit with their NIHSS results.
By observing figure 11, we can see that 56% had a mild pathology with NIHSS values under 5, 15% had mildly severe pathology with NIHS between 5-14, 21% had severe pathology with NIHSS scores of 14-25 and 9% had a very severe pathology wih NIHSS values above 26.
Figure 12. Graphic representation of the results of a CT scan divided by the brain area affected in the stroke unit population.
On figure 12 we can see the results of the CT scan for site of lesions. The lesions on the right and left side had the highest incidence values with 35% of the population each, followed by billateral lesions usually more severe with 23% and finally 5% with normal imagiological scans. Most of the Normal imagiological studies were patients with small strokes that had the sympthology but were on the acute isodense state and therefore with no pathological image.
5%
Figure 13. Graphic representation of the results of a TU exam divided by the brain area affected in the stroke unit population.
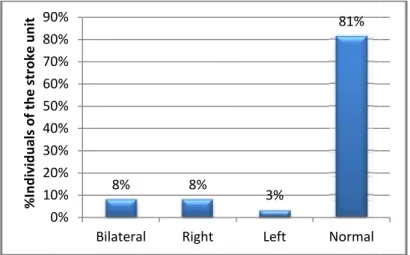
Figure 14. Graphic representation of the results of a CU exam divided by the brain area affected in the stroke unit population.
On our stroke unit every stroke patient was submitted to a CU and a TU. On figure 13 and 14, we can see that on CU, 66% of the population studied presented pathological lesions and 49% were bilateral. On TU we can see that 81% of the population is healthy with only 19% reporting lesions. For reference most of the lesions reported on CU were plaques, stenosis and flow alterations and on TU most reported lesions were flow alterations.
0% 10% 20% 30% 40% 50% 60% 70% 80% 90% % In di vi du al s of t he st ro ke u ni t 0% 10% 20% 30% 40% 50% 60% % In di vu du al s of t he st ro ke u ni t
Figure 13. Graphic representation of the results of a TU exam divided by the brain area affected in the stroke unit population.
Figure 14. Graphic representation of the results of a CU exam divided by the brain area affected in the stroke unit population.
On our stroke unit every stroke patient was submitted to a CU and a TU. On figure 13 and 14, we can see that on CU, 66% of the population studied presented pathological lesions and 49% were bilateral. On TU we can see that 81% of the population is healthy with only 19% reporting lesions. For reference most of the lesions reported on CU were plaques, stenosis and flow alterations and on TU most reported lesions were flow alterations.
8% 8% 3% 81% 0% 10% 20% 30% 40% 50% 60% 70% 80% 90%
Bilateral Right Left Normal
49% 6% 6% 38% 0% 10% 20% 30% 40% 50% 60%
Bilateral Right Left Normal
Figure 13. Graphic representation of the results of a TU exam divided by the brain area affected in the stroke unit population.
Figure 14. Graphic representation of the results of a CU exam divided by the brain area affected in the stroke unit population.
On our stroke unit every stroke patient was submitted to a CU and a TU. On figure 13 and 14, we can see that on CU, 66% of the population studied presented pathological lesions and 49% were bilateral. On TU we can see that 81% of the population is healthy with only 19% reporting lesions. For reference most of the lesions reported on CU were plaques, stenosis and flow alterations and on TU most reported lesions were flow alterations.
Feasibility of Near Infrared Spectroscopy in Stroke Patients
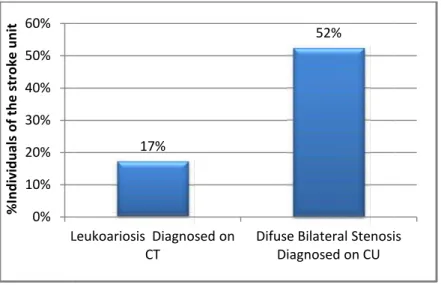
Figure 15. Graphic representation of the percentage of individuals of the stroke unit affected by leukoariosis and difuse bilateral stenosis.
Two commonly reported imagiological results were leokoariosis by CT scan and Diffuse bilateral stenosis reported on CU exam. Figure 15 shows us that 17% of the individuals from the stroke unit were diagnosed with leokoariosis on the CT scan and in 52% of the individuals, we identified diffuse bilateral stenosis on the CU exam.
Figure 16. Graphic representation of the average rSO2values at different times of the day.
Since we took many readings at different hours of the day we were able to plot figure
16 with the daily rSO2 variations of the stroke unit population. This graphic ditribution based
on 768 time readings, displays rSO2 values close to each other in the first hours of the
morning(1am). But it seems that as the day progresses; the frontal values get further apart from the supra-auricular ones with the latter having higher readings during the rest of the day. 0% 10% 20% 30% 40% 50% 60% Leukoariosis Diagnosed on CT % In di vi du al s of t he st ro ke u ni t 60 62 64 66 68 70 72 74 76 01:00 07:00 ave ra ge r SO2 v al ue s in t he st ro ke u ni t
Feasibility of Near Infrared Spectroscopy in Stroke Patients
Figure 15. Graphic representation of the percentage of individuals of the stroke unit affected by leukoariosis and difuse bilateral stenosis.
Two commonly reported imagiological results were leokoariosis by CT scan and Diffuse bilateral stenosis reported on CU exam. Figure 15 shows us that 17% of the individuals from the stroke unit were diagnosed with leokoariosis on the CT scan and in 52% of the individuals, we identified diffuse bilateral stenosis on the CU exam.
Figure 16. Graphic representation of the average rSO2values at different times of the day.
Since we took many readings at different hours of the day we were able to plot figure
16 with the daily rSO2variations of the stroke unit population. This graphic ditribution based
on 768 time readings, displays rSO2 values close to each other in the first hours of the
morning(1am). But it seems that as the day progresses; the frontal values get further apart from the supra-auricular ones with the latter having higher readings during the rest of the day.
17%
52%
Leukoariosis Diagnosed on CT
Difuse Bilateral Stenosis Diagnosed on CU
07:00 09:00 11:00 13:00 15:00 17:00 19:00 23:00
Feasibility of Near Infrared Spectroscopy in Stroke Patients
Figure 15. Graphic representation of the percentage of individuals of the stroke unit affected by leukoariosis and difuse bilateral stenosis.
Two commonly reported imagiological results were leokoariosis by CT scan and Diffuse bilateral stenosis reported on CU exam. Figure 15 shows us that 17% of the individuals from the stroke unit were diagnosed with leokoariosis on the CT scan and in 52% of the individuals, we identified diffuse bilateral stenosis on the CU exam.
Figure 16. Graphic representation of the average rSO2values at different times of the day.
Since we took many readings at different hours of the day we were able to plot figure
16 with the daily rSO2variations of the stroke unit population. This graphic ditribution based
on 768 time readings, displays rSO2 values close to each other in the first hours of the
morning(1am). But it seems that as the day progresses; the frontal values get further apart from the supra-auricular ones with the latter having higher readings during the rest of the day.
Difuse Bilateral Stenosis Diagnosed on CU 23:00 RF LF RS LS
2. Statistical inference
Figure 17. Graphic representation of the percentage of individuals of the stroke unit with values higher and lower than 60 rSO2.
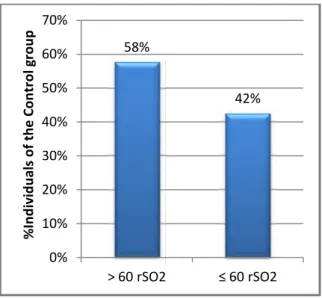
Figure 18. Graphic representation of the percentage of individuals of the control group with values higher and lower than 60 rSO2.
% In di vi du la s of t he st ro ke u ni t
2. Statistical inference
Figure 17. Graphic representation of the percentage of individuals of the stroke unit with values higher and lower than 60 rSO2.
Figure 18. Graphic representation of the percentage of individuals of the control group with values higher and lower than 60 rSO2.
65% 35% 0% 10% 20% 30% 40% 50% 60% 70% > 60 rSO2 ≤ 60 rSO2 % In di vi du la s of t he st ro ke u ni t 58% 42% 0% 10% 20% 30% 40% 50% 60% 70% > 60 rSO2 ≤ 60 rSO2 % In di vi du al s of t he C on tr ol g ro up
2. Statistical inference
Figure 17. Graphic representation of the percentage of individuals of the stroke unit with values higher and lower than 60 rSO2.
Figure 18. Graphic representation of the percentage of individuals of the control group with values higher and lower than 60 rSO2.
Feasibility of Near Infrared Spectroscopy in Stroke Patients
Table 1. Representation of NIRS specificity, sensitivity and positive and negative predictive values, using 60 rSO2 as reference.
Patients below 60 rSO2
Positive Negative
NIRS
Test Positive 45 28 Positive Predictive Value 45/(45+28)= 62% Test Negative 38 83 Negative Predictive Value
83/(83+38)= 69%
Sensitivity Specificity
45/(45+38)= 83/(28+83)=
54,22% 74,77%
As noted by David et al(9), values of rSO2 bellow 60 are pathological and prompt
evaluation should be undertaken. On figure 17 and 18, we have the percentage of individuals
from both the stroke unit and the control group with rSO2values below 60. We considered as
a positive value any rSO2 meassurement bellow 60 even if only one of the 4 readings fell
bellow the baseline. As can be seen, 35% of the stroke individuals had values compatible with ischemic lesions. Surprisingly, the control group had a higher value (42%) for the same measurements even though they were the healthy population. Thus, when we try to use
values bellow 60 rSO2 for diagnosing an acute stroke considering both the stroke population
and the healthy control group, as seen in table 1, NIRS made the correct diagnosis in 128 of 194 individuals and therefore obtained only a 54% sensitivity, and 74% specificity when compared to the 89% sensitivity and 100% specificity of a CT scan.
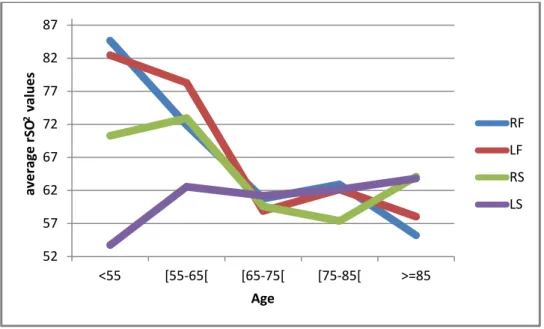
Figure 19. Graphic representation of the average rSO2 values from the first
measurement in the stroke patients distributed by age.
52 57 62 67 72 77 82 87 <55 [55-65[ [65-75[ [75-85[ >=85 ave ra ge r SO 2va lu es Age RF LF RS LS
Table 2. Statistical inference between age and rSO2 measurements, done in the stroke unit population p-value: Mann-Whitney U rSO2 SpO2 RF LF RS LS Age 0.233 0.325 0.645 0.956 0.01
On figure 19 it seems that as age increases, the average rSO2values decrease, but by
observing table 2 age does not produce any significant statistical diference in rSO2 readings
(pvalue >0.2) only on SpO2(p=0.01).
Table 3. Statistical inference between the age in the control group and the age of the stroke unit population.
p-value: Mann-Whitney U
Age control group VS Age Stroke unit 0.077
On table 3 we do not have a statistically significant difference between the age of the control group and the age of the stroke unit. This tells us that the age gap between figure 3 and 4 does not account for bias in the comparisson of the two groups, since they are simmiliar in age.
Table 4. Statistical inference between the relation of the rSO2 values in each gender in
the stroke unit population
p-value: Mann-Whitney U
rSO2 SpO2
RF LF RS LS
Gender 0.973 0.740 0.609 0.512 0.312
By observing table 4 it seems that gender has no influence on rSO2values (p>0.512) or
SpO2 values (p>0.312). Therefore the difference between figure 5 an 6 does not account for
Feasibility of Near Infrared Spectroscopy in Stroke Patients
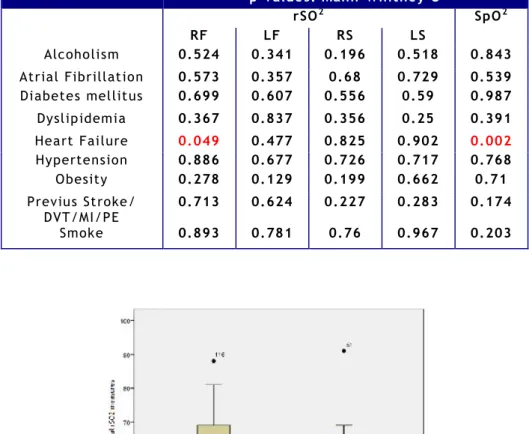
Table 5. Statistical inference between rSO2 values and the different risk factors in the
stroke unit population.
Figure 20. Graphic representation of the rSO2 values in stroke patients with and w ithout
Heart failure.
Figure 21. Graphic representation of the SpO2 values in stroke patients with and without
Heart failure. p-values: Mann-Whitney U rSO2 SpO2 RF LF RS LS Alcoholism 0.524 0.341 0.196 0.518 0.843 Atrial Fibrillation 0.573 0.357 0.68 0.729 0.539 Diabetes mellitus 0.699 0.607 0.556 0.59 0.987 Dyslipidemia 0.367 0.837 0.356 0.25 0.391 Heart Failure 0.049 0.477 0.825 0.902 0.002 Hypertension 0.886 0.677 0.726 0.717 0.768 Obesity 0.278 0.129 0.199 0.662 0.71 Previus Stroke/ DVT/MI/PE 0.713 0.624 0.227 0.283 0.174 Smoke 0.893 0.781 0.76 0.967 0.203
We tried to find which of the already proven risk factors for stroke influence rSO2
levels in our stroke patients and we noted that none of the presented risk factors on figure 4
had any influence on average rSO2 and SpO2 values, as shown by all the p-values higher than
0.05 on table 5. Only Congestive heart disease presented two significant statistical
differences: (p=0.049) for frontal right sensor and (p=0.002) for SpO2, with both being lower if
Congestive Heart disease was present (figure 20 and 21).
Table 6. Statistical inference of rSO2 values in the stroke unit population between those
who underwent thrombolysis and those who did not.
p-values: Mann-Whitney U
rSO2 SpO2
RF LF RS LS
Thrombolysis 0.7 0.348 0.134 0.141 0.574
On table 6 we can also see that the 5% of the stroke unit patients that underwent
thrombolysis had no statistical difference in their rSO2and SpO2values as compared to those
without any intervention.
Table 7. Statistical inference of rSO2 values in the stroke unit population between those
who had Leukoariosis and diffuse bilateral stenosis and those who did not suffer from these pathologies. p-values: Mann-Whitney U rSO2 SpO2 RF LF RS LS Leukoariosis 0.086 0.155 0.966 0.292 0.222 Difuse Bilateral Stenosis 0.866 0.772 0.148 0.065 0.5
Patients with Leukoariosis and diffuse bilateral stenosis also did not demonstrate any
statistically significant difference between their rSO2 values when compared with individuals
not carrying these pathologies.(Table 7).
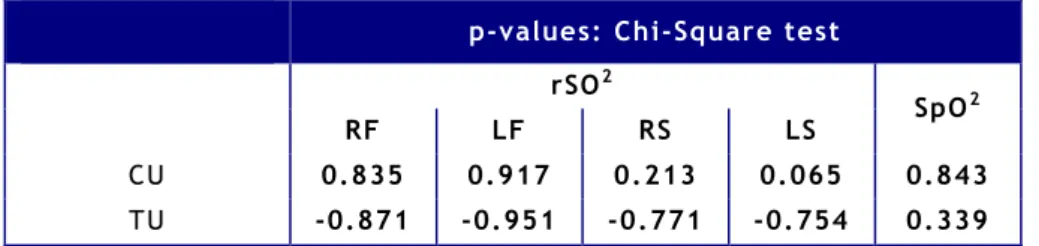
Table 8. Statistical inference of rSO2 values in the stroke unit population between those
who had reported pathologies on CU and TU and those who did not.
p-values: Chi-Square test
rSO2
SpO2
RF LF RS LS
CU 0.835 0.917 0.213 0.065 0.843
TU -0.871 -0.951 -0.771 -0.754 0.339
When comparing the two diferent imagiological studies on table 8 of the RS from CU exam; we can see that none of the other values were statistiacally significant. Therefore,
Feasibility of Near Infrared Spectroscopy in Stroke Patients
there are no differences in the values of rSO2 and SpO2 in those individuals with or without
reported TU and CU imagiological lesions.
Table 9. Statistical inference of the rSO2 levels and the different lesions sites reported
on CT CU and TU exams done in the stroke unit population
p-value: Chi-Square test
rSO2 SpO2 RF LF RS LS TU 0.271 0.288 0.569 0.491 0.681 CU 0.895 0.479 0.02 0.156 0.994 CT 0.375 0.542 0.763 0.45 0.45
When comparing the rSO2 from the different lesions sites diagnosed on each of the
imagiological studies presented on table 9 we can say that there is no statisticaly significant difference between them, with the exception of the p=0.02 of RS in CU . Thus it seams that
the site of injury does not influence rSO2levels.
Table 10. Statistical inference between the Glasgow and NIHSS and the rSO2 levels in
the stroke unit population.
p-values:Pearsons Correlation
rSO2 SpO2
RF LF RS LS
Glasgow Scale 0.117 0.412 0.764 0.285 0.000
NIH Stroke Scale 0.097 0.028 0.639 0.588 0.311
By observing table 10 we can say, with the exeption of the left frontal sensor readings
on NIHSS (p=0.028), that the NIHSS and the glasgow coma scale had no influence in rSO2
Figure 22. Graphic representation of the average rSO2 measurements in the stroke unit
patients along the week.
Table 11. Statistical inference of the different average rSO2 levels along the week p-values: Chi-Square test
Variation along the
week RFLF 0.1880.037
RS 0.003
LS 0.000
Difference between the rSO2 sensors along
the 6 measures RF vs RS 0.000 LS vs LF 0.000 LS vs RF 0.000 LF vs RS 0.000 LS vs RS 0.000
Table 12. Statistical inference of the different average rSO2 levels between the control
group and the first measurement of the stroke patients.
p-value: Mann-Whitney U
rSO2
RF LF RS LS
Control group VS Stroke Unit first
Feasibility of Near Infrared Spectroscopy in Stroke Patients
Since we followed each patient of the stroke unit for 5 consecutive days we were able
to plot figure 22. Here we have represented graphic variations of the average rSO2values of
stroke patients along the week. At the end we can also see the average rSO2 values of the
control group of healthy individuals. With a total of 3072 measurements it seems that the levels are decreasing with the highest ones being at the beginning of the week and then slowly deacresing to values similliar to those obtained in the control group. The variations of the measurements obtained during the week proved to be statisticaly significant for the
stroke unit as demonstrated by table 11; while the difference between rSO2 levels in the
control group and the first measurement of the stroke unit only demonstrated to be statistical significant for the supra auricular sensors as seen in table 12.
Figure 23. Graphic representation of right and left lesions on CT and their repective rSO2 levels.
Table 13. Percentage of individuals with higher rSO2 levels on one side of the brain
when compared to the contralateral side in those with a right or left sided lesion detected by a CT scan.
p-values:Pearsons Correlation
Right>Left
Left>Right
Left=Right
Right lesions-CT 51% 31% 18%