*e-mail: [email protected]
Recebido: 28/08/2012 / Aceito: 14/12/2012
A comparative study for different shielding material composition
and beam geometry applied to PET facilities: simulated transmission
curves
Gabriela Hoff, Paulo Roberto Costa*
Abstract The aim of this work is to simulate transmission data for different beam geometry and material composition in order to evaluate the effect of these parameters on transmission curves. The simulations are focused on outgoing spectra for shielding barriers used in PET facilities. The behavior of the transmission was evaluated as a function of the shielding material composition and thickness using Geant4 Monte Carlo code, version 9.2 p 03.The application was benchmarked for barited mortar and compared to The American Association of Physicists in Medicine (AAPM) data for lead. Their inluence on the transmission curves as well the study of the inluence of the shielding material composition and beam geometry on the outgoing spectra were performed. Characteristics of transmitted spectra, such as shape, average energy and Half-Value Layer (HVL), were also evaluated. The Geant4 toolkit benchmark for the energy resulting from the positron annihilation phenomena and its application in transmission curves description shown good agreement between data published by American Association on Physicists in Medicine task group 108 and experimental data published by Brasil. The transmission properties for different material compositions were also studied and have shown low dependency with the considered thicknesses. The broad and narrow beams coniguration presented signiicant differences on the result. The itting parameter for determining the transmission curves equations, according to Archer model is presented for different material. As conclusion were deined that beam geometry has signiicant inluence and the composition has low inluence on transmission curves for shielding design for the range of energy applied to PET.
Keywords PET, Transmission curves, Monte Carlo simulation.
Estudo comparativo entre diferentes composições de materiais de blindagem e
geometrias de feixe aplicadas a instalações para PET: curvas de transmissão
simuladas
Resumo O objetivo deste trabalho é simular dados de transmissão para feixes de diferentes geometria e composição de
materiais, a im de avaliar o efeito destes parâmetros em curvas de transmissão. As simulações estão focadas em espectros de saída para blindagem por barreiras utilizadas em instalações de PET. O comportamento
da transmissão foi avaliado como uma função da composição do material de blindagem e de sua espessura,
usando o código de Monte Carlo Geant4, versão 9.2 p 03. A aplicação foi validada para argamassa baritada e comparada com dados publicados pela Associação Americana de Físicos em Medicina (AAPM) para o chumbo. Foram realizadas avaliações da inluência da geometria do feixe e da composição do material sobre os espectros de saída e sobre as curvas de transmissão. Características de transmissão dos espectros, tais como a forma, a energia média e a camada de semirredutora (HVL), também foram avaliadas. A
ferramenta Geant4, para a energia resultante de fenômenos de aniquilação de pósitrons e sua aplicação
na descrição de curvas de transmissão, mostrou boa concordância entre os dados publicados pelo grupo de trabalho 108 da Associação Americana de Físicos em Medicina e dados experimentais publicados no Brasil. As propriedades de transmissão para diferentes composições de materiais foram também estudadas e mostraram baixa dependência com as espessuras consideradas. A coniguração de feixes largos e estreitos apresentaram diferenças signiicativas nos resultados. Os parâmetros de ajuste para a determinação das equações que representam as curvas de transmissão, de acordo com o modelo de Archer, são apresentados para diferentes materiais. Como conclusão, pode-se dizer que a geometria do feixe tem inluência signiicativa e a composição tem pouca inluência nas curvas de transmissão para projetos de blindagem para a faixa de energia aplicadas em PET.
Introduction
Since 1953 with the development of positron imaging device for clinical use, at Massachusetts General Hospital, the radiation safety for patients and for occupational workers has been considered an important part of this technique application (Cruzate and Discacciatti, 2008). In this technique, which uses positron annihilation radiation into the patient body, the energy absorption is low. Consequently,
the dose rate for patients is reduced by a signiicant
factor (Brinkley et al., 2009; Cruzate and Discacciatti, 2008). The published study by Brinkley et al. (2009)
evaluated the inluence of the scatter in the patient and had identiied that the fraction of lower energies is signiicant compared to 511 keV photons and can inluence the effective attenuation of lead in clinical PET facilities. In order to ind optimized shielding
barriers, different authors have published information regarding the transmission curves (Demir and Keles, 2006; Elschot et al., 2010; Madsen et al., 2006). Many published papers have been used Monte Carlo toolkits to generate those data and to explore different possibilities for transmission curves (Brinkley et al., 2009; Cruzate and Discacciatti, 2008; Hoff et al., 2010; Madsen et al., 2006). The deinition of these photon
transmission curves of the available and regularly commercialized materials is important in order to determine the shielding thickness for introducing safe medical applications environments. The determination of the needed shielding thicknesses is important to guarantee the environmental adequacy for the occupational workers and to reduce cost of building PET facilities. Therefore, the objective of this work was to simulate the transmission (T) and to calculate half – value layer (HVL) data based on shielding outgoing spectrum used on PET facilities (Hoff et al., 2010; Madsen et al., 2006; National..., 2005). In this paper,
Geant4 toolkit was used to evaluate the inluence of
the shielding material composition and beam geometry
(evaluating narrow and broad beam coniguration) on
the transmission curves shapes and intensities. Fitting equation parameters were calculated, according to the model proposed by Archer et al. (1983), for broad beam
coniguration and barited mortar, lead, concrete, iron
and steel shielding. The results present comparative
data for narrow and broad beam coniguration and the inluence of different material compositions on
transmission data and outgoing spectra. Spectrum characteristics, such as shape, average energy and HVL, were also evaluated.
Materials and Methods
This work was developed in four different steps: (i) benchmark of the toolkit for the application, (ii) study
of the inluence of the shielding composition and beam
geometry on the transmission curves, (iii) study of
the inluence of the shielding material composition
and beam geometry on the outgoing spectra, and
(iv) generation of itting parameter for determining
the transmission curves equations. The Geant4 version 9.2 p 03 simulation toolkit (Agostinelli et al., 2003; Allison et al., 2006) was used to achieve these objectives. The simulated universe was described as a sphere with a diameter of 20 m composed by dry air according to the International Commission on Radiation Units and Measurements (International..., 1989) in the descriptions presented in report 44. The geometry considers one punctual source irradiating monoenergetic photons of 511 keV homogeneously into a solid angle which covers the irradiation area
deined as narrow or broad beam. It was simulated an
entrance beam area with (1 × 1) cm2 for narrow beam
and with (70 × 70) cm2 for broad beam in order to
explore these two different beam conigurations. The
source to shielding wall entrance distance was 60 cm. Two sensitive volumes were simulated: one in front of the shielding wall (58 cm far from the source) and other behind it (placed 62 cm plus the higher shielding
thickness studied for a speciic material). The sensitive
volumes were considered as spheres of air with 1 cm
of radius and they were deined estimate the absorbed energy and photon lux (from energies 1 keV up to
511 keV), with and without the shielding wall. Different materials are reported in the literature as possible to be used for shielding photon beams. Some of them are lead, concrete, steel, and bismuth borate glasses (Demir and Keles, 2006; Elschot et al., 2010; Madsen et al., 2006; Singh et al., 2002). In the present work, the shielding evaluated were made of pure lead, concrete, described according Simpkin (1989, 1995) and International Commission on Radiation Units and Measurements (International..., 1989) report 44; iron alloy (named steel) composed by 1% of carbon and 99% of iron, pure iron, and four different barited mortar with chemical compositions experimentally
determined using x-ray luorescence technique. These
mortars were selected by four traditional Brazilian providers. The mass densities of the mortars were also determined according Brazilian regulation. Table 1 shows the chemical composition of the materials studied in the present work.
according the National Institute of Standard and Technology (Hubbell and Seltzer, 1996) the imparted energy is equivalent to the absorbed energy in the air sensitive volume. So, the transmission was calculated considering the ratio between the absorbed energy with and without the shielding barrier according to Equation 1. The theory of error propagation for independent variables was used to calculate the error
of the transmission data caused by the luctuation in
the simulated values.
abi abo
E T
E
= (1)
A group of quantitative statistical tests were chosen in order to evaluate the differences observed on the results of the present work. These quantitative statistical evaluations were performed by using Wald-Wolfowitz, Anderson Darling, Chi-Square and Kolmogorov-Smirnov tests on the comparative transmission data. To evaluate the outgoing spectra from the shielding wall it was used Pearson Chi-Square test and Kolmogorov-Smirnov test. The level of
signiicance of the tests described in the following
sections is 0.001, it means that the null hypothesis is rejected whenever the p-value resulting from the test statistic is smaller than 0.001. The R statistical toolkit was used to calculate these values, with exception to the Chi-square test, which was performed by generic spreadsheet. In this case, the p-value was calculated from “chidist” function. The combined evaluation of
the statistical results was used to deine the similarities
and differences. This combined evaluation considered good agreement for the group of data that pass at least
on 3 of the goodness of it tests (for the transmission
evaluation) and for both testes (for spectra evaluation). The benchmark was performed by using the transmission data for lead published by Madsen et al. (2006) at American Association on Physicists in Medicine Task Group 108 and experimental data published by Brasil (2009) and Hoff et al. (2010).
The study of the inluence of shielding composition
and beam geometry on the transmission curves and outgoing spectra were performed for lead, concrete, steel and iron. The outgoing spectra from the shielding
Table 1. Chemical composition of the simulated material.
Chemical Element
Concrete
BM1 BM2 BM3 BM4 Simpkin ICRU 44
H - - - - 0.00560 0.02210
C - - - 0.00248
Ba 0.28948 0.37000 0.21022 0.36493 -
-Ca 0.18330 0.11100 0.24025 0.15953 0.08260 0.04295
O 0.18030 0.03000 0.16017 0.17947 0.49830 0.57493
Si 0.14524 0.01580 0.04905 0.07977 0.31580 0.30463
S 0.06411 0.17300 0.04104 0.07977 0.00120
-Al 0.02935 - 0.01331 0.02204 0.04560 0.01995
Fe 0.02404 0.03200 0.16017 0.03889 0.01220 0.00644
Mg 0.01482 0.00340 0.02513 0.01296 0.00240 0.00127
P 0.00661 0.00890 0.01702 0.00957 -
-K 0.01192 0.00040 0.00181 0.00518 0.01920 0.01005
Ti 0.00351 0.00290 0.00681 0.00309 -
-Mn 0.00140 0.00100 0.00350 0.00219 -
-Na 0.00160 0.00130 0.00100 0.00399 0.01710 0.01521
Sr 0.00065 0.00100 0.00200 0.00105 -
-Cl 0.00030 - 0.00020 0.00018 -
-Zn 0.00010 - 0.00010 0.00010 -
-Zr 0.00009 0.00013 0.00038 - -
-Rb 0.00005 - - - -
-Ni - 0.00017 0.00016 0.00020 -
-Nb 0.00005 - 0.00017 0.00006 -
-Ce - - 0.00300 - -
-Cr - - 0.00041 - -
-Y - - 0.00003 0.00003 -
-Cu - - - 0.00012 -
-H2O 0.04307 0.24900 0.06407 3.68900 -
barrier are presented in lux probability. This quantity
represents the number of photons crossing the sensitive
volume at a speciic energy divided by the number of
photons emitted from the source. They were evaluated considering its average energy, the half – value layer
(HVL) and the shape of the photon lux probability as function of the energy. The itting parameters for
the transmission curves were calculated for broad beam considering lead, iron, steel and the different compositions of barited mortar and concrete. The calculation of these parameters was based on method published by Archer et al. (1983), and was performed
using an Origin 8.0 (Microcal, inc.) itting routine. The
Equation 2 presents the formulation for calculating the
shielding thickness (x) using the itting parameters α,
β and γ for the considered material. In this equation, K0 is the air kerma at the detector position without the shielding and K is the air kerma in the same position after the photons were transmitted by the shielding.
0
1
γ +β α
β
+
α
= αγ K
K
Ln
x
(2)
Results
The results are presented in four steps: (a) benchmark
of the simulation, (b) study considering the inluence
of different composition and beam geometry on
transmission curves, (c) itting equation parameters
for the studied materials, and (d) study of beam geometry on outgoing spectra from shielding barrier.
The benchmark of the simulation
Figure 1 presents transmission data for lead considering
incident lux of 511 keV photons, as published by
Madsen et al. (2006) at AAPM Task Group 108. In
the same igure is represented the simulation data
obtained by Geant4 toolkit.
Figure 1. Transmission data simulated for lead published by AAPM 108 (Madsen etal., 2006) and simulated using Geant4 toolkit in this work.
Figure 2. Transmission data simulated for barited mortar in this work and published experimental data (Brasil, 2009).
a
b
c
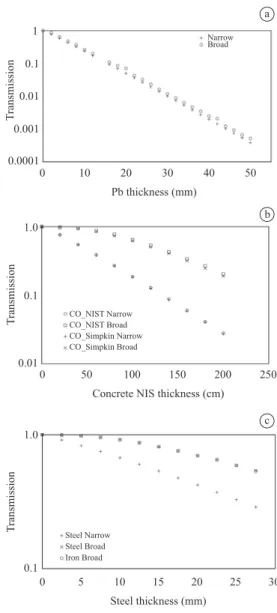
Figure 3. Transmission data simulated for the geometries and materials studied (a) lead, (b) concrete and (c) steel and iron.
Inluence of different composition and beam
geometry on transmission curves
The transmission data for different geometry
coniguration are presented in Figure 3.
Fitting parameters
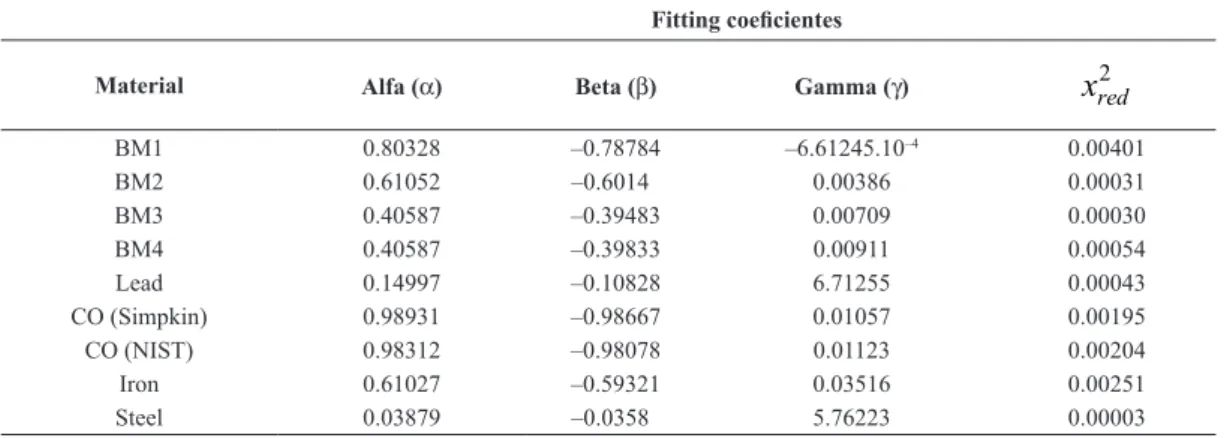
According Madsen etal. (2006) the broad beam geometry is the one recommended as a good representation for mimic a PET beam application. Table 2 presents the
itting parameters for the Equation 2 for all studied
material according to the simulated broad beam geometry.
The outgoing spectra characterization
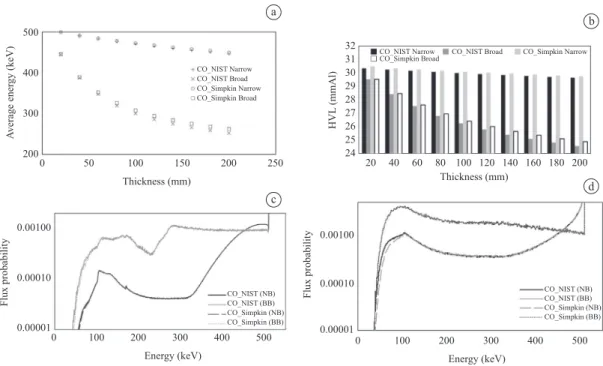
The graphs in Figures 4a-b, 5a-b, 6a-b and 7a-b present average energy and the HVL of the outgoing spectra
for the different material and beam coniguration and
thickness studied. The graphs presented in Figures 4c-d, 5c-d, 6c-d and 7c-d show the spectra for the different beam geometry and material composition for the thinner and thicker shielding wall simulated. The spectra graphs were rescaled for make possible to
verify the observed differences. So the maximum lux
probability is described in the legend of Figure 4c, d, 5c-d, 6c-d and 7c-d for the energy of 511 keV.
Discussion
There are many sources for experimental data (Almeida Junior, 2005; Brasil, 2009; Hoff et al., 2009; Singh et al., 2002). The problem in comparing these
a b
c d
Figure 4. a) Average energy and b) half value layer for different shielding thickness evaluated for lead as shielding material. Spectra study for lead presented as lux probability as function of the energy: c) 2 mm (maximum lux probability for narrow beam is 0.9362 and broad beam is 0.6749) and d) 50 mm comparing narrow and broad beam (maximum lux probability for narrow beam is 0. 6235 and broad beam is 0.4135).
Table 2. Fit equation parameters for broad beam coniguration and the studied materials. Fitting coeicientes
Material Alfa (α) Beta (β) Gamma (γ)
x
red2BM1 0.80328 –0.78784 –6.61245.10–4 0.00401
BM2 0.61052 –0.6014 0.00386 0.00031
BM3 0.40587 –0.39483 0.00709 0.00030
BM4 0.40587 –0.39833 0.00911 0.00054
Lead 0.14997 –0.10828 6.71255 0.00043
CO (Simpkin) 0.98931 –0.98667 0.01057 0.00195
CO (NIST) 0.98312 –0.98078 0.01123 0.00204
Iron 0.61027 –0.59321 0.03516 0.00251
data on simulation procedures is to get all speciic
information from geometry, used spectra and material composition. In the present work, the benchmark of the simulation considering experimental data collection was based on published data (Brasil, 2009; Hoff et al., 2010) which provided the information needed to build a simulation in the same conditions of the experiment. The discussions are presented in the same structure then results.
The benchmark of the simulation
Figure 1 presents a good visual agreement between the simulated data in this work and the data published by Madsen et al. (2006). The statistical tests applied to
these data in order to evaluate the statistical signiicance
of the agreement considering one standard deviation.
The Wald-Wolfowitz test conirms the randomness
of the Geant4 simulation according Madsen et al. (2006) reference data (test value 3.408 and p-value < 0.001). It means that the simulation does not present systematics differences according the tendency curve of the reference data. The Kolmogorov-Smirnov (test value 0.071 and p-value 1.000), Anderson-Darling (test value –1.335 and p-value 0.717) and Chi-Square (test value 16.564 and p-value 0.220) present p-values
conirmed the goodness of it to a signiicance level
of 0.001, what shows that Geant4 simulation has
same curve shape than the reference data. The Chi-Square test was performed considering the error associated to the Geant4 simulation. The variations/ errors on reference data were not adopted because this information was not available.
Figure 2 presents a similar tendency between experimental and simulated data, but the experimental data is always above the simulated one. The randomness test was used to evaluate the agreement on data comparing the different composition of barited mortar. The values presented by Wald-Wolfowitz test (BM1 value test 0.527 and p-value 0.299, BM2 value test 0.782 and p-value 0.217, BM3 value test 1.740 and
p-value 0.041, BM4 value test 1.5780.057) conirm the signiicance of the systematic difference between
the Geant4 simulation and the experimental data for barited mortar. These differences can be explained by subtle changes in the barited mortar composition or by the small differences on time determination to correct the experimental data or beam geometry description between experimental and simulated data. The Kolmogorov-Smirnov (presents test values of 0.167 and p-values of 1.000 to BM1 and BM2, and test values of 0.333 for p-values of 0.893 to BM3 and BM4), Anderson-Darling (showing test values between –1.289 and –0.517 and p-values between 0.706 and 0.736) and Chi-Square p-values (always superior to 0.736)
a
b
c
d
conirmed the good agreement between the Geant4
simulation and the experimental data. The Chi-Square test was performed considering the error associated to the Geant4 simulation and the variation presented by each experimental data points (10%).
Inluence of different composition and beam
geometry on transmission curves
The transmission data for different geometry presents small differences between broad and narrow beams geometries for lead (Figure 3a). For both compositions of concrete (Figure 3b) and steel (Figure 3c) the differences between broad and narrow geometries
were signiicant, including a change on shape that
can be seen on the different model for the presented
itting curves.
The statistical evaluation of the effect of the beam
geometry on transmission data shows signiicant
differences between the curves simulated for the different beam geometries with the exception for lead. According Chi-Squares (with p-values < 0.001 with exception for lead that presented p-value of 0.005) and Anderson-Draling tests (that presents test values between 3.610 and 3.891 with p-values between 0.009 and 0.011 with exception to lead presenting test value of –1.225 and p-value 0.689) the geometry can
inluence signiicantly the transmission curves, with
the exception for lead. The Kolmogorov-Smirnov test presented bordering results. The Wald-Wolfowitz test results, with p-values between 0.242 and 0.316 to all materials, show the non-randomness of the compared distributions. It means the systematic differences can be found between the transmissions curves caused by the beam geometry.
The statistical evaluation of the material composition effect on transmission data (with exception
for steel and iron) showed a small inluence.
Data compared presented p-values above 0.001 (between 0.132 and 0.256) for Wald-Wolfowitz
test, conirming the signiicance of the systematic
differences between the simulated data for the different shielding material composition compared, with exception for concrete that presents p-values of 0.002 to narrow beam geometry and 0.015 to broad beam geometry. It means that the material composition can change the intensity for the transmission data. However the Chi-Square test results shown that these
differences are not signiicant when the errors from
the simulations are considered.
The inluence of shielding material composition on transmission data did not show signiicant differences
for the incoming energy of 511 keV.
The literature presents published works using different kind of barited mortar and different techniques
a b
c d
to determine its elemental composition and density (Almeida Junior, 2005; Brasil, 2009; Hoff et al., 2009). The densities are in the range from 1.98 to 2.68 g/cm3, but it is strongly dependent from the
quantity of barited and high atomic number elements. For barited mortar the results presented in the present
work do not demonstrated signiicant inluence of its
material composition on transmission curves. It is important to note that the results shown a tendency to increase the transmission values when the density of the barited mortar decreases, as was expected and reported in the published data (Almeida Junior, 2005; Brasil, 2009; Hoff et al., 2009).
Fitting parameters
The presented parameters can be used to calculate shielding thickness for the different evaluated materials. Because systematic errors indicated by Wald-Wolfowitz
test, that are the relection of systematic differences
on the transmission intensity (even it is smaller than the error in the simulation), it is recommendable that one who will use these equations choose the one that match to the considered material composition. In case the composition of the material is unknown, it is recommendable to select the one which presents the larger thickness.
The outgoing spectra characterization
The Figure 4 shows the average energy and HVL for lead. The average energy is lower for all data points
for broad beam coniguration as well the HVL. It
happens because of the scatter radiation contribution for larger irradiation areas. The same behavior can be observed for the other material (Figures 5 and 6). Figure 4a, b presented a difference of approximately
10 keV for narrow beam coniguration and 30 keV for broad beam coniguration between 2 mm and
50 mm of lead. For the same thickness of shielding material, the HVL decreased 0.3 mm and 0.7 mm of
aluminum for narrow and broad beam coniguration,
respectively.
Figure 4c, d show the lux probability for 2 mm and
50 mm of lead. The statistical analyses for all studied
cases presented signiicant differences calculated by Pearson Chi-Square test and signiicant systematic
differences between the compared spectra by using Wald-Wolfowitz test. Besides that, the transmission
curves were not signiicant affected by these changes.
Figure 5 shows the average energy and HVL for concrete. The average energy is lower for all
data points for broad beam coniguration as well the HVL. There were no signiicant difference between
the HVL for different material composition and same
beam geometry. Figure 5a shows a difference of
approximately 50 keV for narrow beam coniguration and 200 keV for broad beam coniguration between
10 mm and 200 mm of both concrete compositions studied (Figure 5a, b). For the same thickness of shielding material, the HVL decreased about 1 mm and 5 mm of aluminum for narrow and broad beam
coniguration, respectively.
Figure 5c, d show the lux probability for 10 mm
and 200 mm of concrete. The statistical analyses for
all studied cases presented signiicant differences calculated by Pearson Chi-Square test and signiicant
systematic differences between the compared spectra by using Wald-Wolfowitz test when different beam geometry are compared. It means that the spectra
shape is signiicantly inluenced by the beam geometry
for PET application. The statistical analyses show
no signiicant differences between the concrete
compositions in the studied thickness. It means that the concrete compositions evaluated do not have
signiicant effect the outgoing spectra.
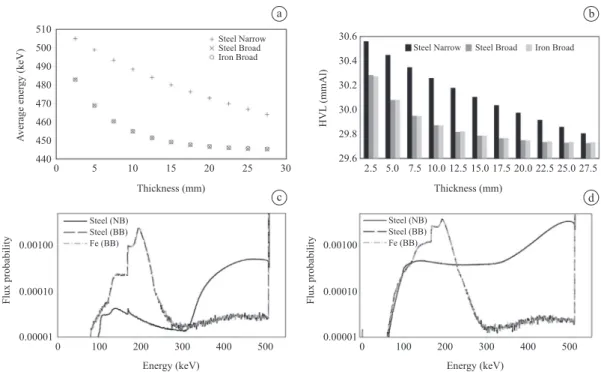
Figure 6a, b show the average energy and HVL
for steel and iron. There were no signiicant difference
between the HVL for different material composition
and same beam geometry and signiicant differences between broad beam and narrow beam coniguration.
Figure 6c, d present a difference of approximately
35 keV for narrow beam coniguration and 46 keV for broad beam coniguration between 2.5 mm and
27.5 mm of steel and iron. To the same thickness of shielding material, the HVL decreased about 0.6 mm and 0.7 mm of aluminum for narrow and broad beam
coniguration respectively.
Figure 6c, d present lux probability for 2.5 mm
and 27.5 mm of steel and iron. The statistical analyses
for all studied cases presented signiicant differences calculated by Pearson Chi-Square test and signiicant
systematic differences between the compared spectra by using Wald-Wolfowitz test when different beam geometry are compared. It means that the spectra shape
is signiicantly inluenced by the beam geometry for
PET application. When steel and iron are compared
showing no signiicant differences for the thickness
studied, which means that for the studied compositions
there are not signiicant inluence on the outgoing
spectra.
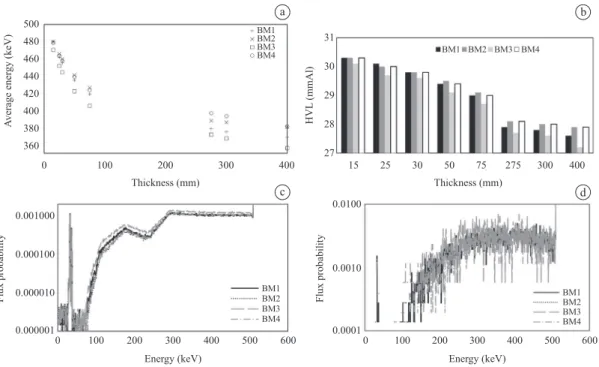
Figure 7 shows the average energy and HVL for the different barited mortar studied. There was no
signiicant difference between the HVL for different
It is in agreement with the material characterization because is the BM3 the one that has higher density. The barited mortar BM1 and BM4 presented similar results for HVL and energy. These materials have closer values for density, among the evaluated barited mortar compositions.
Figure 7c, d show the lux probability for 25 mm
and 400 mm of different composition of barited mortar. The statistical analyses for all studied cases
they presented no signiicant differences calculated
by Pearson Chi-Square test. The Wald-Wolfowitz test presented this data is randomly distributed considering the different compositions and thickness of the studied material. It means that for this material the spectra
shape was not signiicantly affected by the barited
mortar studied compositions. The BM3 was the one
that presented larger differences on lux probability
when compared to other compositions for all studied thickness.
In the last 10 years, several papers discussed about the applied radiological protection in PET facilities (Cruzate and Discacciatti, 2008; Demir and Keles, 2006; Elschot et al., 2010; Hoff et al., 2010). These papers evaluated different possibilities to optimize the protection by investigating different material
compositions used as shielding, the inluence of
self-absorption on PET, or sharing experimental data collected in PET facilities. The present work
brings new information about barited mortar used as shielding for PET. It shows that changes on beam
geometry can signiicant inluence the transmission
curves and changes on composition, for the same
material, are not as signiicant as the geometry by inluence the transmission curves.
Conclusion
This work described the evaluation of transmission curves applied to PET shielding design, based on simulated data. The Geant4 toolkit was used and
its benchmarking conirmed good agreement with
published data by Madsen et al. (2006) at AAPM 108 task group and experimental data published by Brasil (2009).
The comparison between broad and narrow beam
coniguration presented statistical differences showing
the changes in transmission data as well in outgoing spectra. In this work, all studied material (excepting
lead) presented statistical signiicance differences
between the broad and narrow beam. Therefore, considering the particularities of the PET technique, it is recommended that transmission studies for this application must use broad beam geometry. Broad beam
simulated coniguration results in larger errors in the evaluation compared to narrow beam coniguration, because of that the broad beam coniguration, using
Figure 7. a) Average energy and b) half – value layer for different shielding thickness evaluated, considering barited mortar as shielding material. Spectra study for different composition of barited mortar presented as lux probability as function of the energy comparing narrow and broad beam conigurations for c) 25 mm (maximum lux probability for BM1 is 0.5356, BM2 is 0.5486, BM3 is 0.4909 and BM4 is 0.5375) and for d) 400 mm (maximum lux probability for BM1 is 0.0812, BM2 is 0.0812, BM3 is 0.0572 and BM4 is 0.1009).
a b
Monte Carlo codes, requires larger running times in order to get acceptable statistical results.
No signiicant differences were observed when
different compositions of the same shielding material were compared. An exception of this result is the comparison between iron and steel. However the
barited mortar data presented a signiicant difference
between their transmission curves (observed in the Wald-Wolfowitz test). This result indicates its possible
inluence on the intensity of the transmission data. The
observed tendency shows an increase on transmission data with the decrease in density for barited mortar.
Other expected behavior observed in the spectra evaluation was that the number of photons with the energy of 511 keV decreases when the numbers of photons with lower energy increases. The interesting
observation was that most signiicant energy that increases in number of photons, as well as luence, was
the 510 keV and the photons with this energy increases
most signiicantly that the other energies as function of
the shielding thickness. It is caused by the increase on scatter photons considering the sensitive volume and it agreement to the decrease in mean energy and HVL
data for broad beam coniguration. The decreasing on
total munber of photons collected by sensitive volume, because of the enlargement of the irradiation area results,
resulting in high statistical luctuations on spectra. For
the spectra evaluated, the broad beam geometry always presented low mean energy and HVL than the narrow beam geometry. For broad beam geometry the outgoing energy from the shielding wall presented lower energies photons, specially with 511 keV, when compared to narrow beam geometry.
This work presents a group of itting parameters
that can be used to calculate the shielding thickness for PET application for different material: four different barited mortar and concrete compositions,
lead, iron and steel. These itting parameters were
calculated based on broad beam geometry. Even the
Chi-Square test showing no statistical signiicance in
the statistical differences pointed by Wald-Wolfowitz test, it is recommendable that one who will use these equations chooses the one that matches the material composition. In case one does not know the material composition of the shielding, it is recommended to select the one that presents the larger thickness.
Acknowledgements
The authors thanks the Conselho Nacional de
Desenvolvimento Cientíico e Tecnológico – CNPq
(process 312029/2009-8), the Fundação de Amparo à Pesquisa do Estado de São Paulo – FAPESP (process 2010/12237-7) and the Coordenação
de Aperfeiçoamento de Pessoal de Nivel Superior – CAPES (process BEX 6460/10-0) for the partial support to this work. This research project is part of the INCT project: Metrologia das Radiações Ionizantes na Medicina.
References
Agostinelli S, Allison J, Amako K, Apostolakis J, Araujo H, Arce P, Asai M, Axen D, Banerjee S, Barrand G, Behner F, Bellagamba L, Boudreau J, Broglia L, Brunengo A, Burkhardt H, Chauvie S, Chuma J, Chytracek R, Cooperman G, Cosmo G, Degtyarenko P, Dell’Acqua A, Depaola G, Dietrich D, Enami R, Feliciello A, Ferguson C, Fesefeldt H, Folger G, Foppiano F, Forti A, Garelli S, Giani S, Giannitrapani R, Gibin D, Gómez Cadenas JJ, González I, Gracia Abril G, Greeniaus G, Greiner W, Grichine V, Grossheim A, Guatelli S, Gumplinger P, Hamatsu R, Hashimoto K, Hasui H, Heikkinen A, Howard A, Ivanchenko V, Johnson A, Jones FW, Kallenbach J, Kanaya N, Kawabata M, Kawabata Y, Kawaguti M, Kelner S, Kent P, Kimura A, Kodama T, Kokoulin R, Kossov M, Kurashige H, Lamanna E, Lampén T, Lara V, Lefebure V, Lei F, Liendl M, Lockman W, Longo F, Magni S, Maire M, Medernach E, Minamimoto K, Mora de Freitas P, Morita Y, Murakami K, Nagamatu M, Nartallo R, Nieminen P, Nishimura T, Ohtsubo K, Okamura M, O’Neale S, Oohata Y, Paech K, Perl J, Pfeiffer A, Pia MG, Ranjard F, Rybin A, Sadilov S, Di Salvo E, Santin G, Sasaki T, Savvas N, Sawada Y, Scherer S, Sei S, Sirotenko V, Smith D, Starkov N, Stoecker H, Sulkimo J, Takahata M, Tanaka S, Tcherniaev E, Safai Tehrani E, Tropeano M, Truscott P, UnoH, Urban L, Urban P, Verderi M, Walkden A, Wander W, Weber H, Wellisch JP, Wenaus T, Williams DC, Wright D, Yamada T, Yoshida H, Zschiesche D. Geant4 - a simulation toolkit. Nuclear Instruments and Methods in Physics Research Section A. 2003; 506(3):250-303. http:// dx.doi.org/10.1016/S0168-9002(03)01368-8
Allison J, Amako K, Apostolakis J, Araujo H, Arce Dubois P, Asai M, Barrand G, Capra R, Chauvie S, Chytracek R, Cirrone GAP, Cooperman G, Cosmo G, Cuttone G, Daquino GG, Donszelmann M, Dressel M, Folger G, Foppiano F, Generowicz J, Grichine V, Guatelli S, Gumplinger P, Heikkinen A, Hrivnacova I, Howard A, Incerti S, Ivanchenko V, Johnson T, Jones F, Koi T, Kokoulin R, Kossov M, Kurashige H, Lara V, Larsson S, Lei F, Link O, Longo F, Maire M, Mantero A, Mascialino B, McLaren I, Mendez Lorenzo P, Minamimoto K, Murakami K, Nieminen P, Pandola L, Parlati S, Peralta L, Perl J, Pfeiffer A,. Pia MG, Ribon A, Rodrigues P, Russo G, Sadilov S, Santin G, Sasaki T, Smith D, Starkov N, Tanaka S, Tcherniaev E, Tomé B, Trindade A, Truscott P, Urban L, Verderi M, Walkden A, Wellisch P, Williams DC, Wright D, Yoshida H. Geant4 developments and applications. IEEE Transactions on Nuclear Science. 2006; 53(1):270-8. http://dx.doi. org/10.1109/TNS.2006.869826
Authors
Gabriela Hoff
Grupo de Experimentação e Simulação Computacional em Física Médica,
Pontifícia Universidade Católica do Rio Grande do Sul – PUCRS, Porto Alegre, RS, Brasil.
Paulo Roberto Costa*
Laboratório de Dosimetria das Radiações e Física Médica
Departamento de Física Nuclear, Instituto de Física, Universidade de São Paulo – USP, São Paulo, SP, Brasil. fundacentro.gov.br/dominios/ctn/teses_conteudo.
asp?retorno=153.
Archer BR, Hornby JI, Bushong SC. Diagnostic X-ray shielding design based on an empirical model of photon attenuation. Health Physics. 1983; 44(5):507-17. http:// dx.doi.org/10.1097/00004032-198305000-00005
Brasil RB. Study and projects application to system shield from PET/CT Facilities [thesis]. São Paulo: Universidade de São Paulo; 2009. 90 p.
Brinkley B, Yester M, White S. Calculation of broad beam transmission factor for 511 keV. Photons using energy spectra measured in the presence of scatter. In: 2009 AAPM Annual Meeting Program. Medical Physics. 2009; 36(6):2449.
Cruzate J, Discacciatti A. Shielding of medical facilities. Shielding design considerations for PET-CT facilities. In: Congress of the International Radiation Protection Association: Proceedings of the 12th Congress of the International Radiation Protection Association; 2008; Buenos Aires, Argentina. Buenos Aires; 2008.
Demir D, Keles G. Radiation transmission of concrete including boron waste for 59.54 and 80.99 keV gamma rays. Nuclear Instruments and Methods in Physics Research Section B. 2006; 245(2):501-4.
Elschot M, Wit TC, Jong HWAM. The inluence of self-absorption on PET and PET/CT shielding requirements. Medical Physics. 2010; 37(6):2999-3007. http://dx.doi. org/10.1118/1.3432618
Hoff G, Firmino SF, Souza WP. De. Inluence of shielding composition on transmission curves determination for diagnostic radiology: A Monte Carlo study using the GEANT4 code. In: IEEE Nuclear Science Symposium Conference Record: Proceedings of the Nuclear Science Symposium Conference Record; 2009; Orlando. Orlando: IEEE; 2009. p. 540-3.
Hubbell JH, Seltzer SM. Tables of X-ray mass attenuation coeficients and mass energy-absorption coeficients from 1
keV to 20 MeV for Elements Z = 1 to 92 and 48 additional substances of dosimetric interest. National Institute of Standard and Technology – NIST. Physical Reference Data; 1996. [cited 2012 May 05]. Available from: http://www. nist.gov/pml/data/xraycoef/index.cfm.
Hoff G, Pires de Souza W, Brasil RB, Costa PR. Simulating curves of transmission used on PET/CT applications, using Geant4 toolkit. In: IEEE Nuclear Science Symposium Conference Record: Proceedings of the Nuclear Science Symposium Conference Record; 2010; Knoxvile. Knoxvile: IEEE; 2010. p. 1199-202.
International Commission on Radiation Units and Measurements – ICRU. Report 44 - Tissue substitutes in radiation dosimetry and measurements. Maryland; 1989. p. 189.
Madsen MT, Anderson JA, Halama JR, Kleck J, Simpkin D, Votaw JR, Wendt III RE, Williams LE, Yester MV. AAPM Task Group 108: PET and PET/CT shielding requirements. Medical Physics. 2006. 33(1):4-15. http:// dx.doi.org/10.1118/1.2135911
National Council on Radiation Protection and Measurements – NCRP. Report 147 - Structural shielding design for medical X-ray imaging facilities. NCRP; 2005. p. 194.
Simpkin DJ. Shielding requirements for constant-potential diagnostic X-ray beams determined by a Monte Carlo calculation. Health Physics. 1989; 56(2):151-64. http:// dx.doi.org/10.1097/00004032-198902000-00002
Simpkin DJ. Transmission data for shielding diagnostic X-ray facilities. Health Physics. 1995; 68(5):704-9. http:// dx.doi.org/10.1097/00004032-199505000-00011