1 Departamento de Engenharia/UFLA, C.P. 3037, CEP 37200-000, Lavras, MG. Fone: (35) 3829-1210. E-mail: [email protected], [email protected]
2 Departamento de Agricultura/UFLA, C.P. 3037, CEP 37200-000, Lavras, MG. Fone: (35) 3829-1776. E-mail: [email protected]
3 Biomathematics and Statistics Scotland, Rowett Research Institute, Bucksburn, AB21 9SB, Aberdeen, Scotland, UK. Fone: +44 (0) 1224-438678. E-mail: [email protected]
Leaf area estimation of medium size plants
using optical metrology
Kleber M. Ribeiro1, Roberto A. Braga1, Myriane S. Scalco2 & Graham W. Horgan3
ABSTRACT
The total leaf area (TLA) estimation is an important feature of the crops and their assessment a challenge, since the direct methods of obtaining it are destructive and time consuming. Non-destructive methods have been explored to obtain the TLA by indirect approaches, in turn creating other features, as the leaf area index. The development of non-destructive technology to access the TLA of a plant has been the subject of much research, and the optical metrology is an promising approach. In this work, some indirect methods associated with optical approaches were evaluated as an alternative to obtain the TLA of the coffee plant. Commercial equipment were used, such as a camera with a fish eye lens and lux meters, associated to the sizes of the canopies were tested and compared to another non-destructive method and with methods proposed in the literature. The association between production and the TLA estimated was also evaluated. The results showed that the commercial equipment, generally used in forestry, was not the best approach in coffee plants, and that the methods related to the size and lux values of the plants were the best alternatives to estimate the TLA of the coffee plant.
Key words: optics, non-destructive technique , coffee
Estimativa da área foliar de plantas
de médio porte com metrologia óptica
RESUMO
A estimativa da área foliar total (AFT) é uma importante característica das culturas cuja avaliação é um desafio visto que métodos diretos de obtê-la são destrutivos e consome tempo. Métodos não destrutivos têm sido explorados com vista a se obter a AFT por meio de abordagens indiretas e, por sua vez, a criação de outros recursos, como o índice de área foliar. O desenvolvimento de tecnologia não destrutiva para acessar a AFT de uma planta tem sido objeto de muitas pesquisas e a metrologia óptica é uma abordagem promissora. Neste trabalho alguns métodos indiretos associados com as abordagens ópticas foram avaliados como alternativa para obtenção da AFT do cafeeiro. Equipamentos comerciais foram usados, como uma câmera com lente olho de peixe e medidas de lux, associadas às dimensões das copas, testados e comparados com outros métodos não destrutivos e com métodos propostos na literatura. A associação entre produção e a AFT estimada também foi avaliada. Os resultados mostraram que os equipamentos comerciais, geralmente utilizados em silvicultura, não se coadunam como as melhores aproximações para cafeeiros enquanto métodos relacionados às dimensões e valores de lux das plantas foram as melhores alternativas para estimar a AFT do cafeeiro.
Palavras-chave: óptica, técnica não destrutiva, cafeeiro v.17, n.6, p.595–601, 2013
I
ntroductIonThe leaf is an important plant organ related directly with the exchanges of gases between the plant and the atmosphere (Meadows & Hodges, 2002, Fournier et al., 2003, Cohen et al., 2003) which makes the quantitative study of leaf area a key approach to understanding many attributes of crops such as productivity, water consumption and their relationship with weather conditions and the influence of pathologies (Tavares Júnior et al., 2002; Favarin et al., 2002). It is also responsible for implementing energy balance (light, thermal and water) in the plant (Fournier et al., 2003).
The total leaf area of a plant is, in turn, measured or predicted by many approaches based on destructive and non-destructive methods respectively (Coelho Filho et al., 2005; Flumignan et al., 2008). One way to use leaf area information is by the adoption of the leaf area index (LAI) which is the relation of the leaf area with respect to the canopy projection in the soil expressed in m2 m-2 (Favarin et al., 2002, Bréda, 2003). Garrigues et al. (2008) considered the leaf area index (LAI) as a biophysical variable used in global models of climate, ecosystem productivity, biogeochemistry, hydrology, and ecology. In the same way, Stroppiana et al. (2006) considered the LAI as a key variable in models related to carbon and water dynamics.
There are many techniques to estimate the LAI or the total leaf area from isolated plants or from a forest. The techniques based on optical approaches are the most widely adopted and developed, considering their reliability in contrast with destructive methodologies (Stroppiana et al., 2006; Arias et al., 2007; Garrigues et al., 2008) which are hugely time consuming and are quite impossible to use in large and medium plants. Arias et al. (2007), in turn, used an optical instrument, the LAI-2000 (LI-COR, 1992), a plant canopy analyzer, to get the LAI and the plant area index (PAI), considering that equipment as “one of the most commonly used optical instruments to estimate LAI by measuring the amount of diffuse radiation that infiltrates the canopy”.
The use of LAI is relevant to get information in small plants as pointed out by Setiyono et al. (2008), where direct methods are most feasible considering the low number of leaves. Stroppiana et al. (2006) evaluated the LAI-2000 (LI-COR, 1992) to obtain the leaf area index in a paddy-rice (Oryza sativa L.) crop, and accounted for the saturation problems presented in the results related to the low density of the rice canopy. Simões et al. (2007) discussed the use of hemispherical photography to present an optical alternative to predict the LAI of olive trees in contrast to direct methods with total defoliation of the plants. Hemispherical photography was also presented by Jonckheere et al. (2004) as an optical alternative to get the LAI. The adoption of optical approaches in medium size crop plants are rare in the literature, and the few accounts observed, such as the report presented by Angelocci et al. (2007), used commercial equipment with modest amount of data, and without any possibility to get a satisfactory statistical treatment of the large variability usually observed in these sort of indirect analysis.
Therefore, the present study had the objective of evaluating the feasibility of optical approaches to estimate leaf area in
medium size plants, particularly in a coffee crop. The approaches considered were the LAI 2000, commercial equipment used in forestry studies, the digital images from a camera with fish eye lens based on the hemispherical photographs, the use of a lux meter device, and a model using physical size measurements of the plant. The samples used were from a commercial coffee crop with young and mature plants. The results of leaf area estimation from young plants were compared with a destructive method and other methods presented in the literature, and the results of leaf area estimation from mature plants were compared with production data.
M
aterIalandM
ethodsThe plants were from a crop of coffee with commercial characteristics in an area of 1920 m2 with about 1280 plants of the Topazio MG-1190 cultivar. The perennial plants were analysed in two different growth stages, young and mature.
In the young stage the aim was to create reliable models from optical techniques using the destructive method as a reference, in order to extend them to mature plants. The non-destructive techniques evaluated were light transmittance using a lux meter device, commercial equipment LAI-2000 (LI-COR, 1992), hemispherical photography using a fish eye lens and from plant size data. All the data assembled were validated by the use of a destructive method, considered as a standard.
The best models adjusted to young samples were extended to the mature plants and the evaluations of the models proposed realized, since use of the destructive method in whole mature plants can be considered a laborious task.
Forty-two young plants of coffee crop were observed with direct and indirect methods, and models were proposed comparing with the actual leaf area from the Leaf Area Meter (Li-Cor LI 3100) which has been shown to have a precision of 99% (LI-COR, 1996) compared with total defoliation measurement. The ranges of the canopies adopted in the work varied from 0.43 to 1.14 m high to young plants, and to mature plants from 1.32 to 2.44 m height.
In Figure 1, it is possible to see the transmittance approach which was conducted in order to evaluate the reduction of light intensity inside the tree after shading by the leaves.
The lux sensor was placed over and at the bottom of the canopy, and the values compared using the difference and
the ratio of the lux values, and considering the physics of the transmittance balance equations.
The indirect methods using the lux meter device associated with the size measurement of the plants were also evaluated in the estimate of the leaf area analysis, which the width and the height values were obtained manually.
Using LAI 2000, brand LICOR, the leaf area index was calculated with rings of 90° aperture and from two points of observation: four samples from 0.15 m above the soil inside the plants, and four samples above the young plants, about 1.6 m above the soil.
The hemispherical photographs were captured using the experimental configuration presented in Figure 2, where it is possible to see one approach on the top and another on the interior of the canopy to two different coffee plants.
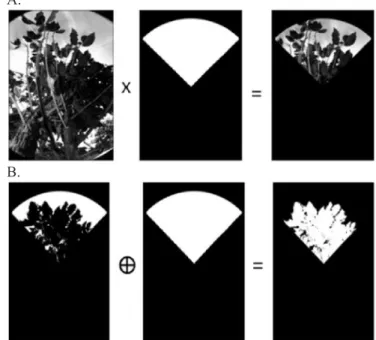
In the latter approach, from the interior of the canopy, four views were used to get the whole image of the plant, as illustrated in the Figure 3. Each view (Figure 3) was obtained
using an image procedure which is presented in the Figure 4, where Figure 4A illustrates the preparation of the photograph which creates the sector portion, and Figure 4B illustrates the image processing to threshold the image of the leaves from the background of the photograph.
A.
B.
Figure 2. Experimental configuration of the hemis-pherical photography method to two different coffee trees, a smaller (A) and another bigger (B)
Figure 3. Approaches to obtain and to assemble the four image sectors when the photography is done under the canopy of the tree
A.
B.
Figure 4. Image processing (A) to obtain the sector image and (B) to get the threshold for separating leaves from the background
The plant sizes model was proposed by Marcon et al. (2011) where the width and height data of the coffee trees, assembled manually, are used to estimate the leaf area.
In addition, data from the harvest of the mature crop was evaluated with the proposed models as a first attempt to compare one feature of the crop to the leaf area models.
r
esultsandd
IscussIonThe model proposed by Marcon et al. (2011) using the height and width values produced an R2 equal to 0.61. A readjustment of the model using the minimum square method resulted in the Eq. 1, which presented a correlation index of 0.825 with relation to the actual leaf area from LICOR (Li-Cor LI 3100).
The association of the values from the lux meter device with the width and height measurements of the plants presented better results if compared to the use of the models separately. The Eqs. 2 and 3 describe mathematically the models adjusted to estimate the leaf area by difference and ratio of the lux values (inside and outside the plants) associated to the sizes of the plants, respectively.
LA= −5 364. x2−1 387. y2+8 813. x+2 368. y−4 851.
As discussed by Marcon et al. (2011), this method is robust and requires low cost equipments, thereby it can be implemented to measure the plant manually or using images.
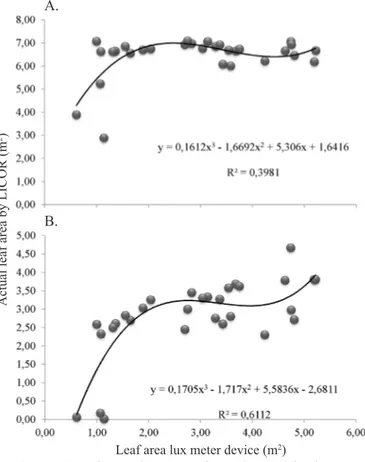
The Figure 5 present the result of the model constructed with the lux meter device and the LICOR (Li-Cor LI 3100) to predict the values of the actual leaf area.
The values from the lux meter device used the transmittance concept with the result from the difference (Figure 5A) or ratio (Figure 5B) between the light outside of the canopy and the light inside the canopy. The model of leaf area using the difference lux values presented a R² of 0.398, while that using the ratio lux values were of 0.613.
Figure 5. Relation between the values of leaf area constructed from a model using the difference (A) and the ratio (B) lux meter device, and the LICOR (Li-Cor LI 3100) with the values of the actual leaf area
g w h lux
(
, ,)
=0 59. ln(
LUXtop−LUXinside)
width heigh⋅g w h lux LUX
LUX width heigh
inside top
, , . ln
(
)
= −
⋅
0 80
where:
0.59 and -0.80 values represent an adjustment of the g (w, h, lux) function to get the best fit with reference to the actual leaf area from the destructive method.
The model that use the values difference of the lux associated to the size of the plant (Eq. 2) presented an R² of 0.806, while that the values ratio of the lux (Eq. 3) showed an R² of 0.764, as illustrated in the Figure 6.
The results of the lux meter device associated to the plant size can be considered as reliable, mainly considering the adoption of a non-destructive method and the easiness of the data collection.
Figure 6. Relation between the difference (A) and the ratio (B) of the lux values weighted with measurements of the plant and the LICOR (Li-Cor LI 3100) with the actual leaf area values
A.
B.
Actual leaf area by LICOR (m
2)
Leaf area lux meter device (m2)
(1)
(2)
(3)
A.
B.
Actual leaf area by LICOR (m
2)
In addition, the correlation of this method with the plant size model presented an R2 of 0.958, which shows that the lux meter device model could be used as an alternative to the model using the sizes to forecast the leaf area in young coffee plants.
The best result obtained from the use of LAI 2000, brand LICOR, in relation to the actual leaf area from LICOR (Li-Cor LI 3100) was from the cubic model, with an R2 of 0.302. In Figure 7 it is possible to see the dispersion of the data.
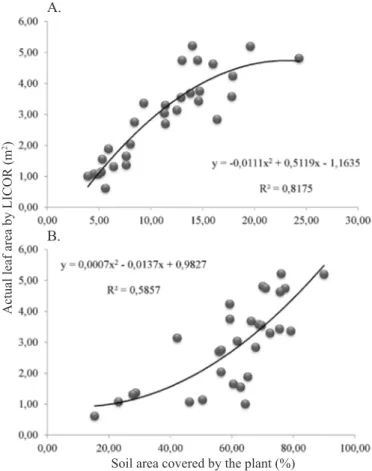
The hemispherical photography results are summarized in the Figure 8. The values of the leaf area that covers the soil, by the aerial photography using the camera and the fish eye lens, are presented in Figure 8A and the view of the leaves from the bottom of the plant, inside its canopy, can be seen in the Figure 8B.
Figure 7. Relation between the LAI index produced by LAI 2000, brand LICOR, with the actual leaf area from LICOR (Li-Cor LI 3100)
In order to understand the dispersion presented in the results, some tests were conducted and showed the result of two plants with the same LAI, from LAI 2000, brand LICOR, but with different structure and total leaf area as well. The LAI of 3.88 m2 m-2 in both plants using LAI 2000, was obtained from plants
with different structures and total leaf areas, in which the first plant had a total leaf area of 1.36 m2 (Figure 2A) and the second coffee plant 3.29 m2 of total leaf area (Figure 2B).
Among the methods tested the worst results was with use of commercial equipment (LAI 2000, brand LICOR), normally used in forestry LAI analysis. In turn, in medium size plants, such as coffee, the correlation of the LAI with total leaf area proved to be unreliable. It was observed, in addition, that plants with the same values of LAI, produced by LAI 2000, presented distinct values of total leaf area as observed in Figure 2, since the LAI number produced by that equipment does not consider the structure of the plant directly, such as branches, stems, trunks, flowers and fruits (Cutini et al., 1998; Kucharik et al., 1998), and which creates some difficulty to relate the LAI to the total leaf area. The great dispersion from the comparison of LAI 2000 numbers with the actual leaf area proves that hypothesis.
The LAI 2000 equipment presented itself as a non-fitted instrument to be adapted to medium size plants and to be adjusted to obtain information useful to leaf area estimation, which goes against the observations of Weiss et al. (2004) that reported problems in the use of LAI 2000 in row crops and with large scale clumping, as the coffee plants. In this context, despite the widespread use of LAI 2000 in forestry research, the known protocol to use the LAI in medium size plants cannot be considered as a reference yet.
A.
B.
Figure 8. Relation between the leaf area covering the soil from aerial view by the fish eye lens (A) and the calculated by the from below the plant, inside its canopy, (B) and the actual leaf area from LICOR (Li-Cor LI 3100)
As observed in Figure 8A, the relation of the leaf area from aerial photography with actual leaf area from the destructive method is modeled as a second order function with R2 = 0.817, while the relation between the leaves from the bottom of the plant and the LICOR (Li-Cor LI 3100) data (Figure 8B) presented a second order function with R2 = 0.585. The curve
which best fitted to the data was exponential (y = 0.534e0.025x) with R2 = 0.599.
The values from the digital images from the top and the bottom of the canopies using the fish eye lens presented intermediate correlations when compared with the other three methods. The images from below the plant canopy suffered from the problem of the high density of leaves, called the clumping effect by Ryu et al. (2010), which caused wide variations in the values obtained with only small variations in the position of the camera and makes it hard to quantify correctly. In turn, despite the better response of the images from above, the use of this method in mature plants offers the additional challenge of physically positioning the camera. Finally, the use of a fish
Actual leaf area by LICOR (m
2)
Leaf area index LAI-2000 (m2 m-2)
Actual leaf area by LICOR (m
2)
eye lens produces distorted images that can create different values depending on the structure of the canopy.
Without the facility of total defoliation as applied to the young plants, the leaf area of mature plants was estimated by the two best models tested in young samples. The Figure 9 present the relation between the models, where the x axis is from the WH modified model (Eq. 1) and the y axis is from the lux meter device data processed using the transmittance concept and weighted with plant measurements (Eqs. 2 and 3).
an additional problem for the use the commercial equipment, which gives different values of LAI with small variations of position inside the canopy, making the use of this equipment impossible as a reliable tool, even with the account of Angelocci et al. (2007), who used similar equipment, and using trees with high homogeneity, but without any possibility to get statistical validation of the large variability usually observed in these sort of indirect analyses.
The mature plants blocks, irrigated and non-irrigated, had their production, in kilograms, predicted with the lux meter device model as presented in Figure 10. The relation between them presented R2 of about 0.4.
A.
B.
Figure 9. Relation between the two models developed for young plants, difference (A) and ratio (B) of the lux values associated to the plant sizes and WH modified model extended to mature coffee plants
The difference of the lux values weight with plant sizes in the model presented better relation with WH modified model when compared with the ratio of the lux values associated with plant measurements in the model, with correlation indices of 0.911 and 0.891 to the irrigated and non-irrigated clusters respectively.
This correlation was lower than obtained in the young plants, but nevertheless led us to consider them as feasible approaches to analyse leaf area without destructive tests, and additionally with low cost. In addition, the high correlation between the models highlights that the difference of the lux values combined with plant sizes in the model can substitute the WH modified model in leaf analysis. The challenge from now on will be to create the best weight of the lux values in the model, mainly by the use of actual data of defoliation.
In mature coffee plants, the high density of leaves in the canopy, starting from the soil to the top of the plant, presents
Figure 10. Correlation between the productions of coffee trees with the lux model to estimate leaf area
The comparison of the data from the coffee harvest with the leaf area models separated two distinct clusters related to irrigated and non-irrigated parcels. However, the variability of the productivity observed in the results, as a function of leaf area, can be explained by the complexity involved in the productivity of a perennial crop such coffee, which depends on a series of factors besides leaf area, such as the weather conditions, the periodicity of the coffee plant, the management of the crop and many other factors, as described by da Rosa et al. (2010). Nevertheless, leaf area estimation by a robust and fast approach, such as that presented here, will offer to researchers and farmers an additional tool to manage and evaluate the condition of the crop and its response to treatments they investigate.
c
onclusIons1. The evaluation of optical approaches to estimate leaf area in a medium size plant, in particular in a commercial coffee crop, presented feasible alternatives to destructive techniques.
2. The use of a lux meter device, and a model using the sizes of the plant presented high correlation in young plants.
3. The digital images from a camera with a fish eye lens
presented values of leaf area with feasible results only with images taken from above young trees.
4. The LAI 2000 equipment presented low correlation to actual leaf area, and some incoherencies within the samples of young plants.
Dif
ference lux model (m
2)
WH model modified (m2)
Production (kg)
Lux area lux (m2)
Ratio lux model (m
5. Theforecasting crop production by the proposed methods presented a positive correlation.
a
cknowledgeMentsResearch partly financed by CAPES, CNPq, FAPEMIG FINEP, and partly supported by the Scottish Government Rural and Environment Science and Analytical Services division.
l
Iteraturec
ItedAngelocci, L. R.; Marin, F. R.; Pilau, F. G.; Righi, E. Z.; Favarin, J. L. Radiation balance of coffee hedgedrows. Revista Brasileira de Engenharia Agrícola e Ambiental, v.12, p.274-281, 2007.
Arias, D.; Calvo-Alvarado, J.; Dohrenbusch, A. Calibration of LAI-2000 to estimate leaf área índex (LAI) and assessment of its relationship with stand productivity in six native and introduced tree species in Costa Rica. Forest Ecology and Management, v.247, p.185-193, 2007.
Bréda, N. J. J. Ground-based measurements of leaf area index: a review of methods, instruments and current controversies. Journal of Experimental Botany, v.54, p.2403-2417, 2003. Coelho Filho, M. A.; Angelocci, L. R.; Vasconcelos, M. R. B.;
Coelho, E. F. Estimativa da área foliar de plantas de lima ácida ‘Tahiti’ usando métodos não-destrutivos. Revista Brasileira de Fruticultura, v.27, p.163-167, 2005.
Cohen,W. B.; Maiersperger, T. K.; Gower, S. T.; Turner, D. P. An improved strategy for regression of biophysical variables and Landsat ETM+ data. Remote Sensing of Environment, v.84, p.561-571, 2003.
Cutini, A.; Matteucci, G.; Mugnozza, G. S. Estimation of leaf area index with the Li-Cor LAI 2000 in deciduous forests. Forest Ecology and Management, v.105, p.55-65, 1998. Favarin, J. L.; Dourado Neto, D.; García, A. G. Y.; Nova, N.
A. V.; Favarin, M. G. G. V. Equações para a estimativa do índice de área foliar do cafeeiro. Pesquisa Agropecuária Brasileira, v.37, p.769-773, 2002.
Flumignan, D. L.; Adami, M.; Faria, R. T. Área foliar de folhas íntegras e danificadas de cafeeiro determinada por dimensões foliares e imagem digital. Coffee Science, v.3, p.1-6, 2008.
Fournier, R. A.; Mailly, D.; Walter, J. M.; Soudani, K. Indirect measurement of forest canopy structure from in situ optical sensors. In: Wulder, M.; Franklin, S. (ed.), Methods for remote sensing of forests: Concepts and case studies. Dordrecht: Kluwer Academic Press, 2003. p.77-114. Garrigues, S.; Shabanov, N. V.; Swanson, K.; Norisette, J. T.;
Baret, F.; Myneni, R. B. Intercomparison and sensitivity analysis of Leaf Area Index retrievals from LAI-2000, AccuPAR, and digital hemispherical photography over croplands. Agricultural and Forest Meteorology, v.148, p.1193-1209, 2008.
Jonckheere, I.; Fleck, S.; Nackaerts, K.; Muys, B.; Coppin, P.; Weiss, M.; Baret, F. Review of methods for in situ leaf area index determination: Part I. Theories, sensors and hemispherical photography. Agricultural and Forest Meteorology, v.121, p.19-35, 2004.
Kucharik, C. J.; Norman, J. M.; Gower, S. T. Measurements of branch area and adjoining leaf area index indirect measurements. Agricultural and Forest Meteorology, v.91, p.69-88, 1998.
LI-COR Inc. LAI-2000 Plant canopy analyzer instruction/ operating manual. Lincoln: LI-COR, 1992. 217p.
Li-COR 3100 Area meter instruction manual. Lincoln: LI-COR, 1996. 34p.
Marcon, M.; Ribeiro, K. M.; Braga, R. A.; Paglis, C. M.; Scalco, M. S.; Horgan, G. J. Estimation of total leaf area in perennial plants using image analysis.Revista Brasileira de Engenharia Agrícola e Ambiental, v.15, p.96-101, 2011. Meadows, J. S.; Hodges, J. D. Sapwood area as an estimator
of leaf area and foliar weight in cherrybark oak and green ash. Forest Science, v.48, p.69-76, 2002.
Rosa, V. G. C. da; Moreira, M. A.; Rudorff, B. F. T.; Adami, M. Estimativa da produtividade de café com base em um modelo agrometeorológico-espectral. Pesquisa Agropecuária Brasileira, v.45, p.1478-1488, 2010.
Ryu Y.; Nilson, T.; Kobayashi, H.; Sonnentag, O.; Law, B. E.; Baldocchi, D. D. On the correct estimation of effective leaf area index: Does it reveal information on clumping effects? Agricultural and Forest Meteorology, v.150, p.463-472, 2010.
Setiyono, T. D.; Weiss, A.; Specht, J. E.; Cassman, K. G.; Dobermann, A. Leaf area index simulation in soybean grown under near-optimal conditions. Field Crops Research, v.108, p.82-92, 2008.
Simões, M. P.; Pinto-Cruz, C.; Belo, A. F.; Ferreira, L. F.; Neves, J. P.; Castro, M. C. Utilização de fotografia hemisférica na determinação do índice de área foliar de oliveiras jovens (Olea europaea L.). Revista de Ciência Agrárias, v.30, p.527–534, 2007.
Stroppiana, D.; Baschetti, M.; Confalonieri, R.; Bocchi, S.; Brinio, P. A. Evaluation of LAI-2000 for leaf area index monitoring in paddy rice. Field Crops Research, v.99, p.167-170, 2006.
Tavares Júnior, J. E.; Favarin, J. L.; Dourado Neto, D.; Maia, A. H. N.; Fazuoli, L. C.; Bernardes, M. S. Análise comparativa de métodos de estimativa de área foliar em cafeeiro. Bragantia, v.61, p.199-203, 2002.