Constanza Soledad Carrera(1), Cora Marcela Reynoso(2), Gustavo Javier Funes(2), María José Martínez(1), Julio Dardanelli(1)andSilvia Liliana Resnik(3)
(1)Instituto Nacional de Tecnología Agropecuaria,Estación Experimental Manfredi, 5988 Manfredi, Córdoba, Argentina. E‑mail: [email protected],
[email protected], [email protected] (2)Universidad de Buenos Aires, Facultad de Ciencias Exactas y Naturales,
Departamento de Química Orgánica, Ciudad Universitaria, Intendente Güiraldes 2160, 1428 Ciudad Autónoma de Buenos Aires, Argentina. E‑mail: [email protected], [email protected] (3)Comisión de Investigaciones Científicas de la Provincia de Buenos Aires,
Calle 523, entre 10 y 11, 1900 La Plata, Provincia de Buenos Aires, Argentina. E‑mail: [email protected]
Abstract – The objective of this work was to perform a quantitative analysis of the amino acid composition of soybean seeds as affected by climatic variables during seed filling. Amino acids were determined from seed samples taken at harvest in 31 multi‑environment field trials carried out in Argentina. Total amino acids ranged from 31.69 to 49.14%, and total essential and nonessential amino acids varied from 12.83 to 19.02% and from 18.86 to 31.15%, respectively. Variance components expressed as the percentage of total variation showed that the environment was the most important source of variation for all traits, followed by the genotype x environment interaction. Significant explanatory linear regressions were detected for amino acid content regarding: average daily mean air temperature and cumulative solar radiation, during seed filling; precipitation minus potential evapotranspiration, during the whole reproductive period; and the combinations of these climatic variables. Each amino acid behaves differently according to environmental conditions, indicating compensatory effects among them.
Index terms: Glycine max, environmental variation, multiple linear regression, multi-environment trials, protein composition.
Conteúdo de aminoácidos em sementes de soja em função
de variáveis climáticas
Resumo – O objetivo deste trabalho foi realizar uma análise quantitativa da composição de aminoácidos de sementes de soja em função de variáveis climáticas, durante o período de formação do grão. Foram analisados os aminoácidos de amostras de sementes colhidas no momento da colheita a partir de 31 ensaios multiambientais realizados a campo na Argentina. Os aminoácidos totais variaram de 31,69 a 49,14%, e o total de aminoácidos essenciais e não essenciais variou de 12,83 a 19,02% e de 18,86 a 31,15%, respectivamente. Os componentes de variância expressos como percentagem da variação total mostraram que o ambiente foi a fonte de variação mais importante, seguido da interação genótipo x ambiente. Regressões lineares significativas foram detectadas para o conteúdo de aminoácidos em relação a: temperatura média diária do ar e radiação solar acumulada, durante a formação dos grãos; precipitação menos evapotranspiração potencial, durante todo o período reprodutivo; e combinações dessas variáveis climáticas. Cada aminoácido comporta-se de forma diferente de acordo com as variações nas condições ambientais, o que indica efeitos compensatórios entre eles.
Termos para indexação: Glycine max, variação ambiental, regressão linear múltipla, ensaios multiambientais, composição de proteínas.
Introduction
Soybean [Glycine max (L.) Merr.] seed is a major source of protein worldwide. The average protein content of soybean reaches 40%, whereas, in most common beans, this value is of 20 to 25% (Mateos-Aparicio et al., 2008). Consequently, soybean meal is a valuable and desirable product for both human nutrition and livestock feeding, since it contains all essential amino acids and has low cost compared to other high-quality
protein sources. Therefore, the study of soybean amino acid composition is important for nutritional purposes and for consumer acceptance of soy food products, as it contributes to the taste of foodstuffs (Gao et al., 2011).
radiation and temperature. Multi-environment trials are usually conducted to compare grain yield performance of a large number of genotypes, but could be useful to assess environmental effects on seed chemical composition.
It has been widely documented that soybean seed composition varies with environmental factors,
especially during the seed filling period when
accumulation of the seed chemical components occurs
(Wolf et al., 1982; Wilson, 2004; Carrera et al., 2009,
2011). The relationship of protein contents (the sum of all amino acids) with temperature (Piper & Boote,
1999; Wilson, 2004) and water availability (Rose, 1988; Boydak et al., 2002; Kumar et al., 2006; Carrera
et al., 2009) has also been studied, but results have shown dissimilar patterns. Therefore, it is interesting to analyze the response of each amino acid to different climatic variables, because their behavior could contribute to explain these discrepancies. Some researchers have reported the effect of temperature on soybean seed amino acid composition. For example, Wolf et al. (1982) found that higher deposition of sulfur amino acids (methionine and cystine) takes place at higher temperatures. Grieshop & Fahey (2001)
and Karr‑Lilienthal et al. (2005) reported that essential,
nonessential, and total amino acid content were lower in northern zones of the United States, which are cooler than central and southern zones.
In spite of these findings, there are no known
quantitative studies on the effect of temperature,
solar radiation and water deficit during seed filling
on the nutritional composition and quality of soybean seed protein. About 90% of the world’s soybean production occurs under rainfed conditions, which are characterized by high temperatures and low or erratic rainfall (Thuzar et al., 2010). Given the current
trend of rising temperatures, droughts, floods and
extreme weather events (Intergovernmental Panel on Climate Change, 2009), the exposure of the crop to thermal and water stresses will increase. For an initial understanding of the direct effects of climatic variables
on amino acid composition, multi‑environment field
trials are highly valuable because they capture the environmental effects between and within years and locations.
The objective of this work was to analyze amino acid composition of soybean seeds as affected by climatic
variables during seed filling.
Materials and Methods
A data set was constructed from 31 soybean
multi‑environment field trials conducted during
two crop years (2001/2002 and 2002/2003) at the agricultural experimental stations of Instituto Nacional de Tecnología Agropecuaria (Inta), across the Argentine soybean growing regions. The trials were set in a randomized complete block design with
three replicates, in each environment, defined as crop
year, location, and sowing date combinations. The trial network involved commercial cultivars from several maturity groups sown at different locations and sowing dates per growing season (Table 1). The following cultivars were evaluated (maturity group is
given between parentheses): DM 3100 RR (III), DM 3700 RR (III), DM 4400 RR (IV), DM 4600 RR (IV), DM 4800 RR (IV), A 5520 RG (V), A 6445 RG (VI),
A 7636 RG (VII), and A 8000 RG (VIII). The database was constructed so as to capture the highest possible environmental variability without intending to have all cultivars in all environments. Soil analyses did not indicate any physical or nutritional constraint for crop development. Crops were grown under rainfed conditions and followed cultural practices recommended by Inta (Baigorri, 1997). Final plant density in all trials was about 35–40 plants per square meter, with 0.52 m between rows.
Table 1. Crop seasons, locations, and sowing dates of 31 multi‑environment field trials conducted in the Argentine soybean crop area.
Location Coordinates Sowing date (day of the month) Sep. Oct. Nov.Dec.Jan. Feb.
2001/2002 crop season Concepción del Uruguay 32º29', 58º14' - - 22 - - 5 General Pico 35º40', 63º44' - 5 - - 3 -Manfredi 31º49', 63º46' - 12 27 - - -Marcos Juárez 32º41', 62º06' 12 - - 5 - -Paraná 31º44', 60º32' 23 - 12 - 12
-Temperature and solar radiation data were recorded daily for each crop season and site at Inta meteorological stations, up to 10 km away from each
experimental field. Rainfall records were obtained from
rain gauges placed in each experimental plot site, and potential evapotranspiration was calculated using the
Penman (1948) equation. Dates of occurrence of R1 (beginning of flowering), R5 (beginning of seed filling),
and R7 (physiological maturity) were assessed in the
field, at every trial, using the scale of Fehr & Caviness
(1977). From the daily climatic data, the following
variables were generated for each environment: average daily mean air temperature during seed filling
(TmR5R7); cumulative solar radiation during seed filling
(SrR5R7), calculated as the sum of daily solar radiation
in that period; and precipitation minus potential
evapotranspiration during the whole reproductive period (pp-PETR1R7). The variable pp-PETR1R7 was
used as a simple indicator of water availability in the evaluated period, since water balance from the whole reproductive period considers water storage in the soil
profile, which could influence water availability during grain filling (Carrera et al., 2009).
For all determinations, a randomized 300-g grain sample was made using the collected samples at harvest from the three replicates of each cultivar, at each location and sowing date. Amino acid content (expressed as percentage, in dry matter basis) was analyzed in triplicate, using oxidation and acid and alkaline hydrolysis methods for sulfur amino acids. Acid hydrolysis, alkaline hydrolysis, and oxidation of sulfur amino acids were made according to the
procedures described in AOAC official method 982.30,
988.15, and 994.12, respectively (Horwitz, 2005), with
the following modifications: after acid hydrolysis, the sample was transferred quantitatively to a 10‑mL flask with buffer pH 9.5 (0.4 N sodium borate); after alkaline
hydrolysis, the sample was transferred quantitatively
to a 50‑mL flask, with pH adjusted using a 2 N HCl solution, completed with water; after oxidation of sulfur amino acids, the open flask was heated with 5 mL of 6 N
HCl in the Pierce thermo bath during 1 hour at 113±1ºC. The next steps were the same as those of acid hydrolysis.
Then, 500 μL of each extract was mixed with 500 μL of the internal standard (sarcosine 20 μg mL-1 plus
dl‑norvaline 20 μg mL-1, in 0.01 mol L-1 HCl). Amino
acid concentrations were determined using a liquid chromatograph Agilent 1100, high performance
resolution, (Agilent Technologies, Wilmington,
DE, USA) with a fluorescence detector, quaternary
pump and a degasser. Separation was achieved using a Adsorbosphere OPA HS column (100x4.6 mm,
5 μm) for primary amino acids, and a Adsorbosphere OPA HR column (150x4.6 mm, 5 μm) for proline
(pro), hydroxyproline (HO-pro) and tryptophan (trp).
Both columns had a BDS‑Hypersil‑C18 pre‑column (10x4 mm, 5 μm). Flow rate was 1 mL min-1, and
column temperature was maintained at 40ºC during the run. Amino acids were analyzed using different pre-column derivatization methods and mobile phases. For primary amino acids and trp, a derivatization method with o-phthaldialdehyde-2-mercaptoethanol
was used. The mobile phase was: A, tetrahydrofuran (20% in MeOH); B, MeOH; and C, sodium acetate
buffer 60 mmol L-1, pH 5.5. For pro and HO-pro,
the derivatization method was performed with o-phthaldialdehyde-3-mercaptopropionicacid and
9‑fluorenylmethyl‑chloroformate. The mobile phase was: B, MeOH; and C, sodium acetate buffer
60 mmol L-1, pH 5.5; all solvents were of high
performance liquid chromatography purity. Primary amino acids and trp were detected at 230 and 450 nm, and pro and HO-pro at 266 and 313 nm, respectively. Calibration curves were obtained using standard amino acid solution purchased from Pierce (Rockford, IL, USA), which contained all the amino acids [cysteine (cys), aspartate (asp), glutamate (glu), serine (ser), histidine (his), glycine (gly), threonine (thr), methionine (met), alanine (ala), arginine (arg), tyrosine (tyr), valine (val), phenylalanine (phe), isoleucine (ileu), leucine (leu), lysine (lys), and proline (pro)], except trp and HO-pro, purchased from Sigma-Aldrich (St. Louis, MO, USA) and from Fluka Chemie (Steinheim, Germany), respectively. The standard amino acid working solution was prepared in 0.1 N HCl. Ten concentration levels from the amino acid solution and 12 levels for pro and HO-pro were used for calibration curves. Methionine and cystine
were quantified as methionine sulfone and cysteic acid and calculated as sulfur amino acids. For quantification,
peak areas were correlated with the concentrations according to calibration curves (R2>0.99). The relative
standard deviation (RSD) was less than 3%, except for
ser, his, gly, thr, met, ala, arg, tyr, trp, val, phe, ileu, leu, lys, HO-pro, and pro). The variable total essential amino acids (TEAA) was determined by summing the contents of arg, his, ileu, leu, lys, met, phe, thr, trp, and
val; whereas total nonessential amino acids (TNEAA)
were generated by summing ala, asp, cys, glu, gly, pro, ser, tyr, and HO-pro concentrations. All determinations were made at theDepartamento de Química Orgánica of Facultad de Ciencias Exactas y Naturales, Universidad de Buenos Aires, Argentina.
A multiple linear regression procedure was performed to model all the analyzed amino acids (cys, asp, glu, ser, his, gly, thr, met, ala, arg, tyr, trp, val, phe, ileu, leu, lys, HO-pro, and pro) as a function of TmR5R7, SrR5R7 and pp-PETR1R7, and as a function of
the combinations of these climatic variables (TmR5R7
with pp-PETR1R7; SrR5R7 with pp-PETR1R7). The t test,
at 5% probability, was used on regression parameter estimates. Model selection was based on Mallows’ Cp
coefficient and residual analyses. All calculations were made with the statistical software InfoStat (Di Rienzo
et al., 2009).
Results and Discussion
Mean values for individual amino acids (Table 2) were close to those reported by Grieshop & Fahey
(2001) and Karr‑Lilienthal et al. (2004). Although these
authors observed higher TEAA values, in the present study mean TNEAA values were higher. Interestingly, even though TNEAA are less important for human and livestock nutrition than TEAA, they markedly contributed to TAA (Table 3).
A high variability (coefficient of variation)
was observed in all individual amino acid compositions (Table 3). Likewise, a large variation of temperature (14.1 to 25.7ºC), solar radiation (240 to 1,676.7 MJ m-2) and water availability (-262 to
410.5 mm) was obtained in the multi-environmental
field trials. This was reflected in the high yield
variability, which had approximately 6-fold variation, from 885 to 5,571 kg ha-1. Differences between
extreme values across the data points (cultivar x
environment combinations) during seed filling were
11.6ºC for temperature and 1,436 MJ m-2 for solar
radiation, whereas the extreme values of precipitation minus potential evapotranspiration during the whole reproductive period differed in 673.2 mm.
Significant explanatory regressions were obtained
for all amino acids on TmR5R7, SrR5R7 and pp-PETR1R7, as
well as on the combinations of these climatic variables (TmR5R7 with pp-PETR1R7, and SrR5R7 with pp-PETR1R7).
The only exception was valine, whose variations were not explained by any of these environmental factors. A quadratic regression including TmR5R7 was the
best explanatory model for this amino acid, although
temperature was not a significant predictor (Table 4). Polynomial‑quadratic functions were fitted for ileu,
met, phe, ala, glu, pro vs. TmR5R7, and a linear model for
aspartate vs. TmR5R7 (Tables 4 and 5). The regression
fitted for these amino acids indicated that all of them
increased with increasing values of TmR5R7 until a
threshold was achieved, after which they decreased. However, the temperature above which each amino
acid started to decrease varied among them (pro, 22ºC; phe, 21ºC; glu, 20ºC; met, 19ºC; and ala and ileu, 16ºC).
By contrast, lysine concentration showed an inverse relationship with temperature (Table 4), decreasing with increasing temperature of 14.1 to 22ºC, after when it began to increase. Aspartate increased linearly with temperature (Table 5). Regression equations for leucine and cystine showed a linear positive contribution for pp-PETR1R7 and a linear and quadratic one for TmR5R7.
In addition, pp-PETR1R7 had the highest contribution
(Mallows’ Cp) in the fitted regression model. For both amino acids, the regression coefficients for pp‑PETR1R7
and TmR5R7 indicated that leucine and cystine increased
with higher water availability (increasing pp-PETR1R7
values) and temperature. However, temperature had less effect at higher TmR5R7 values because of its
negative quadratic effect on amino acid contents. These results do not agree with previous studies. Wolf et al. (1982), for example, found that only methionine and cystine (sulfur amino acids) increased with higher temperatures in the beginning of soybean seed development. Grieshop & Fahey (2001) and
Karr‑Lilienthal et al. (2005) reported that TEAA,
TNEAA, and TAA concentrations were lower for soybean meal from northern zones of the United States compared to central and southern zones. These authors
attributed their findings to differences in temperature
considered the effect of temperature on amino acid composition without exploring other environmental
factors. Disagreements among the findings of the present
study and of previous reports could be explained, in part, by the inclusion of other environmental factors
in regression analyses. Significant explanatory models
showed different behaviors for each amino acid against temperature and, in some cases, water availability combined with temperature. Another important point is that previous analyses were made in a qualitative manner, which makes the interpretation of the effect of environment on amino acid composition more
difficult.
The results obtained indicate compensatory effects among amino acids, which could explain to some extent the lack of relation between TAA and the climatic variables considered in the present study. Piper & Boote (1999) and Carrera et al. (2009) reported, in
field studies, that a small fraction of the variation (R2)
accounted for protein concentration, which considers the sum of all amino acids versus temperature during
the seed filling period. However, this could be also
attributed to the compensatory responses. Carrera et al. (2009) found that the response of protein to TmR5R7 was
explained through a quadratic model, which indicated that protein percentage decreased, with increasing
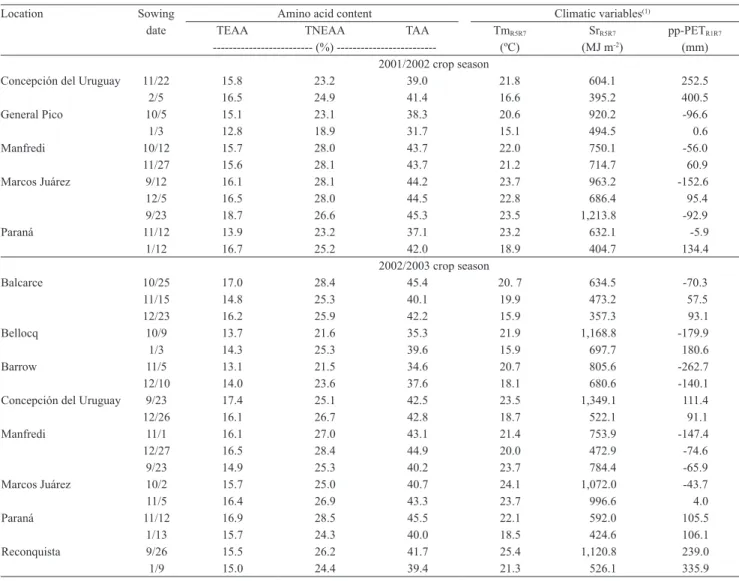
Table 2. Content (% of dry matter) of total amino acids (TAA), and total essential (TEAA) and nonessential amino acids (TNEAA), and climatic variables of the 31 multi‑environment field trials evaluated.
Location Sowing Amino acid content Climatic variables(1)
date TEAA TNEAA TAA TmR5R7 SrR5R7 pp-PETR1R7
--- (%) --- (ºC) (MJ m-2) (mm)
2001/2002 crop season
Concepción del Uruguay 11/22 15.8 23.2 39.0 21.8 604.1 252.5 2/5 16.5 24.9 41.4 16.6 395.2 400.5 General Pico 10/5 15.1 23.1 38.3 20.6 920.2 -96.6 1/3 12.8 18.9 31.7 15.1 494.5 0.6 Manfredi 10/12 15.7 28.0 43.7 22.0 750.1 -56.0 11/27 15.6 28.1 43.7 21.2 714.7 60.9 Marcos Juárez 9/12 16.1 28.1 44.2 23.7 963.2 -152.6 12/5 16.5 28.0 44.5 22.8 686.4 95.4 9/23 18.7 26.6 45.3 23.5 1,213.8 -92.9 Paraná 11/12 13.9 23.2 37.1 23.2 632.1 -5.9 1/12 16.7 25.2 42.0 18.9 404.7 134.4
2002/2003 crop season
Balcarce 10/25 17.0 28.4 45.4 20. 7 634.5 -70.3 11/15 14.8 25.3 40.1 19.9 473.2 57.5 12/23 16.2 25.9 42.2 15.9 357.3 93.1 Bellocq 10/9 13.7 21.6 35.3 21.9 1,168.8 -179.9 1/3 14.3 25.3 39.6 15.9 697.7 180.6 Barrow 11/5 13.1 21.5 34.6 20.7 805.6 -262.7 12/10 14.0 23.6 37.6 18.1 680.6 -140.1 Concepción del Uruguay 9/23 17.4 25.1 42.5 23.5 1,349.1 111.4 12/26 16.1 26.7 42.8 18.7 522.1 91.1 Manfredi 11/1 16.1 27.0 43.1 21.4 753.9 -147.4 12/27 16.5 28.4 44.9 20.0 472.9 -74.6 9/23 14.9 25.3 40.2 23.7 784.4 -65.9 Marcos Juárez 10/2 15.7 25.0 40.7 24.1 1,072.0 -43.7 11/5 16.4 26.9 43.3 23.7 996.6 4.0 Paraná 11/12 16.9 28.5 45.5 22.1 592.0 105.5 1/13 15.7 24.3 40.0 18.5 424.6 106.1 Reconquista 9/26 15.5 26.2 41.7 25.4 1,120.8 239.0 1/9 15.0 24.4 39.4 21.3 526.1 335.9
(1)TmR5R7, average daily mean air temperature during seed filling; SrR5R7, cumulative solar radiation during seed filling; pp‑PETR1R7, precipitation minus
temperature of 14 to 19.3ºC, and then increased, in accordance with Piper & Boote (1999), but in sharp contrast with the results obtained in the present study regarding the response of some amino acids to temperature. In previous studies, TmR5R7 accounted
for a small fraction of the variation in total protein
concentration: adjusted R2 = 0.019 in Piper & Boote
(1999) and adjusted R2 = 0.045 in Carrera et al. (2009).
However, Dornbos & Mullen (1992) observed that
protein concentration decreased above 21ºC, whereas
Kumar et al. (2006) found that protein concentration
was positively associated with the mean temperature
during soybean development under field experiments.
As to water availability, Carrera et al. (2009) stated
that, under water stress conditions in the field,
protein had a linear positive association with TmR5R7,
indicating increasing protein concentration with rising temperatures and a linear negative correlation
with increasing water deficit. By contrast, Kumar
et al. (2006) observed that rainfall during soybean
development showed a significantly negative linear
correlation with protein concentration, in agreement
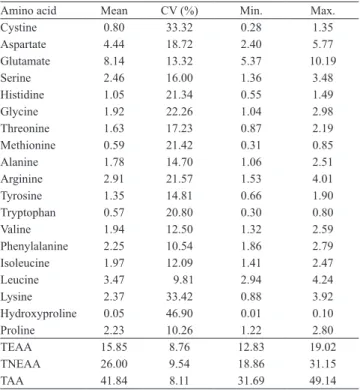
Table 3. Content (% of dry matter) of seed amino acids, coefficient of variation and ranges observed in soybean multi-trials across the Argentine soybean crop.
Amino acid Mean CV (%) Min. Max. Cystine 0.80 33.32 0.28 1.35 Aspartate 4.44 18.72 2.40 5.77 Glutamate 8.14 13.32 5.37 10.19 Serine 2.46 16.00 1.36 3.48 Histidine 1.05 21.34 0.55 1.49 Glycine 1.92 22.26 1.04 2.98 Threonine 1.63 17.23 0.87 2.19 Methionine 0.59 21.42 0.31 0.85 Alanine 1.78 14.70 1.06 2.51 Arginine 2.91 21.57 1.53 4.01 Tyrosine 1.35 14.81 0.66 1.90 Tryptophan 0.57 20.80 0.30 0.80 Valine 1.94 12.50 1.32 2.59 Phenylalanine 2.25 10.54 1.86 2.79 Isoleucine 1.97 12.09 1.41 2.47 Leucine 3.47 9.81 2.94 4.24 Lysine 2.37 33.42 0.88 3.92 Hydroxyproline 0.05 46.90 0.01 0.10 Proline 2.23 10.26 1.22 2.80 TEAA 15.85 8.76 12.83 19.02 TNEAA 26.00 9.54 18.86 31.15 TAA 41.84 8.11 31.69 49.14
TEAA, total essential amino acids; TNEAA, total nonessential amino acids;
TAA, total amino acids.
Table 4. Regression models for essential amino acid contents (% of dry matter), on climatic variables(1), for all crop year, loation souring date, and cultivar combinations.
Explanatory variable
Regression
coefficient Standard error
p Mallows’ Cp
Arginine
Constant 3.00 0.07 <0.0001
pp-PETR1R7 (linear) -0.0015 0.00041 0.0003 14.81
Histidine
Constant 1.53 0.16 <0.0001
pp-PETR1R7 (linear) -0.00061 0.00016 0.0004 16.61
SrR5R7 (linear) -0.0011 0.00038 0.0049 11.27
SrR5R7 (quadratic) 5.7E 07 2.1E 07 0.0076 10.42
Isoleucine
Constant -1.42 1.28 0.2698
TmR5R7 (linear) 0.32 0.13 0.0142 8.22
TmR5R7 (quadratic) -0.01 0.0031 0.0205 7.53
Leucine
Constant -2.02 1.62 0.2161
pp-PETR1R7 (linear) 0.0011 0.0002 <0.0001 30.74
TmR5R7 (linear) 0.52 0.16 0.0020 13.13
TmR5R7 (quadratic) -0.01 0.004 0.0031 12.18
Lysine
Constant 19.25 4.07 <0.0001
TmR5R7 (linear) -1.72 0.41 0.0001 19.79
TmR5R7 (quadratic) 0.04 0.01 <0.0001 20.28
Methionine
Constant -0.65 0.70 0.3541
TmR5R7 (linear) 0.13 0.07 0.0500 5.69
TmR5R7 (quadratic) -0.0035 0.0017 0.0432 6.18
Phenylalanine
Constant -1.97 1.27 0.1230
TmR5R7 (linear) 0.42 0.13 0.0012 13.10
TmR5R7 (quadratic) -0.01 0.0031 0.0013 13.05
Threonine
Constant 2.08 0.19 <0.0001
pp-PETR1R7 (linear) -0.00098 0.0002 <0.0001 27.44
SrR5R7 (linear) -0.00096 0.00046 0.0398 7.32
SrR5R7 (quadratic) 4.9E-07 2.5E-07 0.0506 6.90
Tryptophan
Constant 0.80 0.08 <0.0001
pp-PETR1R7 (linear) -0.00032 8.8E-05 0.0006 15.80
SrR5R7 (linear) -0.00048 0.0002 0.0217 8.43
SrR5R7 (quadratic) 2.2E-07 1.1E-07 0.0492 6.95
Valine
Constant -0.08 1.36 0.9520
TmR5R7 (linear) 0.19 0.14 0.1539 4.06
TmR5R7 (quadratic) -0.0046 0.0033 0.1688 3.92
(1)TmR5R7, average daily mean air temperature during seed filling; SrR5R7, cumulative solar radiation during seed filling; pp‑PETR1R7, precipitation minus potential evapotranspiration during the whole reproductive period.
with Dornbos & Mullen (1992), who reported increases
observed, probably due to the fact that amino acids were considered all together in protein variation analyses, in response to different environmental factors, unlike in the present study, in which each amino acid responded differently to TmR5R7 and pp-PETR1R7, when analyzed
independently. Therefore, further studies based on manipulative experiments are required to fully elucidate the physiological mechanisms regulating
the differential amino acid responses to environmental
conditions during seed filling.
Polynomial quadratic functions were fitted for
his, thr, trp, gly, and HO-pro with SrR5R7 combined
with linear functions for pp-PETR1R7, indicating
that decreases of all these amino acids occurred under conditions of higher solar radiation and water availability (Tables 4 and 5). Likewise, tyrosine was negatively related to SrR5R7 through a polynomial
quadratic function (Table 5), serine displayed negative linear relationships both with pp-PETR1R7 and SrR5R7,
and arginine showed a linear negative association with pp-PETR1R7 (Table 4).
The negative response of some amino acids to more favorable environmental conditions, such as higher solar radiation and water availability, could be attributed to a dilution effect, contributing to the decline of protein concentration, which is a result of the accumulation of relatively higher oil content in seeds. This is supported by the highly negative correlation between oil and protein concentration, often reported in the literature, which is frequently related to yield increase, since there is also a negative correlation between protein and
yield (Wilcox & Shibles, 2001; Proulx & Naeve,
2009). In fact, cumulative solar radiation during the
seed filling period was positively related to yield
(p = 0.009), probably due to an increase in seed weight (Aguirrezábal et al., 2003). This relationship supports the negative correlation between seed yield and seed protein concentration found in other studies on soybean (Wilcox & Shibles, 2001). Although these inferences are valid for a group of only eight amino acids, which represent 42% of the total, they should be considered in future studies along with the inferences for ileu, met, phe, ala, glu, pro, asp, lys, leu, and cys, since they provide background information, indicating that each amino acid behaves differently under different environmental conditions.
In this context, the present study is the first step in
what could be a more comprehensive investigation to improve and provide insights for soybean management strategies in order to maximize levels of protein and its quality. An in-depth research is required to complement the present study and to draw a clear conclusion on how environment conditions during
the seed filling period may influence the quality of
soybean seed protein. Moreover, it would be interesting to assess how climatic factors regulate soybean seed
Table 5. Regression models for nonessential amino acid content (% of dry matter), on climatic variables(1), for all crop year, loation souring date, and cultivar combinations.
Explanatory variable
Regression
coefficient Standard error
p Mallows’ Cp
Alanine
Constant -1.15 1.46 0.4311
TmR5R7 (linear) 0.29 0.15 0.0470 6.03
TmR5R7 (quadratic) -0.01 0.0036 0.0479 6.00
Aspartate
Constant 2.28 0.69 0.0014
TmR5R7 (linear) 0.10 0.03 0.0022 10.90
Cystine
Constant -2.5 1.42 0.0823
pp-PETR1R7 (linear) 0.00053 0.00018 0.0039 11.73
TmR5R7 (linear) 0.32 0.14 0.0246 8.20
TmR5R7 (quadratic) -0.01 0.0035 0.0260 8.10
Glutamate
Constant -16.09 5.56 0.0049
TmR5R7 (linear) 2.42 0.55 <0.0001 20.88
TmR5R7 (quadratic) -0.06 0.01 <0.0001 20.76
Glycine
Constant 2.74 0.29 <0.0001
pp-PETR1R7 (linear) -0.0014 0.00031 <0.0001 24.08
SrR5R7 (linear) -0.0017 0.00071 0.0194 8.63
SrR5R7 (quadratic) 7.9E-07 3.8E 07 0.0419 7.23
Proline
Constant -1.84 2.16 0.3977
TmR5R7 (linear) 0.44 0.22 0.0457 6.08
TmR5R7 (quadratic) -0.01 0.01 0.0315 6.74
Serine
Constant 2.81 0.1 <0.0001
pp-PETR1R7 (linear) -0.00094 0.00026 0.0005 14.83
SrR5R7 (linear) -0.00041 0.00013 0.0022 11.89
Tyrosine
Constant 1.57 0.13 <0.0001
SrR5R7 (linear) -0.00062 0.00033 0.0508 5.61
SrR5R7 (quadratic) 3.7E-07 1.8E-07 0.0422 6.22
Hydroxyproline
Constant 0.09 0.02 <0.0001
pp-PETR1R7 (linear) -4.1E-05 1.8E-05 0.0217 8.43
SrR5R7 (linear) -0.00012 4.1E-05 0.0056 11.03
SrR5R7 (quadratic) 7.1E-08 2.2E-08 0.0019 13.19
(1)Tm
amino acid accumulation through their effect on seed metabolism and development, which determines the
final concentration of these components.
Conclusions
1. Amino acid composition of soybean grains is strongly affected by environmental factors during the
seed filling period.
2. Average daily mean air temperature and cumulative
solar radiation during seed filling, precipitation
minus potential evapotranspiration during the whole reproductive period, as well as combinations of these
climatic variables, are significant explanatory variables
for all amino acids, except valine.
3. Each amino acid behaves differently according to environmental conditions, indicating compensatory effects among them.
Acknowledgments
To Consejo Nacional de Investigaciones Científicas y Técnicas, Universidad de Buenos Aires and Agencia Nacional de Promoción Científica y Tecnológica, for financial support; to Inta Soybean Network, for providing seed samples and technological support;
to Graciela Cazenave, Graciela Galvani, and Rafael Rodríguez, for providing meteorological data from
Inta Instituto de Clima y Agua; to Carlos Somoza, for performing amino acid analyses; and to Julio Di
Rienzo, for suggestions on statistical analyses.
References
AGUIRREZÁBAL, L.A.N.; LAVAUD, Y.; DOSSIO, G.A.A.; IZQUIERDO, N.G.; ANDRADE, F.H.; GONZÁLEZ, L.M. Intercepted solar radiation during seed filling determines sunflower weight per seed and oil concentration. Crop Science, v.43, p.152-161, 2003.
BAIGORRI, H.E. El cultivo de la soja en Argentina. In: BAIGORRI, H.E.; ROBINET, H.; TOMASSO, J.C.; SUAREZ, J.C. (Ed.). Elección de cultivares. Córdoba: Instituto Nacional de Tecnología
Agropecuaria, 1997. p.106-122.
BOYDAK, E.; ALPASLAN, M.; HAYTA, M.; GERÇEK, S.; SIMSEK, M. Seed composition of soybeans grown in the Harran Region of Turkey as affected by row spacing and irrigation. Journal of Agricultural and Food Chemistry, v.50, p.4718-4720, 2002. CARRERA, C.; MARTÍNEZ, M.J.; DARDANELLI, J.; BALZARINI, M. Environmental variation and correlation of seed components in non‑transgenic soybeans: protein, oil, unsaturated fatty acids, tocopherols and isoflavones. Crop Science, v.51, p.800-809, 2011.
CARRERA, C.; MARTÍNEZ, M.J.; DARDANELLI, J.; BALZARINI, M. Water deficit effect on the relationship between temperature during the seed fill period and soybean seed oil and protein concentrations. Crop Science, v.49, p.990-998, 2009. DI RIENZO, J.A.; CASANOVES, F.; BALZARINI, M.G.; GONZALEZ, L.; TABLADA, M.; ROBLEDO, C.W. InfoStat: software estadístico. Versión 2009. Córdoba: Universidad Nacional de Córdoba, 2009.
DORNBOS, D.L.; MULLEN, R.E. Soybean seed protein and oil contents and fatty acid composition adjustments by drought and temperature. Journal of the American Oil Chemists Society, v.69, p.228-231, 1992.
FEHR, W.R.; CAVINESS, C.E. Stages of soybean development. Ames: Iowa State University of Science and Technology, 1977. 11p. (Special report, 80)
GAO, X.; CUI, C.; REN, J. Changes in the chemical composition of traditional Chinese-type soy sauce at different stages of manufacture and its relation to taste. International Journal of Food Science and Technology, v.46, p.243-249, 2011.
GRIESHOP, C.M.; FAHEY, G.C. Comparison of quality characteristics of soybeans from Brazil, China, and the United States. Journal of Agricultural and Food Chemistry, v.49, p.2669-2673, 2001.
HORWITZ, W. (Ed.). Official methods of analysis of AOAC
International. 18th ed. Gaithersburg: AOAC International, 2005.
Irregular paging.
INTERGOVERNMENTAL PANEL ON CLIMATE CHANGE.
The intergovernmental panel on climate change. Available at:
<http://www.ipcc.ch>. Accessed on: 5 Jun. 2009.
KARR‑LILIENTHAL, L.K.; GRIESHOP, C.M.; MERCHEN, N.R.; MAHAN, D.C.; FAHEY, G.C. Chemical composition and protein quality comparisons of soybeans and soybean meals from five leading soybean‑producing countries. Journal of Agricultural and Food Chemistry, v.52, p.6193-6199, 2004.
KARR‑LILIENTHAL, L.K.; GRIESHOP, C.M.; SPEARS, J.K.; FAHEY JUNIOR, G.C. Amino acid, carbohydrate, and fat composition of soybean meals prepared at 55 commercial U.S. soybean processing plants. Journal of Agricultural and Food Chemistry, v.53, p.2146-2150, 2005.
KUMAR, V.; RANI, A.; SOLANKI, S.; HUSSAIN, S.M. Influence of growing environment on the biochemical composition and physical characteristics of soybean seed. Journal of Food Composition and Analysis, v.19, p.188-195, 2006.
MATEOS‑APARICIO, I.; REDONDO CUENCA, A.; VILLANUEVA‑SUÁREZ, M.J.; ZAPATA‑REVILLA, M.A. Soybean, a promising health source. Nutrición Hospitalaria, v.23, p.305-312, 2008.
PENMAN, H.L. Natural evaporation from open water, bare soil, and grass. Proceedings of the Royal Society London, Series A:
PROULX, R.A.; NAEVE, S.L. Pod removal, shade, and defoliation effects on soybean yield, protein, and oil. Agronomy Journal, v.101, p.971-978, 2009.
ROSE, I.A. Effects of moisture stress on the oil and protein components of soybean seeds. Australian Journal of Agricultural Research, v.39, p.163-170, 1988.
THUZAR, M.; PUTEH, A.B.; ABDULLAH, N.A.P.; MOHD, M.B.; LASSIM, K.J. The effects of temperature stress on the quality and yield of soya bean [(Glycine max L.) Merrill.]. Journal of Agricultural Science, v.2, p.172-179, 2010.
WILCOX, J.R.; SHIBLES, R.M. Interrelationships among seed quality attributes in soybean. Crop Science, v.41, p.11-14, 2001. WILSON, R. Seed composition. In: STEWART, B.A.; NIELSEN, D.R. (Ed.). Soybeans: improvement, production and uses. 3rd
ed. Madison: ASA/CSSA/SSSA, 2004. p.621‑677. (Agronomy monograph, 16).
WOLF, R.B.; CAVINS, J.F.; KLEIMAN, R.; BLACK, L.T. Effect of temperature on soybean seed constituents: oil, protein, moisture, fatty acids, amino acids and sugars. Journal of the American Oil Chemists Society, v.59, p.230-232, 1982.